Transcription
Helping immigrantstudents to succeedat school – and beyond
How school systems respond to migration hasan enormous impact on the economic and socialwell-being of all members of the communitiesthey serve, whether they have an immigrantbackground or not. Some systems need tointegrate large numbers of school-age migrantsand asylum seekers quickly; some need toaccommodate students whose mother tongue is different from thelanguage spoken in the host community or whose families are socioeconomically disadvantaged; some systems are confronted with allthree challenges at once.The following pages reveal some of the difficulties immigrantstudents encounter – and some of the contributions they offer –while settling into their new communities and new schools. They alsosummarise some of the policies governments can implement to helpimmigrant students integrate into their host societies. The materialis taken from a forthcoming report drafted by Francesca Borgonovi,Rowena Phair and Mario Piacentini.The fact that the educational, social and emotional success ofimmigrant students differs so widely across countries, and thatcountries pursue such different policies and practices in leveragingthe potential of immigrant children, underlines that there is muchthat countries can learn from each other.Andreas SchleicherDirector, OECD Directorate for Education and SkillsHELPING IMMIGRANT STUDENTS TO SUCCEED AT SCHOOL – AND BEYOND OECD 20151
Immigrant students’performance in schoolIn most countries, first-generation immigrant students(students born outside the destination country whoseparents were also born outside that country) performworse than students without an immigrant background,and second-generation immigrant students (those born inthe destination country to parents who were born outsideof the country) perform somewhere between the two. Asshown in Figure 1, although many immigrant studentsperform relatively poorly compared to non-immigrantstudents, they can perform at high levels by internationalstandards. As the figure also shows, the performance ofimmigrant students differs widely across countries.The performance gap between first-generation immigrantstudents and students without an immigrant backgroundtends to be wider in reading than in mathematics orproblem solving. This suggests that language barriersto text comprehension may be key in explainingperformance differences between these two groups ofstudents.Figure 1: Immigrant students’ performance in problemsolving, mathematics and readingPerformance in computer-based problem solvingFirst-generation ISecond-generation ustriaChileBelgiumWhere do immigrant students farebetter?OECD averageImmigrant students tend to perform better in PISA incountries with highly selective immigration policies.But while the culture and education students hadacquired before migrating have a profound impact onstudents’ achievement at school, the performance ofimmigrant students is even more strongly related to thecharacteristics of the school systems in their host country.GermanyUnited Arab EmiratesIsraelCroatiaSerbiaPortugalRussian FederationCzech RepublicIrelandUnited StatesUnited KingdomHong 0500600700Mean scoreFor each chart, countries and economies are ranked in ascending order ofthe mean score of first-generation immigrant students.Source: OECD, PISA 2012 Database.2HELPING IMMIGRANT STUDENTS TO SUCCEED AT SCHOOL – AND BEYOND OECD 2015
Figure 1: Immigrant students’ performance in problem solving, mathematics and reading (continued)Reading performanceMathematics performanceFirst-generation ISecond-generation INon-immigrantFirst-generation IMexicoMexicoBrazilBrazilArgentinaArgentinaCosta landItalyMontenegroJordanDenmarkCosta rbiaPortugalPortugalOECD averageOECD an FederationRussian FederationUnited ensteinNetherlandsLuxembourgSwitzerlandCzech RepublicCzech RepublicUnited StatesUnited Arab EmiratesIsraelUnited KingdomUnited Arab EmiratesLiechtensteinUnited KingdomIrelandShanghai-ChinaNew ZealandNew nadaAustraliaMacao-ChinaCanadaHong Kong-ChinaHong Kong-ChinaSingaporeSecond-generation INon-immigrantSingapore300400500600700Mean score300400500600Mean scoreFor each chart, countries and economies are ranked in ascending order of the mean score of first-generation immigrant students.Source: OECD, PISA 2012 Database.HELPING IMMIGRANT STUDENTS TO SUCCEED AT SCHOOL – AND BEYOND OECD 20153
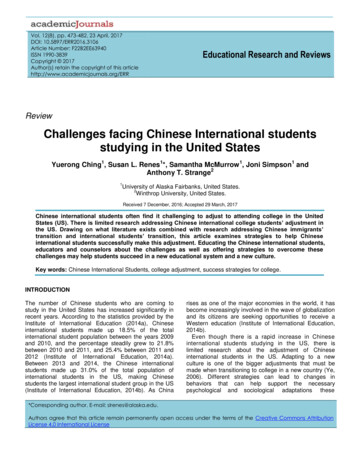
Figure 2 shows how, for a selected group of countries withavailable information, immigrant students from the samecountry of origin and of similar socio-economic statusperform across different destination countries.On average, students from Arabic-speaking countrieswho settled in the Netherlands score 100 points higher inmathematics than students from the same countries oforigin who settled in Qatar, after accounting for socioeconomic status. Albanian students in Greece score50 points higher in mathematics than Albanian studentswho settled in Montenegro – a difference that is very closeto the average performance difference between Greeceand Montenegro. Students born in mainland China scoreabove the OECD average in several destination countries/economies, but they tend to perform better in Hong KongChina than in Macao-China.Of course, it is not only socio-economic status thatcontributes to differences in performance of immigrantstudents from the same country of origin who settle indifferent destination countries; other factors also play arole, including students’ own motivation or the level ofsupport they receive from their parents. But these findingssuggest that school systems play a large role in integratingimmigrant students – and that some destinationcountries are better than others at nurturing the talentsand abilities of students with different intellectual andcultural backgrounds.Figure 2: Immigrant students’ performance inmathematics, by country of origin and destinationFirst-generation immigrants’ scorein mathematics adjustedfor socio-economic statusSecond-generation immigrants’score in mathematics adjustedfor socio-economic statusStudents from Arabic-speaking countries in:NetherlandsUnited Arab EmiratesDenmarkFinlandQatarStudents from Iraq in:NetherlandsFinlandDenmarkStudents from China in:Hong Kong-ChinaNew ZealandMacao-ChinaAustraliaStudents from Albania in:GreeceSwitzerlandAustriaMontenegroStudents from Bosnia and Herzegovina in:GermanyHas performance improved over time?When examining trends in performance differencesbetween immigrant students and students without animmigrant background, it is important to consider themin the context of changes in the socio-economic profileof students. Education outcomes have improved in manycountries of origin, and migration policies have becomeincreasingly skill-selective.CroatiaAustriaMontenegroStudents from the Russian Federation in:FinlandLatviaIsraelAustriaCzech RepublicKyrgyzstan300350400450500550600PISA score points in mathematicsThe average performance by immigrant group and destinationcountry accounts for differences in socio-economic status. Itcorresponds to the predicted performance of the group if all theimmigrant students who migrated from that country of originand all the non-immigrant students across all the destinationcountries shared the same socio-economic status of the averagestudent.Only destination countries with data on at least 20 immigrantstudents are shown.Sources: OECD, PISA 2003, 2006, 2009, 2012 Databases.4HELPING IMMIGRANT STUDENTS TO SUCCEED AT SCHOOL – AND BEYOND OECD 2015
Figure 3: Change between 2003 and 2012 in immigrantstudents’ mathematics performanceDifference in mathematicsperformance between studentswith and without an immigrantbackground in 2012Difference in mathematicsperformance between studentswith and without an immigrantbackground in 2003Students WITH animmigrant backgroundperform betterHungary-35Australia-29Students WITHOUT an immigrant background perform betterAmong those countries and economies where at least5% of the student population were immigrants in both2003 and 2012, in Belgium, Germany, New Zealand,Switzerland and the United States the difference inmathematics performance between students with animmigrant background and those without narrowedduring the period. In Belgium, Germany and Switzerland,the narrowing is the result of greater performanceimprovements among students with an immigrantbackground than among students without an immigrantbackground. In Germany, the performance disadvantageamong immigrant students shrank: in 2003, nonimmigrant students outscored students with animmigrant background by 81 points in mathematics; by2012 this difference had decreased to 54 score points.Macao-ChinaSlovak Republic-70TurkeyNew Zealand-14IrelandCanadaLatviaHong Kong-ChinaUnited StatesThailandRussian FederationCzech Republic28OECD average 2003 -10By contrast, in Italy, the difference in mathematicsperformance between students with and students withoutan immigrant background widened by 26 score points –from a 22-point difference, which was not statisticallysignificant, in 2003 to 48 score points in 2012. This changereflected an improvement among students without animmigrant background between 2003 and 2012, but noconcurrent improvement among immigrant students. InCanada, France and Sweden, the performance of bothsecond-generation students and students without animmigrant background deteriorated between 2003 and2012, but the decline among second-generation immigrantstudents was particularly GreeceIcelandSpainGermanyStill, changes in the performance of immigrant studentsover time also suggest that education policies cancomplement social policies in fostering integration. Thedifference in mathematics performance between studentswith and without an immigrant background shrank byaround 10 score points, on average, between 2003 and2012 (Figure 3). This reduction is still observed even whencomparing students of similar socio-economic 80100 120Score-point differenceCountries and economies are ranked in ascending order of the score-pointdifference between students with and without an immigrant background.Notes: Differences in mathematics performance between studentswithout and with an immigrant background in 2003 and 2012 thatare statistically significant are marked in a darker tone.Only countries and economies with comparable data from PISA2003 and PISA 2012 are shown.The change in the score-point difference in mathematics betweenstudents without and with an immigrant background between2012 and 2003 is shown next to the country’s/economy’s namewhen statistically significant.OECD average 2003 compares only OECD countries withcomparable mathematics scores since 2003.Source: OECD, PISA Database 2012, Table II.3.4b.HELPING IMMIGRANT STUDENTS TO SUCCEED AT SCHOOL – AND BEYOND OECD 20155
Immigrant students’sense of belonging at schoolBeyond performance in school, an indication of howwell immigrant students are integrating into their newcommunity is whether, and to what extent, they feel theybelong to their new surroundings – and, for 15-year-olds,one of the most important social environments is school.In 2003 and 2012, PISA asked students whether theystrongly agreed, agreed, disagreed or strongly disagreedthat they feel like they belong at school. The results variedwidely, not only overall, but also in the extent to whichfirst- and second-generation immigrant students weremore or less likely than students without an immigrantbackground to feel that they belong at school (Figure 4).Countries can be divided into three groups, based onstudents’ responses in 2012. In a first group, whichincludes the United Kingdom and the United States,first-generation immigrant students expressed a strongersense of belonging at school than other students, whilestudents without an immigrant background and secondgeneration immigrant students expressed a similar senseof belonging.In a second group of countries, which includes Argentina,Denmark, France and Mexico, second-generationimmigrant students feel most alienated in their schoolsand have less of a sense of belonging than studentswithout an immigrant background and first-generationimmigrant students.Where do immigrant students feel likethey belong at school?Figure 5 takes these results one step further and showsthe percentage of immigrant students who reported thatthey feel like they belong at school by country of originand country of destination. As the figure shows, almost90% of students from Iraq who settled in Finland reportedthat they feel like they belong at school, but only 69% ofstudents from Iraq who settled in Denmark reported thesame. Similarly, only 64% of students who migrated toDenmark from Turkey reported feeling like they belongat school while 93% of those who migrated to Finland soreported. And while 73% of students who migrated fromArabic-speaking countries to Denmark reported that theyfeel like they belong at school, 90% of those who migratedto Finland so reported.These results suggest that the psychological wellbeing of immigrant students is affected not only bydifferences between their country of origin and countryof destination, but also by how well the schools and localcommunities in their country of destination help them toovercome the myriad obstacles they face in succeeding atschool and building a new life.In a third group of countries, which includes Italy, Norway,Spain, Sweden and Switzerland, integration appears to beprogressive, with second-generation immigrant studentsreporting a similar or almost similar sense of belongingat school as students without an immigrant background,and first-generation students reporting less of a sense ofbelonging.6HELPING IMMIGRANT STUDENTS TO SUCCEED AT SCHOOL – AND BEYOND OECD 2015
Figure 4: Sense of belonging at school, by immigrantbackgroundPercentage of students who reported that they feel like theybelong at schoolFirst-generation immigrant ISecond-generation immigrant INon-immigrantFranceBelgium-10Figure 5: Sense of belonging of immigrant students indifferent destination countriesMontenegroMacao-ChinaLuxembourgPercentage of students with an immigrant background whoreported that they feel like they belong at school-15Sense of belongingCzech RepublicBrazilItalyStudents from Arabic-speaking countries in:-9NetherlandsHong Kong-ChinaUnited Arab rkStudents from Iraq in:GermanySwitzerland-7FinlandDenmarkChileOECD average-5Students from China in:SloveniaNew ZealandNorway-8Portugal-11AustraliaHong Kong-ChinaMacao-ChinaSerbiaRussian FederationAustraliaStudents from Albania in:4GreeceIcelandSwitzerlandNew Zealand5Qatar6Students from Bosnia and Herzegovina ndStudents from the Russian Federation in:AustriaFinlandSingaporeLatviaJordanUnited KingdomStudents from Turkey in:United Arab SwitzerlandUnited StatesGermanyIsraelDenmarkCosta ntina020406080100%Countries and economies are ranked in ascending order of the percentageof first-generation immigrant students who reported that they feel likethey belong at school.9095100%The coverage of destination countries is limited by the fact thatonly some countries collect detailed information on the countryof birth of immigrants.Only destination countries with data on atleast 20 immigrant students are shown.Sources: OECD, PISA 2003, 2006, 2009, 2012 Databases.Note: Statistically significant percentage-point differences betweenfirst-generation immigrant students and non-immigrant studentswho reported that they feel like they belong at school are shownnext to the country/economy name.Source: OECD, PISA 2012 Database.HELPING IMMIGRANT STUDENTS TO SUCCEED AT SCHOOL – AND BEYOND OECD 20157
The concentration of disadvantagein schools hosting immigrantstudentsWhen they move to a new country, many immigrantstend to settle in neighbourhoods with other immigrants,often from the same country of origin and of the samesocio-economic status. They may decide to do this as away to build a network of people who share their cultureor their experience as migrants and who also may be ableto help newly arrived migrants make their way throughadministrative procedures and perhaps even find work.But they may also move to these areas because of socioeconomic deprivation, which limits the range of areaswhere they can relocate.Similarly, immigrant students tend to be concentratedin the same schools, sometimes because they live in thesame neighbourhoods, but sometimes because schoolsystems group them together, whether or not they areneighbours, or because they show similar performancepatterns. Figure 6 shows that many students withan immigrant background attend schools where theproportion of other immigrant students is large; in otherwords, in many countries, immigrant students tend to beconcentrated in the same schools.What hinders student achievement?The concentration of immigrant students in schools doesnot, in itself, have to have adverse effects on studentperformance or on integration efforts. PISA revealsProvide information to immigrant parents onthe schooling options available for their childrenand help parents to overcome financial and/orlogistical barriers to access the school of theirchoice.Limit the extent to which advantaged schoolscan select students based on socio-economicstatus. This can be done by providing financialincentives for over-subscribed schools to enrolmigrant students.8that it is not the concentration of immigrant studentsin a school but, rather, the concentration of socioeconomic disadvantage in a school that hinders studentachievement.Figure 7 shows that, across OECD countries, 15-year-oldstudents who attend schools where the concentrationof immigrants is high (i.e. where more than one in fourstudents are immigrants) tend to do worse in schoolthan students who attend schools where there are noimmigrant students. But this difference reflects the factthat many immigrant students are socio-economicallydisadvantaged. The OECD average difference inmathematics performance between students who attendschools where more than 25% of students are immigrantscompared to students who attend schools with noimmigrant students is 18 score points – the equivalent ofaround 6 months of schooling. But after accounting for thesocio-economic status of the students and schools, thatdifference is more than halved – to 5 score points. Indeed,in 14 out of 35 countries/economies with comparabledata, students in schools with high concentrations ofimmigrant students underperform in mathematics, beforeaccounting for socio-economic disparities. After takingthose disparities into account, the number of countries/economies where these students underperform drops to 7;and in most of them, the performance differences are sonarrow that they are practically insignificant.Retain and attract more advantaged studentsin schools that also host immigrant students.For example, schools in disadvantaged areas canmake their curricula more appealing to studentsfrom across the socio-economic spectrum byoffering special mathematics, science and/or artcourses.HELPING IMMIGRANT STUDENTS TO SUCCEED AT SCHOOL – AND BEYOND OECD 2015
Figure 7: Concentration of disadvantage and its effectson student performanceScore-point difference in mathematics between schools witha high concentration of immigrant students and those withoutimmigrant studentsBefore accounting for studentand school socio-economicstatusAfter accounting for studentand school socio-economicstatusStudents in schools with a high Students in schools with a highconcentration of immigrantconcentration of immigrantstudents perform worsestudents perform betterGreeceFigure 6: Concentration of immigrant students in schoolsBelgiumPercentage of immigrant students in schools where at least halfof the students are immigrantsNetherlandsSloveniaArgentinaHong Kong-ChinaItalyGermanyGermanyArgentinaHong Kong-ChinaSwitzerlandCosta lNew ZealandEstoniaBelgiumOECD averageUnited StatesDenmarkFranceAustriaSpainLuxembourgOECD iaSwitzerlandUnited ChinaSerbiaNorwayNorwayDenmarkUnited StatesItalyUnited KingdomCanadaRussian FederationGreeceQatarQatarCanadaUnited Arab EmiratesUnited Arab Emirates50556065707580859095100%Countries and economies are ranked in ascending order of the thepercentage of students with an immigrant background in schools whereat least half of the students have an immigrant background.Source: OECD, PISA 2012 Database.JordanAustraliaNew ZealandIsraelSingapore-100 -80-60-40-200204060 80 100Score-point differenceCountries and economies are ranked in ascending order of the score-pointdifference in mathematics between schools with a high concentrationof immigrant students and schools without immigrant students, beforeaccounting for student and school socio-economic status.Notes: Statistically significant differences are marked in a darkertone.Schools with a high concentration of immigrants are defined asthose where more than a quarter of students are immigrants.Source: PISA 2012 Database, Table II.3.9.HELPING IMMIGRANT STUDENTS TO SUCCEED AT SCHOOL – AND BEYOND OECD 20159
Language barriersand performance penaltiesfor late arrivalsMany newly arrived immigrant students cannot yet reador speak well – if at all – the predominant language oftheir host countries. On average, 63% of first-generationimmigrant students and 38% of second-generationimmigrant students speak a language at home that isdifferent from the language in which the PISA test wasconducted. In the Czech Republic, Finland, Iceland, Israel,Slovenia and Sweden, more than 8 in 10 first-generationstudents speak a different language at home from thelanguage of assessment, while in Chile, Costa Rica,Croatia, Kazakhstan, Montenegro and Serbia, fewer thanone in ten first-generation immigrant students speaks adifferent language.Not surprisingly, students who do not speak or readthe language of assessment perform worse on the PISAreading test than students who do – so much so that, asFigure 8 shows, the performance gap in reading betweenfirst-generation immigrant students and non-immigrantstudents shrinks considerably once the language studentsspeak at home is taken into account. These results showthe importance of offering language training to recentlyarrived immigrants students of all ages.Why does age at arrival matter?in the same grade in reading proficiency than immigrantswho arrived at younger ages. Countries and economiesvary markedly in the magnitude of this “late-arrivalpenalty” for immigrant students; and these differencestend to reflect the profile of the immigrant populations.Take, for example, the cases of Australia and Switzerland(Figure 9). Students who were born in China andimmigrate to Australia suffer a steep late-arrival penalty.The same pattern is seen in European countries. The ageat arrival seems to make no difference to the readingperformance of German students who immigrate toSwitzerland; but 15-year-old students from Portugaland the former Yugoslavia who had immigrated withinthe previous few years did much worse in reading thanimmigrant students from the same countries who hadspent all their school years in Switzerland.For recent immigrants, a lack of familiarity with their newcountry’s language and institutions, as well as insecureliving conditions, can result in lower reading performance.But age at arrival has its own effect on reading proficiency:learning a second (or third) language is more difficultfor older children, and the school curriculum tends tobe freighted with many more competing demands asstudents progress from primary to lower secondaryschool.In most OECD countries, immigrant students who arrivedat the age of 12 or older – and have spent at most fouryears in their new country – lag farther behind studentsIntegrate language and subject learning fromthe earliest grades.Integrating migrant children into mainstreamclasses from the beginning of their schooling isassociated with better outcomes than enrollingthem first in preparatory language classes anddelaying entry into mainstream courses. Whilelanguage training is essential, it should be offeredin addition to, not instead of, regular course work.10Help teachers to identify students who needlanguage training.Some countries, including Denmark andGermany, systematically assess children of preschool age in their language abilities. Strategiesand pedagogies for developing second-languageskills should be covered in both initial andin-service training for teachers who work withimmigrant students.HELPING IMMIGRANT STUDENTS TO SUCCEED AT SCHOOL – AND BEYOND OECD 2015
Figure 8: Performance gap in reading and language spokenat homeDifference in reading performance between non-immigrant andimmigrant students before and after accounting for the languagespoken at homeAfter accounting for differencesin language spoken at homeBefore accounting for differencesin language spoken at sEstoniaIcelandGreeceGermanyRussian FederationNorwayCosta RicaOECD d KingdomCzech RepublicLithuaniaMalaysiaLatviaHong Kong-ChinaIrelandMontenegroChileCanadaUnited StatesNew iaSingaporeSlovak RepublicUnited Arab EmiratesQatarFigure 9: The language barrier is higher when immigrantstudents arrive laterRelationship between PISA reading score and age at arrival inselected destination countries, by immigrants’ originAustraliaScore-point difference compared with Africa15Age at arrivalChinaSwitzerlandScore-point difference compared with ex-Yugoslavia15Age at arrivalPortugalNote: All estimates control for PISA year, gender and student’sgrade.Source: OECD (2012), Untapped Skills: Realising the Potentialof Immigrant Students, OECD Publishing, Paris,http://dx.doi.org/10.1787/9789264172470-en, Figure 4.3, basedon analysis of PISA pooled data 2003, 2006, 2009 by Heath andKilpi-Jakonen (2012). Only immigrant groups with more than100 observations are shown.-100 -80-60-40-200204060 80 100Score-point differenceCountries and economies are ranked in descending order of the differencein reading performance after accounting for the language spoken athome.Note: Statistically significant differences are marked in a darkertone.Source: OECD, PISA 2012 Database.HELPING IMMIGRANT STUDENTS TO SUCCEED AT SCHOOL – AND BEYOND OECD 201511
The advantages of early learningprogrammesWhile it is important to offer older immigrant studentsthe assistance they need, particularly language support,absorbing the youngest immigrant children into theschool system is certainly the most effective way ofintegrating them – linguistically and culturally – intotheir new communities. As Figure 10 shows, 15-year-oldimmigrant students who reported that they had attendedpre-primary education programmes score 49 pointshigher in the PISA reading assessment, on average, thanimmigrant students who reported that they had notparticipated in such programmes.But in most countries, participation in pre-primaryeducation programmes among immigrant students isconsiderably lower than it is among students withoutExpand access to high-quality early childhoodeducation and care programmes to encourageentry at the youngest possible age.Tailor programmes to the needs of pre-schoolmigrant children, particularly by offeringlanguage-development activities.Reach out to migrant parents to raise theirawareness of the learning programmes availablefor their children and how they can enrol theirchildren in these programmes.12an immigrant background (Figure 11). On average,immigrant students are 21% less likely than studentswith no immigrant background to have attended preprimary education. In some countries, this may be dueto a resistance to these types of programmes amongimmigrant parents, possibly because they had little or noexperience with them in their country of origin. In othercountries, this difference in participation rates is stronglylinked to differences in socio-economic status betweenthe two groups. Still, there are large differences acrosscountries. For example, in Italy, children of immigrantsare 3.4 times less likely than children with no immigrantbackground to attend pre-primary schooling, afteraccounting for socio-economic status.Monitor the quality of early childhoodeducation and care programmes. The qualityof these programmes is not only measured bywhether or not they comply with regulations,but by whether instructors are well-trained inworking with young children and by whether thechildren’s individual needs have been identifiedand are being met.HELPING IMMIGRANT STUDENTS TO SUCCEED AT SCHOOL – AND BEYOND OECD 2015
Figure 11: Attendance at pre-primary education andimmigrant backgroundDifference in the likelihood of having attended pre-primaryeducation between immigrant students and non
4 PIG IIGRAT STTS TO SCC AT SCOO A O OC 2015 Figure 2 shows how, for a selected group of countries with available information, immigrant students from the same country of origin and of similar socio-econom