Transcription
Data Mining:Concepts and Techniques
Chapter I: Introduction to Data MiningWe are in an age often referred to as the information age. In this information age, because we believe thatinformation leads to power and success, and thanks to sophisticated technologies such as computers,satellites, etc., we have been collecting tremendous amounts of information. Initially, with the advent ofcomputers and means for mass digital storage, we started collecting and storing all sorts of data, countingon the power of computers to help sort through this amalgam of information. Unfortunately, these massivecollections of data stored on disparate structures very rapidly became overwhelming. This initial chaos hasled to the creation of structured databases and database management systems (DBMS). The efficientdatabase management systems have been very important assets for management of a large corpus of dataand especially for effective and efficient retrieval of particular information from a large collectionwhenever needed. The proliferation of database management systems has also contributed to recentmassive gathering of all sorts of information. Today, we have far more information than we can handle:from business transactions and scientific data, to satellite pictures, text reports and military intelligence.Information retrieval is simply not enough anymore for decision-making. Confronted with huge collectionsof data, we have now created new needs to help us make better managerial choices. These needs areautomatic summarization of data, extraction of the "essence" of information stored, and the discovery ofpatterns in raw data.Data mining is a powerful new technology with great potential to help companies focus on the mostimportant information in their data warehouses. It has been defined as:The automated analysis of large or complex data sets in order to discover significant patterns or trends thatwould otherwise go unrecognised.The key elements that make data mining tools a distinct form of software are:Automated analysisData mining automates the process of sifting through historical data in order to discover newinformation. This is one of the main differences between data mining and statistics, where a model isusually devised by a statistician to deal with a specific analysis problem. It also distinguishes datamining from expert systems, where the model is built by a knowledge engineer from rules extractedfrom the experience of an expert.The emphasis on automated discovery also separates data mining from OLAP and simpler query andreporting tools, which are used to verify hypotheses formulated by the user. Data mining does not relyon a user to define a specific query, merely to formulate a goal - such as the identification of fraudulentclaims.
Large or complex data setsOne of the attractions of data mining is that it makes it possible to analyse very large data sets in areasonable time scale. Data mining is also suitable for complex problems involving relatively smallamounts of data but where there are many fields or variables to analyse. However, for small, relativelysimple data analysis problems there may be simpler, cheaper and more effective solutions.Discovering significant patterns or trends that would otherwise go unrecognisedThe goal of data mining is to unearth relationships in data that may provide useful insights.Data mining tools can sweep through databases and identify previously hidden patterns in one step. Anexample of pattern discovery is the analysis of retail sales data to identify seemingly unrelated productsthat are often purchased together. Other pattern discovery problems include detecting fraudulent creditcard transactions, performance bottlenecks in a network system and identifying anomalous data thatcould represent data entry keying errors. The ultimate significance of these patterns will be assessed by adomain expert - a marketing manager or network supervisor - so the results must be presented in a waythat human experts can understand.Data mining tools can also automate the process of finding predictive information in large databases.Questions that traditionally required extensive hands-on analysis can now be answered directly from thedata — quickly. A typical example of a predictive problem is targeted marketing. Data mining uses dataon past promotional mailings to identify the targets most likely to maximize return on investment infuture mailings. Other predictive problems include forecasting bankruptcy and other forms of default,and identifying segments of a population likely to respond similarly to given events.Data mining techniques can yield the benefits of automation on existing software and hardware platforms toenhance the value of existing information resources, and can be implemented on new products and systemsas they are brought on-line. When implemented on high performance client/server or parallel processingsystems, they can analyse massive databases to deliver answers to questions such as:"Which clients are most likely to respond to my next promotional mailing, and why?"Data mining is ready for application because it is supported by three technologies that are now sufficientlymature: Massive data collection Powerful multiprocessor computers
Data mining algorithmsCommercial databases are growing at unprecedented rates, especially in the retail sector. Theaccompanying need for improved computational engines can now be met in a cost-effective manner withparallel multiprocessor computer technology. Data mining algorithms embody techniques that have existedfor at least 10 years, but have only recently been implemented as mature, reliable, understandable tools thatconsistently outperform older statistical methods.The core components of data mining technology have been under development for decades, in researchareas such as statistics, artificial intelligence, and machine learning. Today, the maturity of thesetechniques, coupled with high-performance relational database engines and broad data integration efforts,make these technologies practical for current data warehouse environments.The key to understanding the different facets of data mining is to distinguish between data miningapplications, operations, techniques and algorithms.ApplicationsDatabase marketingcustomer segmentationcustomer retentionfraud detectioncredit checkingweb site analysisOperationsClassification and predictionclusteringassociation analysisforecastingTechniquesNeural networksdecision treesK-nearest neighbour algorithmsnaive Bayesiancluster analysis
What kind of information are we collecting?We have been collecting a myriad of data, from simple numerical measurements and text documents, tomore complex information such as spatial data, multimedia channels, and hypertext documents. Here is anon-exclusive list of a variety of information collected in digital form in databases and in flat files.Business transactions: Every transaction in the business industry is (often) "memorized" forperpetuity.Such transactions are usually time related and can be inter-business deals such aspurchases, exchanges, banking, stock, etc., or intra-business operations such as management of inhouse wares and assets. Large department stores, for example, thanks to the widespread use of barcodes, store millions of transactions daily representing often terabytes of data. Storage space is notthe major problem, as the price of hard disks is continuously dropping, but the effective use of thedata in a reasonable time frame for competitive decision-making is definitely the most importantproblem to solve for businesses that struggle to survive in a highly competitive world.Scientific data: Whether in a Swiss nuclear accelerator laboratory counting particles, in theCanadian forest studying readings from a grizzly bear radio collar, on a South Pole iceberggathering data about oceanic activity, or in an American university investigating human psychology,our society is amassing colossal amounts of scientific data that need to be analyzed. Unfortunately,we can capture and store more new data faster than we can analyze the old data alreadyaccumulated.Medical and personal data: From government census to personnel and customer files, very largecollections of information are continuously gathered about individuals and groups. Governments,companies and organizations such as hospitals, are stockpiling very important quantities of personaldata to help them manage human resources, better understand a market, or simply assist clientele.Regardless of the privacy issues this type of data often reveals, this information is collected, usedand even shared. When correlated with other data this information can shed light on customerbehaviour and the like.Surveillance video and pictures: With the amazing collapse of video camera prices, video camerasare becoming ubiquitous. Video tapes from surveillance cameras are usually recycled and thus thecontent is lost. However, there is a tendency today to store the tapes and even digitize them forfuture use and analysis.Satellite sensing:There is a countless number of satellites around the globe: some are geo-stationaryabove a region, and some are orbiting around the Earth, but all are sending a non-stop stream of datato the surface. NASA, which controls a large number of satellites, receives more data every secondthan what all NASA researchers and engineers can cope with. Many satellite pictures and data aremade public as soon as they are received in the hopes that other researchers can analyze them.Games: Our society is collecting a tremendous amount of data and statistics about games, playersand athletes. From hockey scores, basketball passes and car-racing lapses, to swimming times,boxers pushes and chess positions, all the data are stored. Commentators and journalists are using
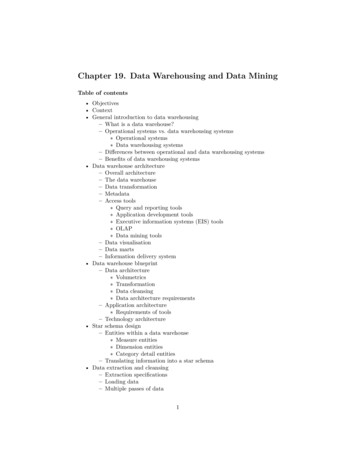
this information for reporting, but trainers and athletes would want to exploit this data to improveperformance and better understand opponents.Digital media: The proliferation of cheap scanners, desktop video cameras and digital cameras isone of the causes of the explosion in digital media repositories. In addition, many radio stations,television channels and film studios are digitizing their audio and video collections to improve themanagement of their multimedia assets. Associations such as the NHL and the NBA have alreadystarted converting their huge game collection into digital forms.CAD and Software engineering data: There are a multitude of Computer Assisted Design (CAD)systems for architects to design buildings or engineers to conceive system components or circuits.These systems are generating a tremendous amount of data. Moreover, software engineering is asource of considerable similar data with code, function libraries, objects, etc., which need powerfultools for management and maintenance.Virtual Worlds: There are many applications making use of three-dimensional virtual spaces.These spaces and the objects they contain are described with special languages such as VRML.Ideally, these virtual spaces are described in such a way that they can share objects and places.There is a remarkable amount of virtual reality object and space repositories available. Managementof these repositories as well as content-based search and retrieval from these repositories are stillresearch issues, while the size of the collections continues to grow.Text reports and memos (e-mail messages): Most of the communications within and betweencompanies or research organizations or even private people, are based on reports and memos intextual forms often exchanged by e-mail. These messages are regularly stored in digital form forfuture use and reference creating formidable digital libraries.The World Wide Web repositories: Since the inception of the World Wide Web in 1993,documents of all sorts of formats, content and description have been collected and inter-connectedwith hyperlinks making it the largest repository of data ever built. Despite its dynamic andunstructured nature, its heterogeneous characteristic, and its very often redundancy andinconsistency, the World Wide Web is the most important data collection regularly used forreference because of the broad variety of topics covered and the infinite contributions of resourcesand publishers. Many believe that the World Wide Web will become the compilation of humanknowledge.What are Data Mining and Knowledge Discovery?With the enormous amount of data stored in files, databases, and other repositories, it is increasinglyimportant, if not necessary, to develop powerful means for analysis and perhaps interpretation of such dataand for the extraction of interesting knowledge that could help in decision-making.Data Mining, also popularly known as Knowledge Discovery in Databases (KDD), refers to the nontrivialextraction of implicit, previously unknown and potentially useful information from data in databases. Whiledata mining and knowledge discovery in databases (or KDD) are frequently treated as synonyms, data
mining is actually part of the knowledge discovery process. The following figure (Figure 1.1) shows datamining as a step in an iterative knowledge discovery process.The Knowledge Discovery in Databases process comprises of a few steps leading from raw data collectionsto some form of new knowledge. The iterative process consists of the following steps:Data cleaning: also known as data cleansing, it is a phase in which noise data and irrelevant dataare removed from the collection.Data integration: at this stage, multiple data sources, often heterogeneous, may be combined in acommon source.Data selection: at this step, the data relevant to the analysis is decided on and retrieved from thedata collection.Data transformation: also known as data consolidation, it is a phase in which the selected data istransformed into forms appropriate for the mining procedure.Data mining: it is the crucial step in which clever techniques are applied to extract patternspotentially useful.Pattern evaluation: in this step, strictly interesting patterns representing knowledge are identifiedbased on given measures.Knowledge representation: is the final phase in which the discovered knowledge is visuallyrepresented to the user. This essential step uses visualization techniques to help users understandand interpret the data mining results.
It is common to combine some of these steps together. For instance, data cleaning and data integration canbe performed together as a pre-processing phase to generate a data warehouse. Data selection and datatransformation can also be combined where the consolidation of the data is the result of the selection, or, asfor the case of data warehouses, the selection is done on transformed data.The KDD is an iterative process. Once the discovered knowledge is presented to the user, the evaluationmeasures can be enhanced, the mining can be further refined, new data can be selected or furthertransformed, or new data sources can be integrated, in order to get different, more appropriate results.Data mining derives its name from the similarities between searching for valuable information in a largedatabase and mining rocks for a vein of valuable ore. Both imply either sifting through a large amount ofmaterial or ingeniously probing the material to exactly pinpoint where the values reside. It is, however, amisnomer, since mining for gold in rocks is usually called "gold mining" and not "rock mining", thus byanalogy, data mining should have been called "knowledge mining" instead. Nevertheless, data miningbecame the accepted customary term, and very rapidly a trend that even overshadowed more general termssuch as knowledge discovery in databases (KDD) that describe a more complete process. Other similarterms referring to data mining are: data dredging, knowledge extraction and pattern discovery.What kind of Data can be mined?In principle, data mining is not specific to one type of media or data. Data mining should be applicable toany kind of information repository. However, algorithms and approaches may differ when applied todifferent types of data. Indeed, the challenges presented by different types of data vary significantly. Datamining is being put into use and studied for databases, including relational databases, object-relationaldatabases and object-oriented databases, data warehouses, transactional databases, unstructured and semistructured repositories such as the World Wide Web, advanced databases such as spatial databases,multimedia databases, time-series databases and textual databases, and even flat files. Here are someexamples in more detail:Flat files: Flat files are actually the most common data source for data mining algorithms,especially at the research level. Flat files are simple data files in text or binary format with astructure known by the data mining algorithm to be applied. The data in these files can be
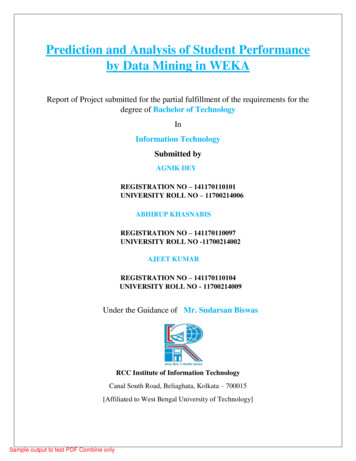
transactions, time-series data, scientific measurements, etc.Relational Databases: Briefly, a relational database consists of a set of tables containing eithervalues of entity attributes, or values of attributes from entity relationships. Tables have columns androws, where columns represent attributes and rows represent tuples. A tuple in a relational tablecorresponds to either an object or a relationship between objects and is identified by a set ofattribute values representing a unique key. In Figure 1.2 we present some relations Customer, Items,and Borrow representing business activity in a fictitious video store OurVideoStore. These relationsare just a subset of what could be a database for the video store and is given as an example.The most commonly used query language for relational database is SQL, which allows retrieval andmanipulation of the data stored in the tables, as well as the calculation of aggregate functions suchas average, sum, min, max and count. For instance, an SQL query to select the videos grouped bycategory would be:SELECT count(*) FROM Items WHERE type video GROUP BY category.Data mining algorithms using relational databases can be more versatile than data mining
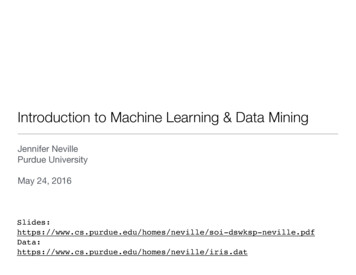
algorithms specifically written for flat files, since they can take advantage of the structure inherentto relational databases. While data mining can benefit from SQL for data selection, transformationand consolidation, it goes beyond what SQL could provide, such as predicting, comparing, detectingdeviations, etc.Data Warehouses: A data warehouse as a storehouse, is a repository of data collected frommultiple data sources (often heterogeneous) and is intended to be used as a whole under the sameunified schema. A data warehouse gives the option to analyze data from different sources under thesame roof. Let us suppose that OurVideoStore becomes a franchise in North America. Many videostores belonging to OurVideoStore company may have different databases and different structures.If the executive of the company wants to access the data from all stores for strategic decisionmaking, future direction, marketing, etc., it would be more appropriate to store all the data in onesite with a homogeneous structure that allows interactive analysis. In other words, data from thedifferent stores would be loaded, cleaned, transformed and integrated together. To facilitatedecision-making and multi-dimensional views, data warehouses are usually modeled by a multidimensional data structure. Figure 1.3 shows an example of a three dimensional subset of a datacube structure used for OurVideoStore data warehouse.The figure shows summarized rentals grouped by film categories, then a cross table of summarizedrentals by film categories and time (in quarters). The data cube gives the summarized rentals alongthree dimensions: category, time, and city. A cube contains cells that store values of some aggregatemeasures (in this case rental counts), and special cells that store summations along dimensions.Each dimension of the data cube contains a hierarchy of values for one attribute.Because of their structure, the pre-computed summarized data they contain and the hierarchical
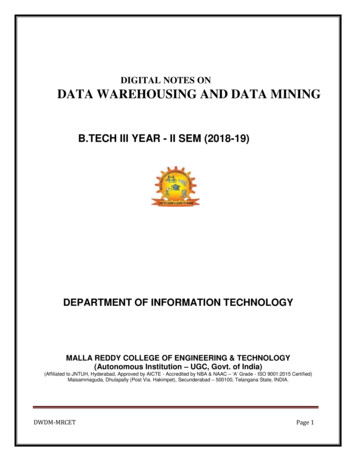
attribute values of their dimensions, data cubes are well suited for fast interactive querying andanalysis of data at different conceptual levels, known as On-Line Analytical Processing (OLAP).OLAP operations allow the navigation of data at different levels of abstraction, such as drill-down,roll-up, slice, dice, etc. Figure 1.4 illustrates the drill-down (on the time dimension) and roll-up (onthe location dimension) operations.Transaction Databases: A transaction database is a set of records representing transactions, eachwith a time stamp, an identifier and a set of items. Associated with the transaction files could alsobe descriptive data for the items. For example, in the case of the video store, the rentals table suchas shown in Figure 1.5, represents the transaction database. Each record is a rental contract with acustomer identifier, a date, and the list of items rented (i.e. video tapes, games, VCR, etc.). Sincerelational databases do not allow nested tables (i.e. a set as attribute value), transactions are usuallystored in flat files or stored in two normalized transaction tables, one for the transactions and one forthe transaction items. One typical data mining analysis on such data is the so-called market basketanalysis or association rules in which associations between items occurring together or in sequenceare studied.
Multimedia Databases: Multimedia databases include video, images, audio and text media. Theycan be stored on extended object-relational or object-oriented databases, or simply on a file system.Multimedia is characterized by its high dimensionality, which makes data mining even morechallenging. Data mining from multimedia repositories may require computer vision, computergraphics, image interpretation, and natural language processing methodologies.Spatial Databases: Spatial databases are databases that, in addition to usual data, store geographicalinformation like maps, and global or regional positioning. Such spatial databases present newchallenges to data mining algorithms.Time-Series Databases: Time-series databases contain time related data such stock market data orlogged activities. These databases usually have a continuous flow of new data coming in, which
sometimes causes the need for a challenging real time analysis. Data mining in such databasescommonly includes the study of trends and correlations between evolutions of different variables, aswell as the prediction of trends and movements of the variables in time. Figure 1.7 shows someexamples of time-series data.World Wide Web: The World Wide Web is the most heterogeneous and dynamic repositoryavailable. A very large number of authors and publishers are continuously contributing to its growthand metamorphosis, and a massive number of users are accessing its resources daily. Data in theWorld Wide Web is organized in inter-connected documents. These documents can be text, audio,video, raw data, and even applications. Conceptually, the World Wide Web is comprised of threemajor components: The content of the Web, which encompasses documents available; the structureof the Web, which covers the hyperlinks and the relationships between documents; and the usage ofthe web, describing how and when the resources are accessed. A fourth dimension can be addedrelating the dynamic nature or evolution of the documents. Data mining in the World Wide Web, orweb mining, tries to address all these issues and is often divided into web content mining, webstructure mining and web usage mining.
What can be discovered?The kinds of patterns that can be discovered depend upon the data mining tasks employed. By and large,there are two types of data mining tasks: descriptive data mining tasks that describe the general propertiesof the existing data, and predictive data mining tasks that attempt to do predictions based on inference onavailable data.The data mining functionalities and the variety of knowledge they discover are briefly presented in thefollowing list:Characterization: Data characterization is a summarization of general features of objects in a targetclass, and produces what is called characteristic rules. The data relevant to a user-specified class arenormally retrieved by a database query and run through a summarization module to extract theessence of the data at different levels of abstractions. For example, one may want to characterize theOurVideoStore customers who regularly rent more than 30 movies a year. With concept hierarchieson the attributes describing the target class, the attribute-oriented induction method can be used, forexample, to carry out data summarization. Note that with a data cube containing summarization ofdata, simple OLAP operations fit the purpose of data characterization.Discrimination: Data discrimination produces what are called discriminant rules and is basicallythe comparison of the general features of objects between two classes referred to as the target classand the contrasting class. For example, one may want to compare the general characteristics of thecustomers who rented more than 30 movies in the last year with those whose rental account is lowerthan 5. The techniques used for data discrimination are very similar to the techniques used for datacharacterization with the exception that data discrimination results include comparative measures.Association analysis: Association analysis is the discovery of what are commonly calledassociation rules. It studies the frequency of items occurring together in transactional databases, andbased on a threshold called support, identifies the frequent item sets. Another threshold, confidence,which is the conditional probability than an item appears in a transaction when another itemappears, is used to pinpoint association rules. Association analysis is commonly used for marketbasket analysis. For example, it could be useful for the OurVideoStore manager to know whatmovies are often rented together or if there is a relationship between renting a certain type of moviesand buying popcorn or pop. The discovered association rules are of the form: P - Q [s,c], where Pand Q are conjunctions of attribute value-pairs, and s (for support) is the probability that P and Qappear together in a transaction and c (for confidence) is the conditional probability that Q appearsin a transaction when P is present. For example, the hypothetic association rule:RentType(X, "game") AND Age(X, "13-19") - Buys(X, "pop") [s 2% ,c 55%]would indicate that 2% of the transactions considered are of customers aged between 13 and 19 whoare renting a game and buying a pop, and that there is a certainty of 55% that teenage customerswho rent a game also buy pop.Classification: Classification analysis is the organization of data in given classes. Also known as
supervised classification, the classification uses given class labels to order the objects in the datacollection. Classification approaches normally use a training set where all objects are alreadyassociated with known class labels. The classification algorithm learns from the training set andbuilds a model. The model is used to classify new objects. For example, after starting a creditpolicy, the OurVideoStore managers could analyze the customers behaviours vis-à-vis their credit,and label accordingly the customers who received credits with three possible labels "safe", "risky"and "very risky". The classification analysis would generate a model that could be used to eitheraccept or reject credit requests in the future.Prediction: Prediction has attracted considerable attention given the potential implications ofsuccessful forecasting in a business context. There are two major types of predictions: one caneither try to predict some unavailable data values or pending trends, or predict a class label for somedata. The latter is tied to classification. Once a classification model is built based on a training set,the class label of an object can be foreseen based on the attribute values of the object and theattribute values of the classes. Prediction is however more often referred to the forecast of missingnumerical values, or increase/ decrease trends in time related data. The major idea is to use a largenumber of past values to consider probable future values.Clustering: Similar to classification, clustering is the organization of data in classes. However,unlike classification, in clustering, class labels are unknown and it is up to the clustering algorithmto discover acceptable classes. Clustering is also called unsupervised classification, because theclassification is not dictated by given class labels. There are many clustering approaches all basedon the principle of maximizing the similarity between objects in a same class (intra-class similarity)and minimizing the similarity between objects of different classes (inter-class similarity).Outlier analysis: Outliers are data elements that cannot be grouped in a given class or cluster. Alsoknown as exceptions or surprises, they are often very important to identify. While outliers can beconsidered noise and discarded in some applications, they can reveal important knowledge in otherdomains, and thus can be very significant and their analysis valuable.Evolution and deviation analysis: Evolution and deviation analysis pertain to the study of timerelated data that changes in time. Evolution analysis models evolutionary trends in data, whichconsent to characterizing, comparing, classifying or clustering of time related data. Deviationanalysis, on the other hand, considers differences between measured values and expected values,and attempts to find the cause of the deviations from the anticipated values.It is common that users do not have a clear idea of the kind of patterns they can discover or need todisc
Data Mining: Concepts and Techniques . Chapter I: Introduction to Data Mining We are in an age often referred to as the information age. In this information age, because we believe that information leads to power and success, and thanks to sophisticated technologies such as computers, satelli