Transcription
QUALITY BASICSRoot Cause AnalysisFor Beginnersby James J. Rooney and Lee N. Vanden HeuvelRoot cause analysis (RCA) is a processdesigned for use in investigating and categorizing the root causes of events with safety, health, environmental, quality, reliability andproduction impacts. The term “event” is used toIn 50 WordsOr Less Root cause analysis helps identify what, howand why something happened, thus preventingrecurrence. Root causes are underlying, are reasonablyidentifiable, can be controlled by managementand allow for generation of recommendations. The process involves data collection, causecharting, root cause identification and recommendation generation and implementation.generically identify occurrences that produce orhave the potential to produce these types of consequences.Simply stated, RCA is a tool designed to helpidentify not only what and how an event occurred,but also why it happened. Only when investigators are able to determine why an event or failureoccurred will they be able to specify workablecorrective measures that prevent future events ofthe type observed.Understanding why an event occurred is thekey to developing effective recommendations.Imagine an occurrence during which an operator is instructed to close valve A; instead, theoperator closes valve B. The typical investigation would probably conclude operator errorwas the cause.This is an accurate description of what happened and how it happened. However, if the analysts stop here, they have not probed deeplyenough to understand the reasons for the mistake.Therefore, they do not know what to do to prevent it from occurring again.In the case of the operator who turned thewrong valve, we are likely to see recommendations such as retrain the operator on the procedure, remind all operators to be alert whenQUALITY PROGRESSI JULY 2004 I 45
QUALITY BASICSmanipulating valves or emphasize to all personnelthat careful attention to the job should be maintained at all times. Such recommendations do littleto prevent future occurrences.Generally, mistakes do not just happen but canbe traced to some well-defined causes. In the caseof the valve error, we might ask, “Was the procedure confusing? Were the valves clearly labeled?Was the operator familiar with this particulartask?”The answers to these and other questions willhelp determine why the error took place andwhat the organization can do to prevent recur-Identifying “severe weather”as the root cause of parts notbeing delivered on time tocustomers is not appropriate.rence. In the case of the valve error, examplerecommendations might include revising theprocedure or performing procedure validation toensure references to valves match the valve labelsfound in the field.Identifying root causes is the key to preventingsimilar recurrences. An added benefit of an effectiveRCA is that, over time, the root causes identifiedacross the population of occurrences can be used totarget major opportunities for improvement.If, for example, a significant number of analysespoint to procurement inadequacies, then resourcescan be focused on improvement of this managementsystem. Trending of root causes allows developmentof systematic improvements and assessment of theimpact of corrective programs.DefinitionAlthough there is substantial debate on the definition of root cause, we use the following:1. Root causes are specific underlying causes.46I JULY 2004 I www.asq.org2. Root causes are those that can reasonably beidentified.3. Root causes are those management has controlto fix.4. Root causes are those for which effective recommendations for preventing recurrences canbe generated.Root causes are underlying causes. The investigator’s goal should be to identify specific underlying causes. The more specific the investigator canbe about why an event occurred, the easier it willbe to arrive at recommendations that will preventrecurrence.Root causes are those that can reasonably beidentified. Occurrence investigations must be costbeneficial. It is not practical to keep valuable manpower occupied indefinitely searching for the rootcauses of occurrences. Structured RCA helps analysts get the most out of the time they have invested in the investigation.Root causes are those over which managementhas control. Analysts should avoid using generalcause classifications such as operator error, equipment failure or external factor. Such causes are notspecific enough to allow management to makeeffective changes. Management needs to knowexactly why a failure occurred before action can betaken to prevent recurrence.We must also identify a root cause that management can influence. Identifying “severe weather”as the root cause of parts not being delivered ontime to customers is not appropriate. Severe weather is not controlled by management.Root causes are those for which effective recommendations can be generated. Recommendationsshould directly address the root causes identifiedduring the investigation. If the analysts arrive atvague recommendations such as, “Improve adherence to written policies and procedures,” thenthey probably have not found a basic and specificenough cause and need to expend more effort in theanalysis process.Four Major StepsThe RCA is a four-step process involving the following:1. Data collection.2. Causal factor charting.
Causal Factor ChartFIGURE 1BurnerPart oneElectricburnershorts outCFPanArcing heatsbottom ofaluminumpanHad itnot beenoriginally charged?FireextinguisherPanJaneHad itleaked?Aluminummelts,forminghole in panFire extinguisher,floorJane comesto the doorConclusionJane, MaryHowmuch oil isused? Howmuch chicken?Chicken,pan, oil MaryMarybeginsfryingchicken5:00 pmPanMaryuses analuminumpanGrease igniteswhen itcontactsburnerWhatexactlydid she see?Had itbeenpreviously used?MaryInspection tagAssumedFiregeneratessmokeJane ringsthe doorbellMaryMaryMary seesthe fireon the stoveFire extinguisheris notchargedMaryMaryMary leavesthe fryingchickenunattendedCFFire startson thestoveMaryMary meetswith JaneJane, MarySmokedetectoralarmsMaryMary runsinto thekitchenMaryMaryMary triesto usethe fireextinguisherAbout 5:10 pmFire extinguisherdoes notoperate whenMary tries to use itCFMary10 minutesMary pullsthe plugon the fireextinguisherIs "plug"the sameas pin?Does Maryknow howto use a fireextinguisher?MaryMaryCF Causal factorFigure 1 continued on next pageQUALITY PROGRESSI JULY 2004 I 47
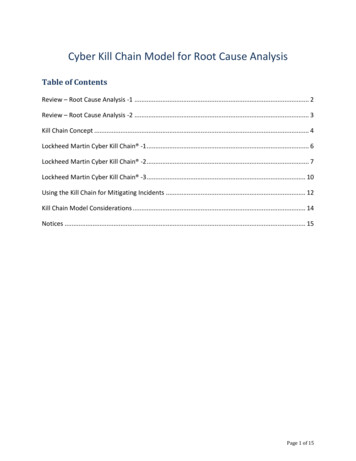
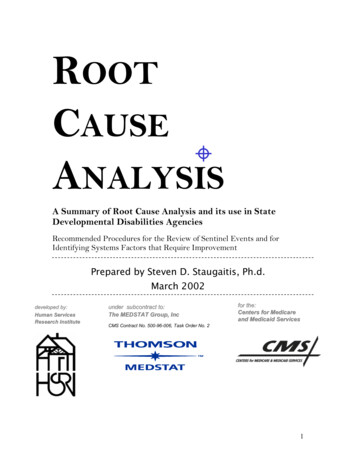
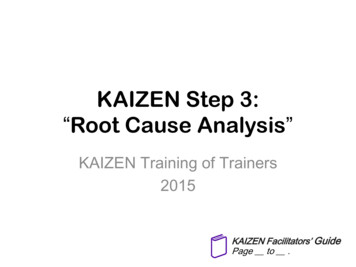
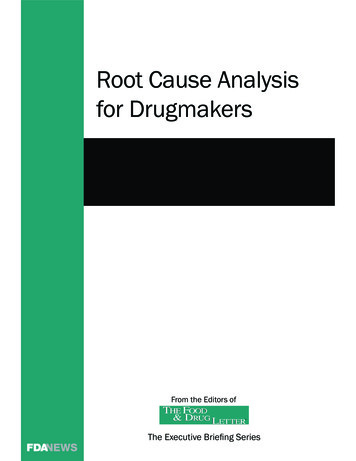
QUALITY BASICSPart twoDid she knowthis was wrong?Lack of practicefighting fires?Did she doanything else?What isJane doing duringthis time?Mary, JaneMaryMary, panMaryWas Marytrying to do this?How longdid it take for theFD to arrive?Fire was agrease fireFDdispatcherMaryMaryMary throwswater onthe fireMary, FDKitchen, MaryFire spreadsthroughoutthe kitchenCFMary calls thefire departmentTime?3. Root cause identification.4. Recommendation generation and implementation.Step one—data collection. The first step in theanalysis is to gather data. Without complete information and an understanding of the event, thecausal factors and root causes associated with theevent cannot be identified. The majority of timespent analyzing an event is spent in gatheringdata.Step two—Causal factor charting. Causal factorcharting provides a structure for investigators to organize and analyze the information gathered duringthe investigation and identify gaps and deficienciesin knowledge as the investigation progresses. Thecausal factor chart is simply a sequence diagramwith logic tests that describes the events leading upto an occurrence, plus the conditions surroundingthese events (see Figure 1, p. 47).Preparation of the causal factor chart shouldbegin as soon as investigators start to collect information about the occurrence. They begin with askeleton chart that is modified as more relevantfacts are uncovered. The causal factor chart should48I JULY 2004 I www.asq.orgDid the FDuse the correcttechniques?FDObservationFD, observationFire departmentarrivesFire departmentputs out fireTime?Time?Kitchendestroyedby fireOther lossesfrom smoke andwater damage?drive the data collection process by identifyingdata needs.Data collection continues until the investigatorsare satisfied with the thoroughness of the chart(and hence are satisfied with the thoroughness ofthe investigation). When the entire occurrence hasbeen charted out, the investigators are in a goodposition to identify the major contributors to theincident, called causal factors. Causal factors arethose contributors (human errors and componentfailures) that, if eliminated, would have either prevented the occurrence or reduced its severity.In many traditional analyses, the most visiblecausal factor is given all the attention. Rarely, however, is there just one causal factor; events are usually the result of a combination of contributors.When only one obvious causal factor is addressed,the list of recommendations will likely not be complete. Consequently, the occurrence may repeatitself because the organization did not learn all thatit could from the event.Step three—root cause identification. After allthe causal factors have been identified, the investigators begin root cause identification. This step
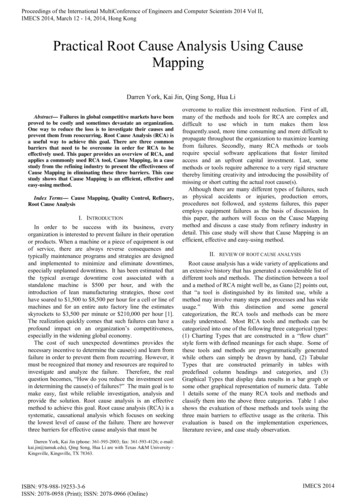
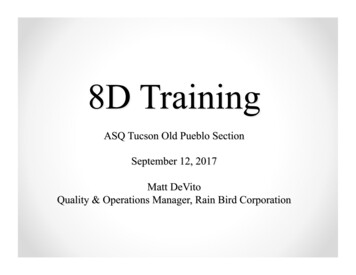
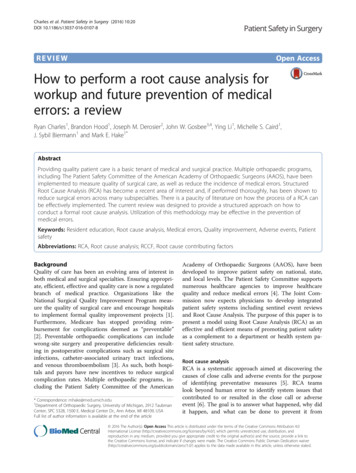
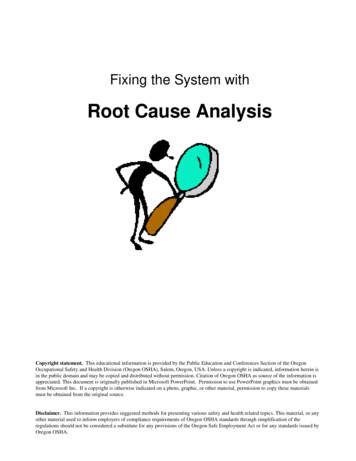
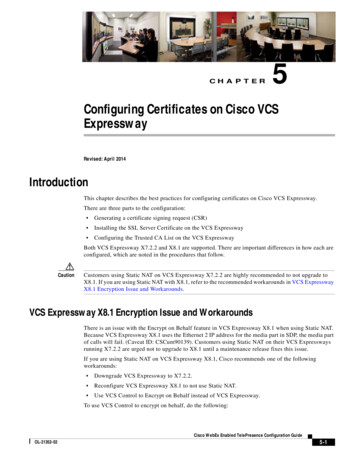
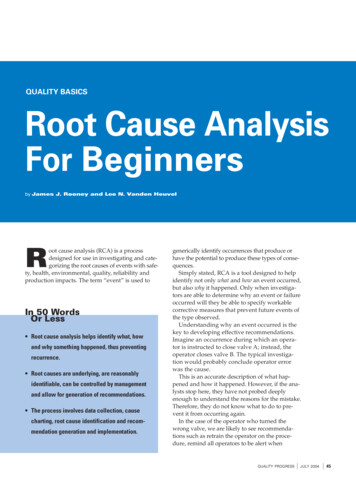
involves the use of a decision diagram called theRoot Cause Map (see Figure 2, p. 50) to identify theunderlying reason or reasons for each causal factor.The map structures the reasoning process of theinvestigators by helping them answer questionsabout why particular causal factors exist oroccurred. The identification of root causes helpsthe investigator determine the reasons the eventoccurred so the problems surrounding the occurrence can be addressed.Step four—recommendation generation andimplementation. The next step is the generation ofrecommendations. Following identification of theroot causes for a particular causal factor, achievablerecommendations for preventing its recurrence arethen generated.The root cause analyst is often not responsiblefor the implementation of recommendations generated by the analysis. However, if the recommendations are not implemented, the effort expended inperforming the analysis is wasted. In addition, theevents that triggered the analysis should be expected to recur. Organizations need to ensure that recommendations are tracked to completion.Presentation of ResultsRoot cause summary tables (see Table 1, p. 52)can organize the information compiled during dataanalysis, root cause identification and recommendation generation. Each column represents a majoraspect of the RCA process. In the first column, a general description of thecausal factor is presented along with sufficientbackground information for the reader to beable to understand the need to address thiscausal factor. The second column shows the Path or Pathsthrough the Root Cause Map associated withthe causal factor. The third column presents recommendationsto address each of the root causes identified.Use of this three-column format aids the investigator in ensuring root causes and recommendations are developed for each causal factor.The end result of an RCA investigation is generally an investigation report. The format of thereport is usually well defined by the administrativedocuments governing the particular reporting sys-tem, but the completed causal factor chart andcausal factor summary tables provide most of theinformation required by most reporting systems.Example ProblemThe following example is nontechnical, allowingthe reader to focus on the analysis process and notthe technical aspects of the situation. The followingnarrative is the account of the event according toMary:It was 5 p.m. I was frying chicken. My friendJane stopped by on her way home from the doctor, and she was very upset. I invited her intothe living room so we could talk. After about 10minutes, the smoke detector near the kitchencame on. I ran into the kitchen and found a fireon the stove. I reached for the fire extinguisherand pulled the plug. Nothing happened. Thefire extinguisher was not charged. In desperation, I threw water on the fire. The fire spreadthroughout the kitchen. I called the fire department, but the kitchen was destroyed. The firedepartment arrived in time to save the rest ofthe house.Data gathering began as soon as possible afterthe event to prevent loss or alteration of the data.The RCA team toured the area as soon as the fireIn many traditional analyses,the most visible causal factoris given all the attention.department declared it safe. Because data frompeople are the most fragile, Mary, Jane and the firefighters were interviewed immediately after thefire. Photographs were taken to record physicaland position data.The analysts then developed the causal factorchart (see Figure 1, p. 47) to clearly define thesequence of events that led to the fire. The causalfactor chart begins with the event; Mary begins frying chicken at 5 p.m. As the chart develops fromQUALITY PROGRESSI JULY 2004 I 49
QUALITY BASICSFIGURE 2Root Cause MapStart here with each causal factor.Section one11Equipment difficultyEquipmentdesign problem2Equipmentreliability isuse782Design input/output15Design inputLTA 16Design outputLTA 17EquipmentrecordsEquipment reliabilityprogram designless than adequate (LTA) 2118Equipmentdesign recordsLTA 19Equipmentoperating/maintenancehistory LTA 20No program 22Program LTA 23 Analysis/designprocedure LTA 24 Inappropriate typeof maintenanceassigned 25 Risk acceptancecriteria LTA 26 Allocation ofresources LTA 27Note: Node numbers correspond to matching page in Appendix A of theRoot Cause Analysis Handbook.Standards,policies oradministrativecontrols (SPACs)LTA 57 No SPACs 59 Not strictenough 60 Confusing,contradictory orincomplete 61 Technical error 62 Responsibilityfor item/activitynot adequatelydefined 63 Planning, schedulingor tracking of workactivities LTA 64 Rewards/incentivesLTA 65 Employee screening/hiring LTA 66Safety/hazard/risk review 72 Review LTA ornot performed 74 Recommendations notyet implemented 75 Risk acceptancecriteria LTA 76 Review procedureLTA 77SPACs not used 67 Communication ofSPACs LTA 69 Recently changed Enforcement LTA7071Equipment reliabilityprogram implementationLTA28Corrective maintenanceLTA 29 Troubleshooting/correctiveaction LTA 30 Repair implementationLTA 31Preventive maintenanceLTA 32 Frequency LTA 33 Scope LTA 34 Activity implementationLTA 35Predictive maintenanceLTA 36 Detection LTA 37 Monitoring LTA 38 Troubleshooting/corrective action LTA 39 Activity implementationLTA 40Product/materialcontrol 85 Handling LTA 87 Storage LTA 88 Packaging/shipping LTA 89 Unauthorized materialsubstitution 90 Product acceptancecriteria LTA 91 Product inspectionsLTA 92Not used 112 Not available orinconvenient toobtain 113 Procedure difficultto use 114 Use not requiredbut should be 115 No procedure fortask 11650I JULY 2004 I www.asq.orgProcedures111Proactive maintenanceLTA 41 Event specificationLTA 42 Monitoring LTA 43 Scope LTA 44 Activity implementationLTA 45Failure finding maintenanceLTA 46 Frequency LTA 47 Scope LTA 48 Troubleshooting/corrective action LTA 49 Repair implementation 50Routine equipmentrounds LTA 51 Frequency LTA 52 Scope LTA 53 Activity implementationLTA 54Procurementcontrol 93 Purchasingspecifications LTA 95 Control of changesto procurementspecifications LTA 96 Material acceptancerequirements LTA 97 Material inspectionsLTA 98 Contractor selectionLTA 99Problemidentificationcontrol 78 Problem reportingLTA 80 Problem analysisLTA 81 Audits LTA 82 Corrective actionLTA 83 Corrective actions notyet implemented 84Administrative/managementsystems 55Document andconfigurationcontrol 100 Change notidentified 102 Verification of design/field changes LTA(no PSSR*) 103 Documentationcontent not keptup to date 104 Control of officialdocuments LTA 105Misleading/confusing 117 Format confusing orLTA 118 More than one actionper step 120 No checkoff spaceprovided but should be 121 Inadequate checklist 122 Graphics LTA 123 Ambiguous or confusinginstructions/requirements 124 Data/computationswrong/incomplete 125 Insufficient or excessivereferences 126 Identification of revisedsteps LTA 127 Level of detail LTA 128 Difficult to identify 129Customerinterface/services 106 Customerrequirementsnot identified 108 Customer needsnot addressed 109 ImplementationLTA 110Wrong/incomplete 130 Typographical error 131 Sequence wrong 132 Facts wrong/requirements notcorrect 133 Wrong revision orexpired procedurerevision used 134 Inconsistencybetweenrequirements 135 Incomplete/situationnot covered 136 Overlap or gapsbetweenprocedures 137Figure 2 continued on next page
Start here with each causal factor.Section Two11Personal difficultyCompanyemployee9Other tage/horseplay1112ExternaleventsOther13142Human factorsengineering138No training 164 Decision notto train 165 Trainingrequirements notidentified 166ImmediatesupervisionTraining163Training recordssystem LTA 167 Training recordsincorrect 168 Training recordsnot up to date 169No communication ornot timely 194 Method unavailable orLTA 195 Communication betweenwork groups LTA 196 Communication betweenshifts and managementLTA 197 Communication withcontractors LTA 198 Communication withcustomers LTA 199180Training LTA 170 Job/task analysisLTA 171 Program design/objectives LTA 172 Lesson contentLTA 174 On-the-jobtraining LTA 175 Qualificationtesting LTA 176 Continuingtraining LTA 177 Trainingresources LTA 178 Abnormal events/emergencytraining LTA 179Misunderstoodcommunication 200 Standardterminology notused 201 Verification/repeat back notused 202 Long message rformance208Preparation 181 No preparation 182 Job plan LTA 183 Instructions to workersLTA 184 Walkthrough LTA 185 Scheduling LTA 186 Worker selection/assignment LTA 187Supervision duringwork 188 Supervision LTA 189 Improper performancenot corrected 190 Teamwork LTA 191Problemdetection LTA 209*Sensory/perceptualcapabilities LTA 210*Reasoningcapabilities LTA 211*Motor/physicalcapabilities LTA 212*Attitude/attentionLTA 213*Rest/sleep LTA(fatigue) 214*Personal/medicationproblems 215Job turnover LTA 205 Communicationwithin shifts LTA 206 Communicationbetween shiftsLTA 207*PSSR Project scope summary reportShapeDescriptionPrimary difficulty sourceProblem categoryWorkplace layout 140 Controls/displaysLTA 141 Control/displayintegration/arrangement LTA 143 Location ofcontrols/displaysLTA 144 Conflicting layouts 145 Equipmentlocation LTA 146 Labeling ofequipment orlocations LTA 147Work environment 148 Housekeeping LTA 149 Tools LTA 150 Protective clothing/equipment LTA 151 Ambientconditions LTA 152 Other environmentalstresses excessive 154Workload 155 Excessive controlactionrequirements 156 Unrealisticmonitoringrequirements 157 Knowledge baseddecisionrequired 158 Excessivecalculation ordata manipulationrequired 159Intolerantsystem 160 Errors notdetectable 161 Errors notcorrectable 162Root cause categoryNear root causeRoot cause 1995, 1997, 1999, 2000 and 2001, ABSG Consulting Inc.*Note: These nodes are for descriptivepurposes only.QUALITY PROGRESSI JULY 2004 I 51
QUALITY BASICSTABLE 1Root Cause Summary TableEvent description: Kitchen is destroyed by fire and damaged by smoke and water.Causal factor # 1Description:Mary leaves the frying chicken unattended.Paths Through Root Cause Map Personnel difficulty. Administrative/management systems. Standards, policies or administrativecontrols (SPACs) less than adequate (LTA). No SPACs.Causal factor # 2Description:Electric burner element fails (shorts out).Paths Through Root Cause Map Causal factor # 3Description:Fire extinguisher does not operate whenMary tries to use it.Paths Through Root Cause MapPaths Through Root Cause Map is a trademark of ABSG Consulting.52I JULY 2004 I www.asq.orgRecommendations Implement a policy that hot oil is never leftunattended on the stove. Determine whether policies should bedeveloped for other types of hazards in thefacility to ensure they are not left unattended. Modify the risk assessment process orprocedure development process to addressrequirements for personnel attendanceduring process operations.Recommendations Replace all burners on stove. Develop a preventive maintenance strategyto periodically replace the burner elements. Consider alternative methods for preparingchicken that may involve fewer hazards,such as baking the chicken or purchasingthe finished product from a supplier.Recommendations Equipment difficulty.Equipment reliability program problem.Equipment proactive maintenance LTA.Activity implementation LTA. Refill the fire extinguisher. Inspect other fire extinguishers in thefacility to ensure they are full. Have incident reports describing the use offire protection equipment routed tomaintenance to trigger refilling of the fireextinguishers. Equipment difficulty.Equipment reliability program problem.Administrative/management systems.Problem identification and control LTA. Add this fire extinguisher to the audit list. Verify that all fire extinguishers are on thequarterly fire extinguisher audit list. Have all maintenance work requests thatinvolve fire protection equipment routed tothe safety engineer so the quarterlychecklists can be modified as required.Causal factor # 4Description:Mary throws water on fire.Equipment difficulty.Equipment reliability program problem.Equipment reliability program design LTA.No program.Event #: 2003-1Paths Through Root Cause Map Personnel difficulty.Company employee.Training.Training LTA.Abnormal events/emergency training LTA.Recommendations Provide practical (hands-on) trainingon the use of fire extinguishers. Classroomtraining may be insufficient to adequatelylearn this skill. Review other skill based activities toensure appropriate level of hands-on trainingis provided. Review the training development processto ensure adequate guidance is provided fordetermining the proper training setting (forexample,classroom, lab, simulator, on the jobtraining, computer based training).
left to right, the sequences begin to unfold. The lossevents—kitchen destroyed by fire and other lossesfrom smoke and water damage—are the shadedrectangles in the causal factor chart.Although we read the chart from left to right, itis developed from right to left (backwards).Development always starts at the end because thatis always a known fact. Logic and time tests areused to build the chart back to the beginning ofthe event. Numerous questions are usually generated that identify additional necessary data.After the causal factor chart was complete (additional data were gathered to answer the questionsshown in Figure 1), the analysts identified the factors that influenced the course of events. There arefour causal factors for this event (see Table 1).Elimination of these causal factors would haveeither prevented the occurrence or reduced its severity. Note the recommendations in Table 1 are writtenas if Mary’s house were an industrial facility.Notice that causal factor two may be unexpected. It wasn’t overheating of the oil or splattering ofthe oil that ignited the fire. If the wrong causal factor is identified, the wrong corrective actions willbe developed.The application of the technique identified thatthe electric burner element failed by shorting out.The short melted Mary’s aluminum pan, releasingthe oil onto the hot burner, starting the fire.The analyst must be willing to probe the datafirst to determine what happened during the occurrence, second to describe how it happened, andthird to understand why.Root Cause Analysis Handbook, WSRC-IM-91-3, Department ofEnergy, 1991 (and earlier versions).Root Cause Analysis Handbook: A Guide to EffectiveInvestigation, ABSG Consulting Inc., 1999.User’s Guide for Reactor Incident Root Cause Coding Tree, revision five, DPST-87-209, E.I. duPont de Nemours, Savannah River Laboratory, 1986.JAMES J. ROONEY is a senior risk and reliability engineerwith ABSG Consulting Inc.’s Risk Consulting Division inKnoxville, TN. He earned a master’s degree in nuclear engineering from the University of Tennessee. Rooney is a Fellowof ASQ and an ASQ certified quality auditor, quality auditor-hazard analysis and critical control points, quality engineer, quality improvement associate, quality manager andreliability engineer.LEE N. VANDEN HEUVEL is a senior risk and reliabilityengineer with ABSG Consulting Inc.’s Risk ConsultingDivision in Knoxville, TN. He earned a master’s degree innuclear engineering from the University of Wisconsin.Vanden Heuvel co-authored the Root Cause AnalysisHandbook: A Guide to Effective Incident Investigation, co-developed the RootCause Leader software and wasa co-author of the Center for Chemical Process Safety’sGuidelines for Investigating Chemical ProcessIncidents. He develops and teaches courses on the subject.BIBLIOGRAPHYAccident/Incident Investigation Manual, second edition,DOE/SSDC 76-45/27, Department of Energy.Events and Causal Factors Charting, DOE/SSDC 76-45/14,Department of Energy, 1985.Ferry, Ted S., Modern Accident Investigation and Analysis, second edition, John Wiley and Sons, 1988.Guidelines for Investigating Chemical Process Incidents,American Institute of Chemical Engineers, Center forChemical Process Safety, 1992.Occupational Safety and Health Administration AccidentInvestigation Course, Office of Training and Education, 1993.PleasecommentIf you would like to comment on this article,please post your remarks on the Quality ProgressDiscussion Board at www.asq.org, or e-mail themto editor@asq.org.QUALITY PROGRESSI JULY 2004 I 53
QUALITY BASICS In 50 Words Or Less Root cause analysis helps identify what, how and why something happened, thus preventing recurrence. Root causes are underlying, are reasonably identifiable, can be controlled by management and allow for generation of recom