Transcription
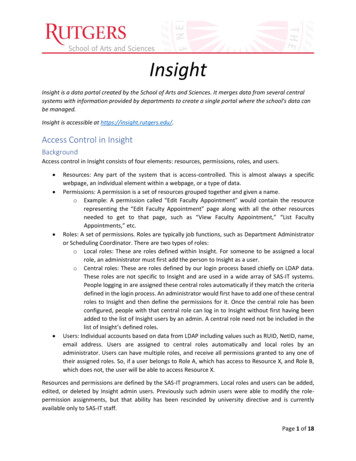
The Future of EnergyRichard WolfsonBenjamin F. Wissler Professor of PhysicsProfessor, Environmental StudiesMiddlebury CollegeInsight Cruises/Scientific AmericanJanuary 20, 2012
How Much Energy Do We Use?!!!!More appropriate question:"! At what rate do we use energy?"! That rate is called power"! Energy is “stuff,” power is the rate at which it’s usedor generatedAlternate version of question:"! At what rate do you, as a resident of twenty-firstcentury industrialized society, use energy?"! How’s that compare with the rate at which your ownbody uses energy?
Your Body’s Power: 100 wattsCreditsLeft: Tad Merrick Photography, from Energy, Environment, and ClimateRight: ends.htm
Your Energy Use!!!!Your own body"! Produces energy at the rate of 100 wattsYou (average U.S. citizen)"! Use energy at the rate of about 10,000 watts"! 10 kilowatts (kW)"! 100 “energy servants”
Your Energy UseYou!Some of your energy uses!Your “energy servants”!
Energy and Power!! Energy:"!the amount of “stuff”kilowatt-hours, joules, calories, ergs, electron volts,British thermal units, barrels of oil equivalent, !! Power:the rate at which it’s used, generated,lost, transferred, converted "!watts, kilowatts, megawatts, gigawatts, terawatts,joules/second, boe/year, btu/hour, !! What’swrong with “this power plant willproduce 500 megawatts every hour ”?
It hasn’t always been like this 02000Energy ServantsKilowatts per capita14
Some Small Energy Numbers!!!!!!!!!!!!!!!!!!Desk lamp: 60 WLaptop computer: 60 WTV: 250 WStove burner: 1,500 WClothes dryer: 5,000 WHome heat/cool:10,000 - 40,000 WPrius hybrid, 60 mph:50,000 WHummer H2, 60 mph:200,000 Wms Eurodam: 56 MW 56 million watts!!!!!!!!!!!!!!Solar energy on 1 squaremeter, noon Sun: 1000 WGuayama solar farm, PR:24 MW peakSanta Isabel wind farm, PR:101 MW peakTurkey Point Nuclear Plant,FL: 1.4 GW 1.4 billion wattsHoover dam, AZ/NV: 2 GWChurchill Falls, Canada:5.4 GW3 Gorges Dam, China:23 GW
Some Big Energy Numbers!!!!!!!!US oil consumption:1.5 trillion W (1.5 TW)(21 million barrels/day;8 billion barrels/year)!!US oil imports: 2/3 of consumption!!U.S. energy consumption:3.4 trillion W (3.4 TW)World energyconsumption:16 trillion W (16 TW)!!!!Oil reserves, ANWR:6-16 billion barrelsOil reserves, offshore US:20 billion barrelsWorld oil reserves:1 trillion barrelsSolar energy falling onentire Earth:174 quadrillion W(174,000 TW;2.5 trillion barrels of oilequivalent per day)
Energy: What Do We Do With It?United sportation45%End use energy from : International Energy Agency: http://www.iea.org/stats/index.asp
Energy: What Do We Do With ansportation28%End use energy from : International Energy Agency: http://www.iea.org/stats/index.asp
Energy: What Do We Do With Residential67%End use energy from : International Energy Agency: http://www.iea.org/stats/index.asp
Energy: Where’s it Come From?United States:Hydro Biomass Other1%4%Nuclear 3%9%Coal21%Gas25%U.S. Energy end uses; Source: EIA/DOE Annual Energy Review 2009 Table 1.3!Oil37%
Energy: Where’s it Come From?World:HydroNuclear 6%6%Other1%Coal27%Gas23%Oil37%Source: EIA International Energy Annual 2010 Table 1.8 (2006 data)!
US Energy Sources: Not Much thermal36%Other1%Coal21%Oil37%U.S. Energy end uses; Source: Source: EIA/DOE Annual Energy Review 2009 Table 1.3!Solar11%Wind53%
Energy Sources: Mostly Fossil FuelsUnited States: 83%World: 87%All others13%Fossil fuels87%
Why Wean Ourselves from Fossil Fuels?1)! We’re running out:EE&C Fig 5.24
Why Wean Ourselves from Fossil Fuels?2)! We’re wrecking our planet:!!!!Oil spillsMining"! Strip/mountaintop"! Acid minedrainage"! Black lungdisease!!New York, 1950sAir pollution"! Smog"! Acid rain"! Particulates"! Coal ash slurry"! Mercury"! 24,000 USdeaths/yearfrom fossil-fueledpower plants
Our Energy Future:The First StepYou!Some of your energy uses!Your “energy servants”!
Earth’s Energy Endowment
Doing the NumbersSolar flow: 174,000 TWGeothermal flow: 40 TWTidal flow: 3 TWHuman energyconsumption rate: 16 TWFossil reserves: 1200 TW-yearNuclear fission reserves: 50-7000 TW-yearNuclear fusion reserves:500 billion TW-year
Tidal EnergyRate: 3 TW global; Humanity: 16 TWOld way:La Rance River estuary,France240 MWNew way:Verdant Energy’s RooseveltIsland Tidal Energy project,East River, NY1 MW
Geothermal EnergyRate: 40 TW global; Humanity: 16 TWOld: Geysers, California17 units; 1.4 GW totalFuture? Basel,SwitzerlandDeep Heat MiningProjectNew: Mammoth Lakes, California40-MW closed-cycle binary plant
Nuclear FissionReserves: 50-7000 TW-year; Humanity: 16 TW-year/yearShin-Kori, Korea6.8 GW, 2010-13Indian Point, NY2 GW, 1974-76Fukushima Daiichi, Japan4.7 GW, 1970-79Superphénix breeder,France: 1.2 GW, 1984
Nuclear Fission: Safer Reactors?Reserves: 50-7000 TW-year; Humanity: 16 TW-year/yearWestinghouseAP1000!!Generation III Passive safety systems"! Standardized construction"! Under construction in Asia; licensed in US"!!!Generation IVRadically new designs; faster, hotter"! “Burn” long-lived nuclear waste"! Still decades away"!Sodium FastReactor
Nuclear Fission: A Renaissance?Reserves: 50-7000 TW-year; Humanity: 16 TW-year/yearNuclear power reactors, worldwideTotal capacity: 0.38 TW, 14% of world electrical onstruction26U.S. licenseapplications
Nuclear Fission: A Renaissance?Reserves: 50-7000 TW-year; Humanity: 16 TW-year/year70015660151460050010400370TodayIAEA 2030projection30052001000Nuclear capacity, GWData source: World Nuclear Association0% Nuclear electricity
Digression:Nuclear Energy after Fukushima
What Went Wrong at Fukushima!!!!!!!!!!!!Dose rate, 1 m heightApril 29, 2011Normal: 0.5 µSv/hourKerala, India: 6 mSv/hourEarthquake:reactor damage?Tsunami:Damaged backupcoolingHydrogen buildup:explosionsFuel meltdownsDamage to spent fuel poolsRadiation releases
Fukushima-Inspired Thoughts!! 1.5% of the world’s commercial power reactorshave now melted down"!Comparable to Space Shuttle accident rate!! WasFukushima the worst credible accident?3-4 reactors; 40% of Chernobyl radiation"! Safety of light water reactors?#! Vindicated? Unacceptable risks?"! Implications for multiple-reactor power stations?"!!! IsFukushima over?“Cold shutdown” 16 December 2011"! 40-year cleanup"! Long-term land contamination?"!
Nuclear FusionReserves: 500 billion TW-year; Humanity: 16 TW-year/yearMagnetic confinementITER Experimentalfusion reactor:50 MW in, 500 MW out2019 (?)Inertial confinementNational Ignition Facility,LLNL: 2010Scientific breakeven (?)
Direct Solar EnergyRate: 174,000 TW global*; Humanity: 16 TW* 100,000Passive heatingTW at surfaceActive hot-water heating
Direct Solar EnergyRate: 174,000 TW global*; Humanity: 16 TW* 100,000Concentrated solar-thermal,2-axis tracking (90 MW, CA)TW at surfaceSuncatcher concentratedsolar-thermal, 3-axis tracking,(25 kW each, 1.5 MW total,Arizona); 1.5 GW plannedConcentrated solar-thermal,power towers(30 MW, Spain)
Direct Solar EnergyRate: 174,000 TW global*; Humanity: 16 TWPhotovoltaic power* 100,000TW at surfaceMaine: 4 kW, 1996Germany: 53 MW, 2009China: 200 MW, 2011Spain: 60 MW, 2008Ontario: 97 MW, 2010Nevada: 14 MW, 2007
Indirect Solar Energy: HydropowerRate: 200 TW global; Humanity: 16 TWHoover DamColorado RiverAZ/NV1935; 2.1 GWBelden’s Falls, VT1913; 1.6 MW1988: 4.1 MW3 Gorges, China2003-2010; 23 GWJohn Jay DamColumbia River, WA1971; 2.2 GW
Indirect Solar Energy: WindRate: 200 TW global; Humanity: 16 TWCarleton College2004; 1.65 MWOffshore windfarm, Denmark2009; 209 MWEnerconE-12620087 MWAlta, CA 720 MW in 2011;ultimately 1.4 GWGansu wind farmChina: 2020; 20 GW
Indirect Solar Energy: OceansRate: 10 TW global; Humanity: 16 TWWave power,Portugal 2008; 3!750 kWOcean ThermalEnergy Conversion(OTEC) conceptOcean currentturbines concept
Indirect Solar Energy: BiomassRate: 133 TW global; Humanity: 16 TWMcNeil generatingstation, VT1954; 54 MWMiddlebury Collegebiomass boiler2009; 5 MW thermalBiodieselCorn ethanolAlgae
Hydrogen!0Reserves:Humanity: 16 TW-year/yearElectricity!0Reserves:Humanity: 16 TW-year/year
Energy & EnvironmentNo energy source is environmentally benign!!!!!!!Wind"! Aesthetics"! Noise"! Bird & bat killsSolar"! Toxic substances"! Climate-change potential(albedo)Geothermal"! Air & water pollution"! Land subsidence"! Damage to scenic areas"! Earthquakes!!!!!!Biomass"! Air pollution"! Toxins (dioxin, etc)Hydro"! Land inundation"! Population displacement"! Greenhouse gas emissionsNuclear"! Radioactive waste"! Catastrophic accidents"! Terrorism"! Lung cancer in miners
No energy source is greenhouse-emission freeWolfson, Energy Environment and Climate 2e Fig. 16.4
Future of Energy: Near Term!!Fossil fuels continue"! Gas substitutes forcoal"! Coal with CCSHigher CAFEstandards"! Carbon tax (?)"!
Future of Energy: Near Term!!Growth in renewables"! Wind 32%/year#! 200 GW#! 16 TW in 14 years!"!!!Solar#! 40 GWWorld installed PVcapacityBut a long way to go World installedwind power capacity
Future of Energy: Near Term!!Nuclear fission"! New reactors, especiallyAsia and E. Europe"! Gradual advances in LWRs"! Little or no increase innuclear contribution toworld energy supplyWestinghouseAP1000
Future of Energy: Near Term!!Energy infrastructure"! Smart grids#! Load control#! Net metering#! Instantaneous pricing#! Lower losses"! Feed-in tariffs"! More CHP/cogeneration"! Distributed generation
Future of Energy: Long Term!!Dominated by direct solar and/or fusion"! Hydrogen or synfuels for vehiclesHydrolysis or photolysis of water#! Bioengineering for fuel production"! Increased electrical energy use#! Superconducting power transmission#!!!More limited roles forIndirect solar (wind, currents, waves)"! Advanced fission, breeders,fission/fusion hybrids"!
Future of Energy: Long TermSolar flow: 174,000 TWHuman consumption: 16 TW
Bonus MaterialEnergy & Prosperity
Energy IntensityEnergy intensity [W/( /year)]How much energy does it take to make 1 of : Wolfson, Energy, Environment, and Climate, Fig. 2-8!19802000
Energy & Prosperity 35 30 25Per capitaGDP, k 20 15 10 5 00246810Per capita energy consumption, kWSource: International Energy Agency, Key World Energy Statistics, Section 8: Selected Energy Indicators for 2002!12
Energy & Prosperity 35US! 30 25Per capitaGDP, k 20 15 10 5 00246810Per capita energy consumption, kWSource: International Energy Agency, Key World Energy Statistics, Section 8: Selected Energy Indicators for 2002!12
Energy & Prosperity 35US! 30 25Per capitaGDP, k Australia! 20South Korea! 15 10Poland! 5Congo! 00Egypt!246810Per capita energy consumption, kWSource: International Energy Agency, Key World Energy Statistics, Section 8: Selected Energy Indicators for 2002!12
Energy & Prosperity 35US! 30 25Per capitaGDP, k Australia! 20South Korea! 15 10Saudi Arabia!Poland! 5Congo! 00Russia!Egypt!246810Per capita energy consumption, kWSource: International Energy Agency, Key World Energy Statistics, Section 8: Selected Energy Indicators for 2002!12
Energy & Prosperity 35US! 30Switzerland! 25Per capitaGDP, k Japan!Australia! 20South Korea! 15 10Saudi Arabia!Poland! 5Congo! 00Russia!Egypt!246810Per capita energy consumption, kWSource: International Energy Agency, Key World Energy Statistics, Section 8: Selected Energy Indicators for 2002!12
Energy and Prosperity?40Per-capita GDP (k )353025201510500246810Energy consumption rate (kW)Source: International Energy Agency, Key World Energy Statistics, Section 8: Selected Energy Indicators for 2002!12
Energy and Prosperity?Human development index10.90.80.70.60.50.40.302468Energy consumption rate (kW)Source: IEA as in previous slide; HDI from UN Human Development Report 2005, Table 11012
Home heat/cool: 10,000 - 40,000 W !! Prius hybrid, 60 mph: 50,000 W !! Hummer H2, 60 mph: . Algae Biodiesel Middlebury College biomass boiler 2009; 5 MW thermal . Hydrogen! Reserves: 0 . How much energy does it take to make 1 of GDP? 0 0.2 0.4 0.6 0.8 1 1.2 1.4 1900 1920 1940 1960 1980 2000 Year