Transcription
educationsciencesArticleThe Mystery Method Reconsidered—A Tool forAssessing Systems Thinking in Education forSustainable DevelopmentJens Christian Benninghaus 1, * , Andreas Mühling 2 , Kerstin Kremer 3 andSandra Sprenger 1123*Geography Education, Department of Social Sciences, Mathematics and Natural Sciences Education,Faculty of Education, Universität Hamburg, 20146 Hamburg, Germany; sandra.sprenger@uni-hamburg.deComputer Science Education, Faculty of Engineering, Christian-Albrechts-Universität zu Kiel, 24118 Kiel,Germany; tute for Science Education, Leibniz Universität Hannover, 30167 Hannover, Germany;kremer@idn.uni-hannover.deCorrespondence: jens.christian.benninghaus@uni-hamburg.de; Tel.: 49-40-42838-4743Received: 31 July 2019; Accepted: 18 October 2019; Published: 23 October 2019 Abstract: Influence diagrams, derived from the mystery method as its learning output, representan externalization of systems thinking and are, therefore, valid to research; so far they have not beenconceptualized in the research literature for teaching systems thinking in education for sustainabledevelopment. In this study, 31 of those diagrams are confronted with (1) three different expertreferences, in (2) two different ways, by (3) three different scoring systems to determine whichevaluation option is both valid and easy to implement. As a benchmark, the diagrams’ diametersare used, which allows statements about the quality of the maps/diagrams in general. The resultsshow that, depending on the combination of variables that play a role in the evaluation (1, 2, 3),the quality of the influence diagram becomes measurable. However, strong differences appear inthe various evaluation schemes, which can be explained by each variable’s peculiarities. Overall,the tested methodology is effective, but will need to be sharpened in the future. The results also offerstarting points for future research to further deepen the path taken here.Keywords: education for sustainable development; systems thinking; data mining; mapping1. IntroductionThe complexity of today’s major problems concerning sustainability requires a networked perspectiveon knowledge [1]. School teaching plays an important role in facilitating students’ development of thisperspective. To create learning environments that convey complexity and networking, teachers requirean assessment that enables them to provide targeted support. In this article, the application of such anassessment tool, which is an expertise-based reference to the mystery method, or mystery for short [2,3],in a complex sustainability context [4], is presented. The reference will be used as a basis to evaluatelearners’ influence diagrams qualitatively. In this way, systems thinking, one of the central competenceswithin Education for Sustainable Development (ESD), is assessed [5–7].Many approaches to developing a system-related competence exist, including, among others,networked thinking [8], geographical system competence [9], and systems thinking [6,10], eachwith a conceptual overlap. In principle, such a competence is understood as the ability to describe,reconstruct, and model a complex realm of reality as a system and, on the basis of the model, provideexplanations, make forecasts, and design, assess, and implement possible courses of action [11].As noted previously, this is a central competence within ESD, along with socio-scientific reasoning andEduc. Sci. 2019, 9, 260; cation
Educ. Sci. 2019, 9, 2602 of 15decision-making [12] and Gestaltungskompetenz [13] ( approx. ‘taking action’). The three competencesare interrelated [5] because one first has to gain systems thinking, which serves as a prerequisite fordecision-making, finally leading to taking action. Therefore, acquiring systems thinking (and the othersystem-related competences) is a dominant goal for ESD and its implementation.An essential pre-condition for teaching systems thinking is knowledge of its diagnostics. Competencemodels have been developed and tested accordingly. Concept mapping has been proven highly feasibleas a valid assessment of systems thinking. Due to structural similarities between concept maps and theinfluence diagrams from the mystery method, the influence diagrams are presumed to be suitable fora diagnosis, which can take place in daily teaching practice [4]. Generally, as with concept maps, variousmethods can be used for evaluation [14,15].Sustainability-relevant human-environment systems are associated with uncertainty and riskconsiderations due to their complexity [16]. This makes evaluating learning tasks’ outputs difficult,as no clear solution can be defined. However, especially with the mapping techniques used frequentlywith systemic content, references are often used in assessment. But can there be a mapped reference ifthere is no clear solution for such maps? Benninghaus, Mühling, Kremer and Sprenger [4] were ableto provide several references that can be used for assessment. To create the references, the authorsconstructed a mystery within a (non-)sustainable consumption pattern (water-intensive, export-orientedtomato cultivation in Almería, Spain). The layout of the mystery comprised 18 information cards.In class, the students constructed influence diagrams by connecting those cards with meaningfularrows. In this way, the students discovered interconnections between the information on each card.They analyzed the system of tomato consumption and externalized their systemic knowledge intoinfluence diagrams, which, therefore, are valid for assessment.This mystery, respectively its cards, were then used to create the references via data mining [17].For this, the authors used experts, who determined if a connection between two particular cards existed.This was continued for every possible pairing of cards and thus followed the methodology of relatednessjudgments [18]. The data gathering was conducted online, and the digital data were then processed intodifferent references. They differed in the degree of experts’ consent, since the experts did not decide forevery pairing of cards equally. The consent ranged from complete unison (all experts agreed on/declineda connection) to connections drawn by only one expert. Based on this, the connections were weighted:connections agreed upon by many experts were given a high weight and could be viewed as ‘certain.’The weighting allowed the production of different references with varying aspects for use in assessment.The references are described in more detail in the methodology section.The objective of the present study is to analyze actual learners’ influence diagrams using thereferences and adapting the method with a view toward meaningful use in teaching practice. The keyquestion, therefore, is as follows: Which way of evaluation can provide the best results? There will bemultiple variants of evaluation approaches based on the references (and other variables), which willbe compared. For this, they will be correlated with the diameters of the students’ influence diagrams.(The diameter is a point of measure on the diagram, which is explained in more detail in the methodologysection.) The diameter allows conclusions about a map’s/influence diagram’s structural quality and isseen as a valid benchmark for evaluating our results.The precise procedure for gathering and compiling data, using the assessment variants, andintegrating the diameter is described in the methodology section, after the necessary theoreticalbackgrounds are presented, where the construct of systems thinking is in focus, as it is the main constructunderlying the capability to deal with systems. This is followed by the theoretical considerationof mapping techniques, including a more detailed description of the mystery method, as well asan overview of possible evaluation methods for influence diagrams/cognitive maps. The concreteprocedure of this study is described in the methodology section, followed by the evaluation of the dataobtained and their interpretation.
Educ. Sci. 2019, 9, 2603 of 152. Theoretical Background: Systems Thinking, Mapping Techniques, and the Mystery MethodAs already described, conceptualizations of system competences are broadly diversified. Theyall originate from the field of research dedicated to dealing with systems but are based on differentscientific approaches. In the context of ESD, the model of systems thinking represents an importantcontribution [6,7,19] and forms the theoretical framework for the work presented here.2.1. Systems ThinkingRieß and Mischo [7] summarized systems thinking as the ability “to identify important elementsof the system and the varied interdependency between these elements. Other key aspects are theability to recognize dimensions of time dynamics, to construct an internal model of reality, and to makeprognoses on the basis of that model” [7].These different areas of cognitive and action abilities indicate the need for a competence model.The model for systems thinking, according to Schuler, Fanta, Rosenkraenzer and Rieß [6], is dividedinto four sub-capabilities, with four dimensions formulated as hierarchical competence levels. Table 1shows the dimensions and the corresponding abilities from sub-capability no. 3, which is crucial forstructural mapping assessments, as the created structures from such an assessment may be understoodas system models.Table 1. Systems thinking dimensions and corresponding abilities from sub-capability no. 3 indescending order (authors’ depiction based on Schuler, Fanta, Rosenkraenzer and Rieß [6]).DimensionSub-Capability (No. 3)4: Evaluation of system modelsDetermining the validity of the application3: Problem-solving using system modelsGiving explanations, making predictions, and designingtechnologies based on qualitative system models2: Modeling systemsReading and understanding qualitative system models andconstructing influence diagrams1: Declarative/conceptual system knowledgeKnowledge of system hierarchiesAbove all, the construction of system models and influence diagrams is important for externalizingstudents’ systems thinking. The connections we can find in the models or diagrams provide visualsfor the students’ capabilities for systems thinking. They are of high value for researching systemsthinking, and comparable approaches are found in most studies on systems thinking or similar constructs(e.g., in Kunz, Frischknecht-Tobler, Bollmann-Zuberbuehler and Groesser [11]; Fanta, Braeutigam andRiess [19]; Assaraf and Orion [20]; and Mehren, Rempfler, Buchholz, Hartig and Ulrich-Riedhammer [9]).Since the mystery method also represents a kind of mapping technique, a more explicit treatment of suchtechniques is necessary to develop the mystery method’s role in assessing systems thinking.2.2. The Mystery Method as a Mapping AssessmentWhen investigating systems thinking, cognitive structures must be displayed visually.Operationalization is bound to suitable forms of representation that apply to all comparable concepts(see previous explanation). In many studies, concept mapping has proven to be a systemic formof representation [20–24]. Structural similarities between concept maps and influence diagrams,which emerge from applying the mystery method as the learning output, suggest that these influencediagrams also can be used for diagnostic purposes [4], because both concept maps and influencediagrams emerge as models of thought from the same process of modeling [25].Influence diagrams from the mystery method are usually constructed during classroom teaching.The mystery method takes place in cooperative, small-group settings. The students answer to a mysterious(and motivating) key question by sorting, weighting, and networking information cards. The goalis to create an influence diagram with the information cards to become aware of and visualize the
Educ. Sci. 2019, 9, 2604 of 15interconnections within the content (e.g., tomato consumption, see above). As a result, the students will beable to provide a comprehensive answer to the key question from the lesson. The process of constructinginfluence diagrams involves internal modeling, in which reality (tomato consumption) is reduced toits essential elements and relations by the mystery’s information cards and their interconnections, justlike in concept mapping. This process symbolizes the ability of systems thinking. It produces a modelof thinking that is externalized in the form of an influence diagram, which represents thought modelsand, therefore, is suitable for investigating systems thinking. Thus, it is reasonable to use the influencediagrams to assess systems thinking, which is presented later in this article.We would like to refer to the influence diagrams, emerging from the mystery method, as mysterymaps, as the basic principle of connecting the cards is similar to linking concepts in concept mapping.However, in the mystery used here, connections are limited to the cause-and-effect principle (by thetest persons, as they were by the experts during the reference study), while the amount of informationon the mystery cards represents more than a single concept in a concept map’s node [4]. Therefore,concept maps and mystery maps are quite different, but at the same time related, and allow the use ofequal assessment techniques, as will be shown next.2.3. Structural Analysis of Cognitive MapsDiagnostic work with cognitive maps is widespread and has become highly differentiated overtime. For this reason, a concentrated overview is provided here against the background of referencemaps and approaches largely from ESD and environmental education, as this gives a proper contextfor our study.Diagnosis by reference generally is widespread in mapping [26]. For example, Rebich andGautier [27] produced an expert map in the field of climate change and compared it with the maps oftheir test participants. According to the authors, the objective was not to evaluate the maps, but todetermine in which areas of the construct (climate change) concepts and propositions actually werepresent. Thus, the reference was used as an orientation to locate the concepts and propositionsexpressed by the test persons and, thus, to derive focal points. Rice, et al. [28] worked similarly usingan expert map to identify a set of concepts from the field of zoology that served as a kind of expectationhorizon for the test persons’ maps.Sellmann, et al. [29] created and used a reference map in a different way; its purpose wasto determine which individual propositions of the test persons were valid and which were not.The reference was created on the basis of a literature search and contained not only correct concepts,but also alternative ideas that were listed as such in the literature. Selection of the concepts themselveswas carried out on the basis of expert maps from extant literature. It is noteworthy that the authorshad group maps created with reference to Nesbit and Adesope [30], as this exerted a positive effect onthe maps, also see [31].The regulation of reference creation, including the number of experts involved, was not explainedin the presented studies. In contrast, the references prepared for the study presented here wereconstructed using as many experts as possible to achieve a high degree of consent saturation in theconnections, necessitated by the uncertainty inherent in the content (tomato consumption). Accordingly,this approach is necessary for all mapping procedures contextualized with uncertainty, which is notnoted in the listed studies. The references used there are not to be regarded as incorrect, but theyrepresent only a portion of the respective constructs. Therefore, cross-personal references are necessaryto increase security [4].3. MethodsFor clarity, throughout this article and especially within the methodological explanations,the connections between the information cards from the mystery method are referred to as edges,and the cards themselves are referred to as nodes if an empirical background is involved. Otherwise,
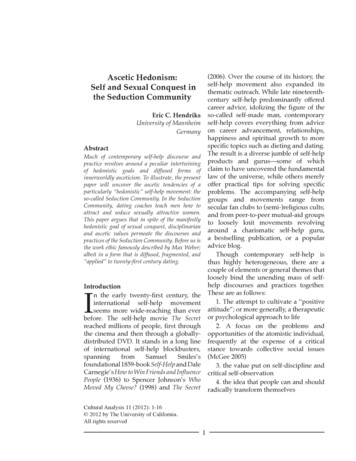
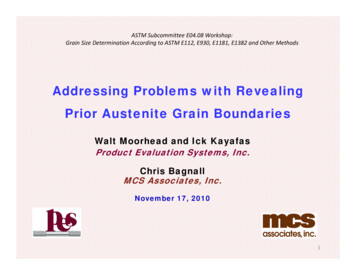
Educ. Sci. 2019, 9, 260Educ. Sci. 2019, 9, 2605 of 155 of 16the teaching-method level maintains the terms connection and information cards so that the context t Participantspersons used for this study were grades 9 and 10 high school students (ages 15 to 17).For datacollection,somestudentson gradesthe mysteryalone,workedin togroupsThetest personsusedfor this workedstudy were9 and 10highwhileschoolothersstudents(ages 1517). ofthree.purposes,selectionand groupdoneon workeda voluntarybasis ofunderFor Fordatapracticalcollection,some studentsworkedon the compositionmystery alone,werewhileothersin onelicited10mysterymapsfromindividualworkand21For practical purposes, selection and group composition were done on a voluntary basis underfromgroupwork. supervision. Data collection elicited 10 mystery maps from individual work and 21 fromthe teachers’Datacollection was embedded within a closed geographical teaching concept. The teachers usedgroup work.Datacollectionwas embeddedwithina closed geographicalteaching concept.The teachersmaterialsthatwere provided(contentinformation,method n,introductorycaricature,information cards) and were able to lead the entire lesson autonomously, as it would be done in ainformationand wereablewereto leadthe entireautonomously,as it wouldregularlesson. cards)The learningunitsscheduledforlessonthe usual90 min, of ut60werespent toworking only on the mystery. This rather long period of time was necessary to enable participantsworking only on the mystery. This rather long period of time was necessary to enable participants tocreate a clear structure with the information cards and trace the connecting arrows in a clearly visiblecreate a clear structure with the information cards and trace the connecting arrows in a clearly visibleway. The participants were not trained in working with mysteries, but as it is a famous method, theyway. The participants were not trained in working with mysteries, but as it is a famous method, theymay have recognized it from previous lessons. The influence diagrams were used only for the studymay have recognized it from previous lessons. The influence diagrams were used only for the studyandandthetheclassdiscussion at the lesson’s conclusion. No grading occurred; therefore, no performanceclass discussion at the lesson’s conclusion. No grading occurred; therefore, no performancepressurewasexertedpressure wasexertedbybythisthis means.means.AllAllmysterymapswerephotographedthen hEditorinto amystery maps were photographed andand hershowsananinfluenceinfluencediagramits digitizeda text-basedformat(TGF)furtheranalysis.analysis. FigureFigure 11 showsdiagramandandits nina abodybodyofofdatadatathatthat couldcould iagramdiagramfromfrom mysterymystery methoddigitizedgraph.Eachinformationcard cardFigure1. d a fixed number to allow for comparing the diagrams. They are shown in the graph . Basics for the Derivation of Evaluation Technology3.2. Basics for the Derivation of Evaluation TechnologyNo structural analysis techniques for mystery maps exist in the extant literature. A self-imposedNo structuralanalysistechniquesforwhichmysteryexist inself-imposedrequirementfor theevaluationtechnique,was mapsan objectiveof thethe extantpresentliterature.study, was Athatit mustnot be too complexso as to ensurethat it canbe appliedin practicein the contextrequirementfor the evaluationtechnique,whichwas anobjectivewithoutof the difficultypresent study,was that luationtechnique’svalidity,wecorrelatedmust not be too complex so as to ensure that it can be applied in practice without difficulty in theit withofestablishedmethodsof structuralgraphForourthisevaluationpurpose, thetechnique’smeasurementof the wecontextdiagnosticsof iameterisdefinedasthelongestcorrelated it with established methods of structural graph analyses. For this purpose, theshortest connectionthe graph,i.e., the twopreviously),points farthestif the numberedgesis takenas ismeasurementof the indiameter(mentionedforapart,example,can be ofused:Thediameterthe distance measure and paths are not artificially extended. Graphs that comprise long chains, ratherdefined as the longest shortest connection in the graph, i.e., the two points farthest apart, if thethan many branches, tend to have a larger diameter. Maps that are ‘well’ constructed are expected tonumber of edges is taken as the distance measure and paths are not artificially extended. Graphs thatbe more densely interconnected [32,33] and, therefore, will have small diameters. Finding a singlecompriselong chains, rather than many branches, tend to have a larger diameter. Maps that are ‘well’value that carries valid information about the specific structure of a graph is difficult, as a single valueconstructed are expected to be more densely interconnected [32,33] and, therefore, will have smalldiameters. Finding a single value that carries valid information about the specific structure of a graphis difficult, as a single value necessarily loses a lot of information that is present in the complete graph.The diameter is an example of such a value: its magnitude varies depending on the structure of thegraph, and for a given number of nodes and edges, many different graphs with distinct diameters
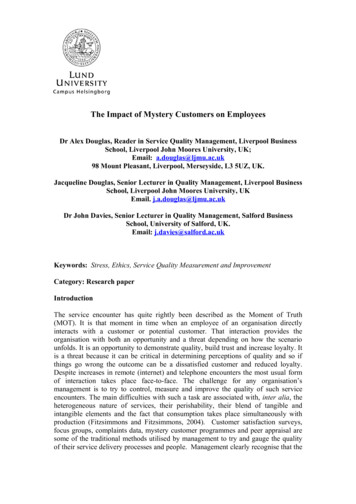
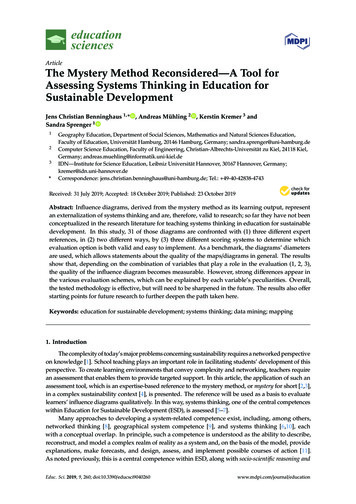
Educ. Sci. 2019, 9, 2606 of 15necessarilyEduc.Sci. 2019,loses9, 260 alot of information that is present in the complete graph. The diameter is an example6 of 16of such a value: its magnitude varies depending on the structure of the graph, and for a given numberWhatandconstitutesa largeor smalldiametergenerallycannot canbe answeredabsolutely,but forof nodesedges, manydifferentgraphswith distinctdiametersbe constructed.This propertystronglycross-linkedgraphs,the valueconstant,even withan increasingnumber of nodes,makes thevalue usefulin analysesthat remainsrefer to generalstructuralpropertiesof a network.whileWhatfor onlyweakly cross-linkedgraphs,it growslinearlycannotwith theof nodes.Transferredconstitutesa large or ut onstructedismorelikelytohaveasmallstrongly cross-linked graphs, the value remains constant, even with an increasing number of nodes,diameter,i.e., aweaklysolutioncross-linkedwith a smallgraphs,diameteris preferableone thewithnumbera largerofdiameter.while for onlyit growslinearlytowithnodes. ercanbeeasilyautomated,itis relativelyto mystery maps, a mystery map that is considered well-constructed is more likelyto have a timesmallconsumingto adeterminethe adiametermanually,as all thetoshortestpathsin thenetwork must bediameter, i.e.,solution withsmall diameteris preferableone witha largerdiameter.determinedfirst.we wereparticularlyevaluationthat itcaneasily beAlthoughtheSinceprocessfor measuringtheinteresteddiameter incanbe easily variantsautomated,is -consuming to determine the diameter manually, as all the shortest paths in the network mustthequality of suchalternative,weparticularlyused the correlationthe diameter.For example,be determinedfirst.anSincewe wereinterestedwithin evaluationvariantsthat can countingeasily beacarriedmap’soutedgesor comparingedgesa referencecanalternativesbe done easily,if anmanuallyby teachers,wewithexaminedpossiblein thisandstudy.Asuncomplicateda reference fortechniquewiththe complicatedthe goalof ourreached,as ouraim isthe qualitycorrelatesof such analternative,we useddiameter,the correlationwiththe valuationat theaend.For this,numbervariants, eacha map’sedges aorpracticalcomparingedges withreferencecanwebeconstructeddone easily,a andif herandcorrelatedwiththediameter.Threetechnique correlates with the complicated diameter, the goal of our research is reached, as ourdifferentaim is toelementswereavailableevaluationfor the variants,werecombinedto determinethe techniquethatbestrecommenda practicalat the whichend. Forthis,we constructeda numberof variants,eachofmeetsThe followingwerecorrelatedvaried: typeconnection,andwhich ourwas criteria.then comparedwith oneelementsanother telementstypescoring.for the variants, which were combined to determine the technique that best meets ourwereofavailablecriteria. The following elements were varied: type of reference, type of connection, and type of scoring.3.2.1. Type of Reference3.2.1. Type of ReferenceReference refers to the information obtained from expert data on the connections between the 18Referencerefers tocards,the informationobtainedfromActually,expert dataon16thecardsconnectionsbetweenthe 18mysteryinformationas describedpreviously.onlywere usedfor creatingmysteryinformationcards,as describedpreviously.Actually, only16 cardsusedappearingfor creatingandthethereference,as twocardsonly containedinformationaboutthe werepersonareference, as twocardsprevailingonly containedaboutthe personaappearingand environmentalenvironmentalsettingin theinformationmystery (seeBenninghaus,Mühling,Kremerand Sprengersettingprevailing in the mystery (see Benninghaus, Mühling, Kremer and Sprenger [4] for details).[4]for details).The obtainedobtained expertexpert datadata cancan bebe usedused inin threethree differentdifferent formsforms thatthat differdiffer inin theirtheir degreedegree ofofThecomplexity. First, therethere isis thethe completecomplete referencereference (Figure(Figure 2a),2a), containingcontaining allall connectionsconnections forfor whichwhich anyanycomplexity.number ofof expertsexperts indicatedindicated thatthat aa directdirect causalcausal linklink exists.exists. ThisThiswaswasaa mberthus, waswas correspondinglycorrespondingly complex.complex. ToTo reducereduce complexity,complexity, the second—andsecond—and mostmost reduced—variantreduced—variantthus,only containedmostof theexperts(see (seeFigure2b, majorityreference).Third, aThird,slightlyonlycontained edgesedgesdrawndrawnbybymostof theexpertsFigure2b, majorityreference).amore complexnetworknetworkthan the thansecond(the onepathfindernetwork,network,or Pf-Net)orwasobtainedusing theslightlymore complextheonesecond(the pathfinderPf-Net)was obtainedPathfinderalgorithm algorithm[34] (see Figure2c, Pf-Net)completedataset, as describedusingthe Pathfinder[34] (seeFigure on2c,thePf-Net)on thecompletedata set, inas Benninghaus,described inMühling, Kremerand Sprenger[4].SprengerThis processsystematicallyremoved certainedgesfor whichBenninghaus,Mühling,Kremer and[4]. Thisprocess ndirect pathsexisted.pathsBoth ofthe latteralternativediagramshad a reducedcomplexityforwhich better/weightierindirectexisted.Bothof the latteralternativediagramshad aand, therefore,wouldbe easierto handle,theyyield ouldshouldbe easierto handle,should theyyield comparable results.(a) completereference(b) majorityreference(c) pathfindernetwork(Pf-Net)Figure2. Referencesas a basis for the evaluationvariants:(a) complete reference,(b) majorityreference,and (c) 2.pathfindernetwork(Pf-Net).representvariants:the mysterycards basedon the dimensionsofFigureReferencesas a basisfor Nodesthe evaluation(a) completereference,(b) majoritysustainable development (green ecological, blue economical, and yellow social) [4].reference, and (c) pathfinder network (Pf-Net). Nodes represent the mystery cards based on thedimensions of sustainable development (green ecological, blue economical, and yellow social)[4].An evaluation scheme based on these three references can fall back on two structuralcharacteristics: (a) the existence of a connection in the reference and (b) the weight of this connection.
Educ. Sci. 2019, 9, 2607 of 15An evaluation scheme based on these three references can fall back on two structural characteristics:(a) the existence of a connection in the reference and (b) the weight of this connection. In the case of(a), one would like to make a specific yes-or-no decision for an edge and, thus, use either a majoritydecision by the experts or the existence of the corresponding edge in the Pf-Net as a criterion. However,the two variants are not equivalent, as the Pf-Net considers not only the weight of this edge whenremoving edges, but also the network’s overall structure. For (b), in a concrete solution from the testparticipants, a drawn connection can be checked to see to what extent it is likely that experts wouldhave drawn this certain edge. This information corresponds to the edge’s weight in the reference.3.2.2. Connection Types: Direct and IndirectEduc. Sci. 2019, 9, 2609 of 16The edges between the information cards from mystery maps can be distinguished in comparisonto a reference:A somewhat more lenient
influence diagrams from the mystery method, the influence diagrams are presumed to be suitable for a diagnosis, which can take place in daily teaching practice [4]. Generally, as with concept maps, various methods can be used for evaluation [14,15]. Sustainability-relevant human-env