Transcription
Database Design Using the READata ModelCopyright 2015 Pearson Education, Inc.17-1
Learning Objectives Discuss the steps for designing andimplementing a database system. Use the REA data model to design an AISdatabase. Draw an REA diagram of an AIS database. Read an REA diagram and explain what itreveals about the business activities and policiesof the organization being modeled.Copyright 2015 Pearson Education, Inc.17-2
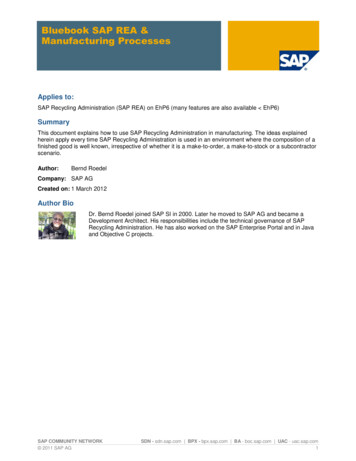
Database Design ProcessThere are five basic stages to the database design process:1. Systems analysis: identifies user needs, assess feasibility of developing anew system. Defines scope of the new system and makes preliminarydecisions on hardware and software requirements.2.Conceptual design: developing the different schema for the new system(Chapters 3 and 4 discussed the schemas).3.Physical design: translates the internal level schema into the actualdatabase structure.4. Implementation and conversion: includes all activities associated withtransferring data from existing systems to the new database, testing the newsystem, and training on how to use the new system.5. Use and Maintenance of new system: monitoring system performanceand user satisfaction of new system.Copyright 2015 Pearson Education, Inc.3
Note: Accountants need to be involved in theimplementation of new systems as theyunderstand information, how to control it and useit to report to management the performance of theorganization. In addition, accountants can providemanagement with evaluation of feasibility of theproject and can estimate return on investment. املحاسبني يحتاجون انهم يدخلون في تنفيذ النظام عشان يفهمون املعلومات ويقدرون يتحكمون فيها ويرسلون تقارير لإلدارة عن اداء الشركه ويقدرون بعد يقيمون املشاريع و العائد على االستثمار من قواعد البيانات هذي Copyright 2015 Pearson Education, Inc.4
is the process of creating a data model for the data to be stored in a Database.Data modeling is the process defining adatabase so that it faithfully represents all keycomponents of an organization’s environment.The objective is to explicitly capture and storedata about every business activity the organizationwishes to plan, control, or evaluate.Data modeling occurs during both the systemsanalysis and conceptual design stages of databasedesign.Copyright 2015 Pearson Education, Inc.5
Database Design ProcessCopyright 2015 Pearson Education, Inc.17-6
Data ModelingTwo important tools that accountants can use toperform data modeling: Entity-relationship (E-R) diagrams: is a graphicaltechnique for portraying a database schema. It iscalled an E-R diagram because it shows the variousentities being modeled and the importantrelationships among them. REA data model is so named because it classifiesentities into three distinct categories: the resourcesthe organization acquires and uses, the events(business activities) in which the organizationengages, and, the agents participating in theseevents.Copyright 2015 Pearson Education, Inc.There are two main methods to graphically depict a database: entityrelationship (E-R) diagrams and REA data model. The main difference is thatREA data models are specifically designed to be used for accountinginformation systems whereas E-R diagrams can depict any databaserelationship. REA models usually are depicted using E-R diagram notation.17-7
REA Modeling Resources Things that have economic valueorganization (e.g., inventory, cash)tothe Events Various business activities that managementwants to collect information on Agents People and organizations that participate in events(both internal (e.g., employees) and external (e.g.,customers/vendors) to the organization)Copyright 2015 Pearson Education, Inc.17-8
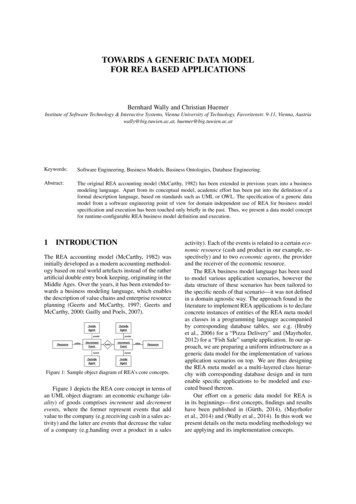
REA Basic TemplateCopyright 2015 Pearson Education, Inc.17-9
The Basic REA TemplateThe REA data model prescribes a basic pattern forhow the three types of entities (resources, events,and agents) should relate to one another. Theessential features of the pattern are as follows:1. Rule 1: Each event is linked to at least oneresource that it affects.2. Rule 2: Each event is linked to at least oneother event.3. Rule 3: Each event is linked to at least twoparticipating agents.Copyright 2015 Pearson Education, Inc.10
Developing an REA ModelDeveloping an REA diagram for a specific businesscycle consists of the following three steps:1. Identify relevant events Give-get exchange (economic duality)2. Identify resources and agents Resource reduced in give event Resource acquired in get event3. Determine cardinalities of relationships Nature of the relationship between the two entitiesCopyright 2015 Pearson Education, Inc.17-11
Cardinality Notation Methods Graphical symbols Graphical symbols represent minimum–maximum cardinalities (Min, Max) notation Pairs representing the minimum–maximumcardinalities UML notation Pairs representing the minimum–maximumcardinalities Maximums only (Microsoft Access)Copyright 2015 Pearson Education, Inc.17-12
Copyright 2015 Pearson Education, Inc.13
Copyright 2015 Pearson Education, Inc.14
Example 1: https://www.youtube.com/watch?v FQEJqRlda4ECopyright 2015 Pearson Education, Inc.15
Example 2:Copyright 2015 Pearson Education, Inc.16
The Basic REA Template. The REA data model prescribes a basic pattern for how the three types of entities (resources, events, and agents) should relate to one another. The essential features of the pattern are as follows: 1. Rule 1: Each event is linked to at least one resource that it affects. 2. Rule 2: Each event is linked to at least one other event. 3. Rule 3: