Transcription
Traditional Approaches:User-View Orientation When data-modeling and IS design is too orientedtoward the user’s views, problems arise:– multiple information systems– duplication of data– restricted user-view leads to poor decisionmaking– inability to support change
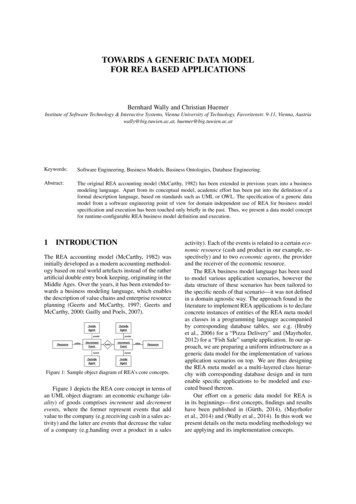
Resources, Events, and AgentsModel REA is an approach to database design meant toovercome problems with traditional approaches:– formalized data modeling and design of IS– use of centralized database– use of relational database structure– collects detailed financial and non-financial data– supports accounting and non-accountinganalysis– supports multiple user views– supports enterprise-wide planning
INTRODUCTION Accountants may provide the greatest value bytaking responsibility for data modeling—theprocess of defining a database to faithfullyrepresent all aspects of the organization,including interactions with the externalenvironment.– Occurs during both requirements analysis and designstage.– Two important tools to facilitate data modeling: Entity-relationship diagramming REA data model
THE REA DATA MODEL The REA data model was developed specificallyfor use in designing accounting informationsystems.– Focuses on business semantics underlying anorganization’s value chain activities.– Provides guidance for: Identifying the entities to be included in a database. Structuring the relationships among the entities. REA data models are usually depicted in theform of E-R diagrams. Therefore, we refer to E-R diagrams developedwith the REA model as REA diagrams.
THE REA DATA MODEL Three basic types of entities– The REA data model is so named because itclassifies entities into three distinctcategories: Resources that the organization acquires anduses. Resources are things that haveeconomic value to the organization.
THE REA DATA MODEL Three basic types of entities– The REA data model is so named because itclassifies entities into three distinctcategories: Resources that the organization acquires anduses. Events in which the organization engages. These are the various business activitiesabout which management wants tocollect information for planning orcontrol purposes.
THE REA DATA MODEL Three basic types of entities– The REA data model is so named because itclassifies entities into three distinctcategories: Resources that the organization acquires anduses. Events in which the organization engages Agents participating in these events. Includes people and organizations whoparticipate in events and about whominformation is desired for planning,control, and evaluation purposes.
THE REA DATA MODEL Can you identify the resources in this ReceiveCashEmployee
THE REA DATA MODEL Can you identify the resources in this ReceiveCashEmployee
THE REA DATA MODEL Can you identify the events in this ReceiveCashEmployee
THE REA DATA MODEL Can you identify the events in this ReceiveCashEmployee
THE REA DATA MODEL Can you identify the agents in this ReceiveCashEmployee
THE REA DATA MODEL Can you identify the agents in this ReceiveCashEmployee
THE REA DATA MODEL Structuring relationships: The basicREA template– The REA data model prescribes a basicpattern for how the three types of entities(resources, events, and agents) should relateto one another. Rule 1: Each event is linked to at least oneresource that it affects.
THE REA DATA MODELResource AEvent AResource BEvent B
THE REA DATA MODEL Structuring relationships: The basicREA template– The REA data model prescribes a basicpattern for how the three types of entities(resources, events, and agents) should relateto one another. Rule 1: Each event is linked to at least oneresource that it affects. Rule 2: Each event is linked to at least oneother event.
THE REA DATA MODELResource AEvent AResource BEvent B
THE REA DATA MODEL Structuring relationships: The basicREA template– The REA data model prescribes a basicpattern for how the three types of entities(resources, events, and agents) should relateto one another. Rule 1: Each event is linked to at least one resourcethat it affects. Rule 2: Each event is linked to at least one other event. Rule 3: Each event is linked to at least two agents.
THE REA DATA MODELResource AEvent AAgent AAgent BResource BEvent BAgent C
THE REA DATA MODEL Let’s take a closer look at each ofthese three rules.
THE REA DATA MODEL Rule 1: Every event entity must be linked toat least one resource entity.– Events must be linked to at least one resource thatthey affect. Some events affect the quantity of a resource:– If they increase the quantity of a resource, they are called a“get” event.– If they decrease the quantity of a resource they are called a“give” event.– Example: If you purchase inventory for cash:» The get event is that you receive inventory.» The give event is that you pay cash.– Relationships that affect the quantity of a resource aresometimes referred to as stockflow relationships.
THE REA DATA MODEL Not every event directly alters the quantity of aresource. If a customer orders goods but has not paid andhas not received goods, this activity is called acommitment event.– Organizations track the effects of commitments toprovide better service and for planning purposes.
THE REA DATA MODEL Rule 2: Every event entity must be linked toat least one other event entity.– Give and get events are linked together in what islabeled an economic duality relationship.– These relationships reflect the basic businessprinciple that organizations engage in activities thatuse up resources in hopes of acquiring otherresources in exchange.– Each accounting cycle can be described in terms ofgive-to-get economic duality relationships.
THE REA DATA MODEL The revenue cycle involves interactionswith your customers. You sell goods or services and get cash.GiveInventoryGetCash
THE REA DATA MODEL The expenditure cycle involvesinteractions with your suppliers. You buy goods or services and pay cash.GiveCashGetInventory
THE REA DATA MODEL In the production cycle, raw materials, labor, andmachinery and equipment time are transformedinto finished goods.Give (Use)RawMaterialsGive (Use)EmployeeTimeGive (Use)Machinery &EquipmentGet FinishedGoodsInventory
THE REA DATA MODEL The human resources cycle involvesinteractions with your employees. Employees are hired, trained, paid,evaluated, promoted, and terminated.GiveCashGetEmployeeTime
THE REA DATA MODEL The financing cycle involves interactions withinvestors and creditors. You raise capital (through stock or debt), repaythe capital, and pay a return on it (interest ordividends).GiveCashGetCash
THE REA DATA MODEL Not every relationship between two eventsrepresents a give-to-get economic duality.– Commitment events are linked to other eventsto reflect sequential cause-effectrelationships.– Example: Take customer order (commitment), which leadsto: Deliver inventory (give event) and receive cash(get event).
THE REA DATA MODEL Rule 3: Every event entity must belinked to at least two participatingagents.– For accountability, organizations need to beable to track actions of employees.– Also need to monitor the status ofcommitments and exchanges with outsideparties.– Each event links to at least two participatingagents.
THE REA DATA MODEL For events that involve transactions with externalparties:– The internal agent is the employee responsible for theaffected resource.– The external agent is the outside party to thetransaction. For internal events, such as transferring rawmaterials to the production floor:– The internal agent is the employee who gives upresponsibility or custody for the resource.– The external agent is the one who receives it.
DEVELOPING AN READIAGRAM To design an REA diagram for an entireAIS, one would develop a model for eachtransaction cycle and then integrate theseparate diagrams into an enterprise-widemodel. In this chapter, we focus on the individualtransaction cycles.
DEVELOPING AN READIAGRAM Developing an REA diagram for a specifictransaction cycle consists of three steps:– STEP ONE: Identify the events about whichmanagement wants to collect information.– STEP TWO: Identify the resources affected bythe events and the agents who participated.– STEP THREE: Determine the cardinalitiesbetween the relationships. Let’s walk through an example.
DEVELOPING AN READIAGRAM Developing an REA diagram for a specifictransaction cycle consists of three steps:– STEP ONE: Identify the events about whichmanagement wants to collect information.– STEP TWO: Identify the resources affected bythe events and the agents who participated.– STEP THREE: Determine the cardinalitiesbetween the relationships. Let’s walk through an example.
STEP ONE: IDENTIFY RELEVANTEVENTS At a minimum, every REA model must includethe two events that represent the basic “give-toget” economic exchange performed in thattransaction cycle. The give event reduces one of the organization’sresources. The get event increases a resource. There are usually other events that managementis interested in planning, controlling, andmonitoring. These should be included in themodel.
STEP ONE: IDENTIFY RELEVANTEVENTS Example: Typical activities in the revenuecycle include:– Take customer order– Fill customer order– Bill customer– Collect payment
STEP ONE: IDENTIFY RELEVANTEVENTS Example: Typical activities in the revenuecycle include: Taking the customer– Take customer order– Fill customer order– Bill customer– Collect paymentorder does not involvegiving or taking aresource. It is acommitment event.
STEP ONE: IDENTIFY RELEVANTEVENTS Example: Typical activities in the revenuecycle include:– Take customer order– Fill customer order– Bill customer– Collect payment Filling the orderinvolves a reduction inthe company’sinventory. It is a giveevent.
STEP ONE: IDENTIFY RELEVANTEVENTS Example: Typical activities in the revenuecycle include:– Take customer order– Fill customer order – Bill customer– Collect paymentBilling customersinvolves the exchangeof information with anexternal party but doesnot affect resources.
STEP ONE: IDENTIFY RELEVANTEVENTS Example: Typical activities in the revenuecycle include:– Take customer order– Fill customer order– Bill customer Collecting payment– Collect paymentresults in an increase incash. It is a get event.
STEP ONE: IDENTIFY RELEVANTEVENTS Example: Typical activities in the revenuecycle include:– Take customer order– Fill customer order– Bill customer– Collect payment The give-to-get, then, is:– Fill customer order(often referred to as“sale”);– Collect cash (oftenreferred to as “cashreceipt”).
STEP ONE: IDENTIFY RELEVANTEVENTS Example: Typical activities in the revenuecycle include:– Take customer order– Fill customer order– Bill customer – Collect paymentShould “take customerorder” and “billcustomer” be includedin the model?
STEP ONE: IDENTIFY RELEVANTEVENTS Example: Typical activities in the revenuecycle include: Taking an order requires– Take customer order– Fill customer order– Bill customer– Collect payment that we set resourcesaside.That information shouldbe included in ourmodel.
STEP ONE: IDENTIFY RELEVANTEVENTS Example: Typical activities in the revenue Printing and mailingcycle include:invoices does not directly– Take customer order– Fill customer order– Bill customer– Collect payment affect an economicresource.It does not represent acommitment on the part ofthe company to a futureexchange.It is an informationretrieval event and shouldnot alter the contents ofthe database.Does not need to beincluded in the model.
STEP ONE: IDENTIFY RELEVANTEVENTS Although accounts receivable is an assetin financial reporting, it is not representedas a resource in an REA model.– It represents the difference between totalsales to a customer and total cash collectionsfrom the customer.– The information to calculate an accountsreceivable balance is already there becausethe sales and cash receipt information iscaptured.
STEP ONE: IDENTIFY RELEVANTEVENTS Events that pertain to “entering” data or“re-packaging” data in some way do notappear on the REA model.– They are not primarily value-chain activities.– What is modeled is the business event andthe facts management wants to collect aboutthe event, not the data entry process.
STEP ONE: IDENTIFY RELEVANTEVENTS In completing the first step of an REAdiagram, the event entities are typicallydrawn from top to bottom in the sequencein which they normally occur.
STEP ONE: IDENTIFY RELEVANTEVENTSTake OrderSaleReceiveCash
DEVELOPING AN READIAGRAM Developing an REA diagram for a specifictransaction cycle consists of three steps:– STEP ONE: Identify the events about whichmanagement wants to collect information.– STEP TWO: Identify the resources affectedby the events and the agents whoparticipated.– STEP THREE: Determine the cardinalitiesbetween the relationships. Let’s walk through an example.
STEP TWO: IDENTIFYRESOURCES AND AGENTS When the relevant events have beendiagrammed in the center of the REAdiagram, the resources that are affectedby those events need to be identified. Involves determining:– The resource(s) reduced by the give event.– The resource(s) increased by the get event.– The resources that are affected by acommitment event.
STEP TWO: IDENTIFYRESOURCES AND AGENTSTake Order SaleReceiveCashWhat is thegive event?
STEP TWO: IDENTIFYRESOURCES AND AGENTSTake Order SaleReceiveCashWhat is thegive event?
STEP TWO: IDENTIFYRESOURCES AND AGENTSTake Order InventorySaleReceiveCashWhat resourceis reduced bythe give event?
STEP TWO: IDENTIFYRESOURCES AND AGENTSTake Order InventorySaleReceiveCashWhat is the getevent?
STEP TWO: IDENTIFYRESOURCES AND AGENTSTake Order InventorySaleReceiveCashWhat is the getevent?
STEP TWO: IDENTIFYRESOURCES AND AGENTSTake OrderInventorySale CashReceiveCashWhat resourceis increased bythe get event?
STEP TWO: IDENTIFYRESOURCES AND AGENTSTake OrderInventorySale CashReceiveCashIs there acommitmentevent?
STEP TWO: IDENTIFYRESOURCES AND AGENTSTake OrderInventorySale CashReceiveCashIs there acommitmentevent?
STEP TWO: IDENTIFYRESOURCES AND AGENTSTake OrderInventorySale CashReceiveCashWhat resourceis affected bythecommitmentevent?
STEP TWO: IDENTIFYRESOURCES AND AGENTS The agents who participate in each eventshould also be identified.– There will always be at least one internalagent (employee).– In most cases, there will also be an externalagent (e.g., customer or supplier) whoparticipates.
STEP TWO: IDENTIFYRESOURCES AND AGENTS What agentsTake Orderare involved inthe sale?InventoryCustomerSaleEmployeeCashReceiveCash
STEP TWO: IDENTIFYRESOURCES AND AGENTS What agentsTake Orderare involved inthe receipt hCustomer
STEP TWO: IDENTIFYWhatagentsRESOURCESANDAGENTSare involved intaking theorder?Take iveCashCustomer
DEVELOPING AN READIAGRAM Developing an REA diagram for a specifictransaction cycle consists of three steps:– STEP ONE: Identify the events about whichmanagement wants to collect information.– STEP TWO: Identify the resources affected bythe events and the agents who participated.– STEP THREE: Determine the cardinalitiesbetween the relationships. Let’s walk through an example.
STEP THREE: DETERMINECARDINALITIES OFRELATIONSHIPS The final step in an REA diagram for atransaction cycle is to add information about therelationship cardinalities. A cardinality describes the nature of therelationship between two entities.– It indicates how many instances of one entity can belinked to a specific instance of another entity.– For example, the cardinality between the event Salesand the agent Customer answers the question: For each sale a company makes, how many customers areassociated with that sale?
STEP THREE: DETERMINECARDINALITIES OFRELATIONSHIPS Unfortunately, there is no universalstandard for diagramming cardinalities. In this text, we adopt the graphical “crow’sfeet” notation style because:– It is becoming increasingly popular.– It is used by many software design tools.
STEP THREE: DETERMINECARDINALITIES OFRELATIONSHIPS Using the crow’s feet notation:– The symbol for zero is a circle: O
STEP THREE: DETERMINECARDINALITIES OFRELATIONSHIPS Using the crow’s feet notation:– The symbol for zero is a circle: O– The symbol for one is a single stroke:
STEP THREE: DETERMINECARDINALITIES OFRELATIONSHIPS Using the crow’s feet notation:– The symbol for zero is a circle: O– The symbol for one is a single stroke: – The symbol for many is the crow’s foot:
STEP THREE: DETERMINECARDINALITIES OFRELATIONSHIPSCustomerSale There is typically a minimum andmaximum cardinality for each entityparticipating in a relationship.
STEP THREE: DETERMINECARDINALITIES OFRELATIONSHIPSCustomerSale The minimum cardinality can beeither zero or one.The symbols for the minimumcardinalities are shown above inred.
STEP THREE: DETERMINECARDINALITIES OFRELATIONSHIPSCustomerSale The minimum cardinality symbolnext to customer is the symbol forone.This symbol means that for everyoccurrence of a sale, there must bea minimum of one customerinvolved.
STEP THREE: DETERMINECARDINALITIES OFRELATIONSHIPSSale CustomerThe minimum cardinality symbol next to sale is thesymbol for zero.This symbol means that for every customer in thedatabase, there must be a minimum of zero sales. Thisminimum of zero allows the company to add a customerto its database before any sales have been made to thatcustomer, i.e., a prospective customer can be included.
STEP THREE: DETERMINECARDINALITIES OFRELATIONSHIPSCustomerSale The maximum cardinality can beeither one or N (many).The symbols for the maximumcardinalities are shown above inred.
STEP THREE: DETERMINECARDINALITIES OFRELATIONSHIPSCustomerSale The maximum cardinality symbolnext to customer is the symbol forone.This symbol means that for everyoccurrence of a sale, there can beno more than one customerinvolved.
STEP THREE: DETERMINECARDINALITIES OFRELATIONSHIPSSale CustomerThe maximum cardinality symbol next to sale is thesymbol for many.This symbol means that for every customer in thedatabase, there can be many sales involved. Obviously,a company can make multiple sales to an individualcustomer.
STEP THREE: DETERMINECARDINALITIES OFRELATIONSHIPS Three types of relationships– Three types of relationships are possible betweenentities.– Relationships depend on the maximum cardinality oneach side of a relationship. A one-to-one relationship (1:1) exists when the maximumcardinality for each entity in the relationship is one.
STEP THREE: DETERMINECARDINALITIES OFRELATIONSHIPSTake Order SaleBoth maximumsare one, so this isa one-to-onerelationship.
STEP THREE: DETERMINECARDINALITIES OFRELATIONSHIPS Three types of relationships– Three types of relationships are possible betweenentities.– Relationships depend on the maximum cardinality oneach side of a relationship. A one-to-one relationship (1:1) exists when the maximumcardinality for each entity in the relationship is one. A one-to-many (1:N) relationship exists when themaximum cardinality on one side is one and themaximum on the other side is many.
STEP THREE: DETERMINECARDINALITIES OFRELATIONSHIPSSale CustomerThe maximum number of customers that can beinvolved in each sale is one.The maximum number of sales that can be associatedwith any individua
The REA data model was developed specifically for use in designing accounting information systems. – Focuses on business semantics underlying an organization’s value chain activities. – Provides guidance for: Identifying the entities to be included i