Transcription
This PDF is a selection from an out-of-print volume from the National Bureauof Economic ResearchVolume Title: Population, Labor Force, and Long Swings in Economic Growth:The American ExperienceVolume Author/Editor: Richard A. EasterlinVolume Publisher: NBERVolume ISBN: 0-87014-474-XVolume URL: http://www.nber.org/books/east68-1Publication Date: 1968Chapter Title: The American Baby Boom in Historical PerspectiveChapter Author: Richard A. EasterlinChapter URL: http://www.nber.org/chapters/c1119Chapter pages in book: (p. 77 - 110)
FNGS)rrect, then, as Abramovitzation of effective demande discernible long swings.of the appropriateto variables and relationen customary in the past.PART II /FERTILITY ANALYSES—
rCHAPTER4/THE AMERICAN BABYBOOM IN HISTORICAL PERSPECTIVEThis chapter focuses on the recent baby boom, particularly on theextent to which this represents an abrupt break with past experience.The next chapter extends the analysis to the current fertility decline.We first take a fresh look at the historical record in the light ofthe Kuznets-cycle conception of economic change, taking care todiscuss separately the experience of three population groups withsignificantly different patterns—foreign-born, native-born urban, andnative-born rural. After a brief retracing of several earlier findings,the analysis quickly moves onto new ground, exploring some possiblereasons for the pattern observed.The analysis is confined to the white population because of thegreater reliability of the data for this group and its predominantinfluence in determining the pattern for the total.KUZNETS CYCLES IN U.S. POPULATIONGROWTH AND FERTILITYThe Rate of Total IncreaseWe start with the rate of population growth. Since we areinterested in focusing on major movements, we employ five-yearaverages of the basic data,' a choice governed partly by preference—to eliminate or at least reduce the shorter-term changes associatedwith the ordinary business cycle—and partly by necessity—because ofthe initial mold in which some of the basic data are cast, particularlythose relating to fertility.NOTE: An earlier version of this chapter was published in December 1981 in theAmerican Economic Review, and was reprinted by the National Bureau as itsOccasional Paper 79.'For the rate of total increase, the average is implicit. The rate, which Isactually calculated from observations on the population stock separated by fiveyears, yields a time pattern equivalent to that of a geometric average of the annualrates of change within the successive quinquennia.
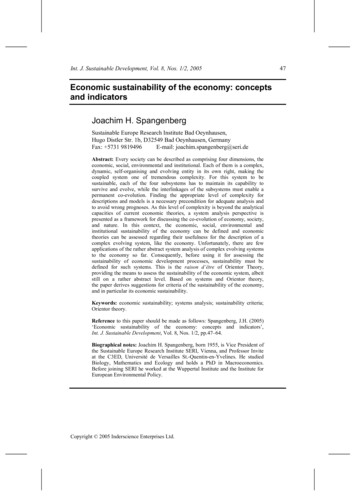
78 / II: FERTILITY ANALYSESFigure 22 shows the average rate of increase of the U.S. whitehistorical record has consdownward drift through the 1930's and the recent increase areupsurge in the rate of pbirth rate rather than inpopulation in successive quinquennia from 1870 to 1955. The familiarimmediately apparent. Less familiar, but equally obtrusive, are sig-nificant fluctuations in the rate of change. The duration of thefluctuations has run from ten to thirty-five years and their averagemagnitude has amounted to about one-quarter of the mean rate ofchange over the period as a whole. In Chapter 2, the components ofpopulation growth responsible for these fluctuations were identified(Figure 2). It was noted that, while immigration was typically theprincipal factor in the past, the recent population upsurge has beendue to fertility.Since 1870, then (and indeed even before [103, p. 36; 107]), theFIGURE 22AVERAGE GROWTH RATE OF TOTAL WHITE POPULATION, 1870—1959the rate of population grrecent increase bears onlythat, given the new immin the rate of growth waris correct or whether the rto its forebears is a questichapter.The Birth Rate of tJLet us turn to the conthe center of our intereit possible to reconstrucithe white population ofestimates have been avEkeeping with our interestThe upper panelofthe movemeby a five-year average—.through the secular troualternated with intervalsThese are the longsomewhat different set centire eighty-year perioc2 Economists are perhapson population change. Wheino annual data on the crudeperspective to the years befoilion by Melvin Zelnik, carrliUniversity, under the supersrived by applying appropriatof-age distributions adjustedages, primarily those endingthe patterns traced by1875-85-95-05-15-8090001020SoURcE: Table C-i.253035-40455059the same; for earlielreliable because of the lesseimates. The dissertation hasthe figures in the thesis.
THE AMERICAN BABY BOOM / 79increase of the U.S. white1870 to 1955. The familiarthe recent increase arehistorical record has consistently been marked by major swings inthe rate of population growth. But since the source of the recentupsurge in the rate of population growth has been a rise in thee years and their averagearter of the mean rate ofbirth rate rather than in immigration, one might maintain that thisrecent increase bears only a surface resemblance to prior swings andthat, given the new immigration restrictions of the 1920's, recoveryin the rate of growth was hardly to be expected. Whether this viewre [103, p. 86; 107]), theLet us turn to the component of population change that constitutesequally obtrusive, are sig-ge. The duration of thepter 2, the components ofuctuations were identifiedigration was typically theupsurge has beenOPI.TLATION, 1870—1959is correct or whether the recent movement does bear a logical relationto its forebears is a question to which I return toward the end of thechapter.The Birth Rate of the Total White Populationthe center of our interest, the birth rate. Recent work has madeit possible to reconstruct a full century of fertility experience forthe white population of the United States.2 The annual birth rateestimates have been averaged here for successive quinquennia, inkeeping with our interest in discerning Kuznets cycles.The upper panel of Figure 23 brings out clearly the long-termdecline in the level of the birth rate and its recent recovery. It alsoshows that the movement of the birth rate—even when smoothedby a five-year average—has been far from regular. For the periodthrough the secular trough of the 1930's, intervals of rapid declinealternated with intervals of slower decline or even absolute increase.These are the long swings in fertility which Kuznets found in asomewhat different set of figures. They are apparent throughout theentire eighty-year period of fertility decline covered here.2 Economists are perhaps not generally aware of the scarcity of historical dataon population change. When Kuznets made his study in 1958 [103], there wereno annual data on the crude birth rate before 1909. The new series, extending ourperspective to the years before the Civil War, is the product of a doctoral dissertalion by Melvin Zelnik, carried on at the Office of Population Research, PrincetonUniversity, under the supervision of Ansley Coale [2201. The estimates were derived by applying appropriate mortality rates to the decennial census single-yearof-age distributions adjusted for "age heaping" (excessive reporting of certainages, primarily those ending in 0 and 5). As the upper panel of Figure 23 shows,the patterns traced by these and the official estimates in the overlap period arevirtually the same; for earlier dates, however, the Zelnik figures are somewhat lessreliable because of the lesser accuracy or availability of data needed for the estimates. The dissertation has now been published [321, but my analysis above usesthe figures in the thesis.
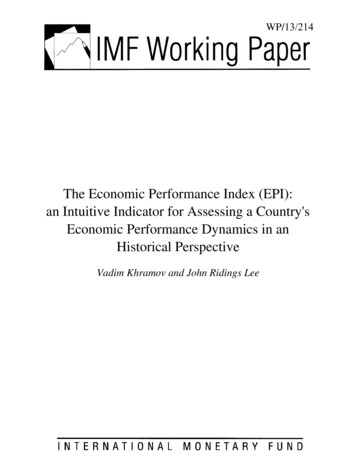
FIGURE 23The lower panel ofcentage rate of changethe data plotted in theLEVEL AND RATE OF CHANGE OF CRUDE BIRTH RATE OF TOTAL WHITEPOPULATION 1855—1959Crude birth rate(per thousand population)Ratio scaleper quinquennium8 per cent. If this rate hiperiod, the individual obline shown in the figureabout the line makes cliwere of substantialdeviations from the meadecline itself. The duratiof this century was fifte40 -20-185559to peak or trough to 9of much longer durationBut of what interesitative history forsuggest that it leads to 1ord, which has significaence. Typically, the histcthe long-term secular detion that this declinebeen repeatedly charactand substantialleads naturally to theabrupt break—a reversalof historical change enmight be conceived as Iaround the trend—agreater amplitude andview implies less of araises the possibility of,1855-59 65-6975-7970-7480-84to60-64totoSouRcE: Table o30-3440-4450-54toTo avoid confusion, it Snot the rate of change therechange shown in Figure 22not necessarily implycohorts (see the concluding'For examples of this see153, Ch. 13].
THE AMERICAN BABY BOOM / 81R RATE OF TOTAL WHITE)59The lower panel of Figure 23 presents the quinquennial percentage rate of change of the birth rate, computed directly fromthe data plotted in the upperThe average rate of declineper quinquennium through the secular trough in 1935—39 was about6 per cent. If this rate had prevailed uniformly throughout the entireperiod, the individual observations would have formed the horizontalline shown in the figure. The movement in the actual observationsabout the line makes clear that the variations in the rate of changewere of substantial magnitude; in fact, the average value of the25—29353945-deviations from the mean amounts to six-tenths of the mean rate ofdecline itself. The duration of the two swings through the first decadeof this century was fifteen to twenty years, whether measured peakto peak or trough to trough. The movements since then have beenof much longer duration, on the order of thirty-five to forty years.But of what interest, it may be asked, is this exercise in quantitative history for analysis of the baby boom? In reply, one mightsuggest that it leads to revising one's conception of the historical record, which has significant implications for interpreting recent experi-55-4959ence. Typically, the historical movement which has been emphasized isTo this I would now add the observathe long-term seculartion that this decline has been far from regular; that, in fact, it hasbeen repeatedly characterized by fluctuations of noticeable amplitudeand substantial duration. The customary interpretation of the pastleads naturally to the view that recent experience constitutes anabrupt break—a reversal in primary trend. In contrast, the conceptionof historical change employed here suggests that recent experiencemight be conceived as the latest in a succession of major movementsaround the trend—a Kuznets cycle which, for some reason, is of muchgreater amplitude and duration than its predecessors. Clearly thisview implies less of a break with historical experience and at leastraises the possibility of more easily reconciling the present with theLL25-29to30-34To avoid confusion, it should be noted that (1) it is the birth rate itself andnot the rate of change therein that is the component of the rate of total populationIii35-3945.4940-4450-54-.change shown in Figure 22, and (2) swings in annual birth or fertility rates donot necessarily imply swings in the completed fertility of successive populationcohorts (see the concluding section of Chapter 5).For examples of this see [86, 185, 206] and more recently [69; 82, Chs. 2, 11;153, Ch. 13].----'
82 / II: FERTILITY ANALYSESpast—a sine qua non of any attempted explanation of the baby boom.Moreover, it suggests a new research strategy with regard to thebaby boom, namely, that one focus on explaining Kuznets cycles, pastand present, in an effort to determine whether the underlying causesof these movements may have operated with exceptional force inrecent decades. It is in terms of this conception that the subsequentanalysis is organized.Before proceeding to this analysis, there is one more feature ofFigure 23 that deserves attention. This is the precipitous decline inthe birth rate during the 1920's. A trend line fitted to the pre-1920data in the upper panel and extended through the next two decadeswould lie not only above the observations for the 1930's, but abovethat for 1925—29 as well. From the lower panel, one finds that therate of decline between the first and second halves of the 1920's wasthe second highest in the one hundred-year record, falling onlyslightly below that in the next overlapping decade. This drastic declineduring a period of high prosperity has been cited by demographersas grounds for discounting efforts to explain the baby boom on thebasis of economic factors. For example: ". . the interpretation ofthe baby boom as the natural consequence of prolonged prosperityis hardly more tenable than the earlier interpretation of the reversal.in the 1930's as momentary. The next earlier period of notable prosperity in the United States—the 1920's—was a period of sharply fallingfertility. In fact, as Dudley Kirk points out, the depressed 1930'sproduced more births by far than one would expect on the basis ofan extrapolation of the trend of the prosperous 1920's."Ansley J. Coale, Introduction [170, pp. 5—6]. The reference is to Dudley Kirk,"The Influence of Business Cycles on Marriage and Birth Rates" [170, pp. 241—260]. The method followed by Kirk in his analysis is to correlate "trend deviationsof economic measures (as independent variables) to measures of nuptiality andnatality (as dependent variables)" [170, p. 242], using fertility data for the totalpopulation for the period 1920—58. While the results are relevant to analysis offertility variations within the ordinary business cycle, in my view they cannot beused to draw inferences about the baby boom. The "trend" lines fitted for theperiod 1920—58 largely reproduce the Kuznets cycle which constitutes the babyboom. By concentrating on explaining deviations from "trend," Kirk in effecteliminates from his analysis the baby boom itself. Moreover, even with regard tobusiness cycle analysis, it would be of interest to distinguish components of thetotal population whose fertility was subject to substantially different influences, asis done below for Kuznets cycles.TABLE 1. PERCENTAGE20-44, BY NATIVITY,BY RURAL-URBAN RESIITotal whiteForeign-born whiteNative whiteUrbanRuralSOURCE: Table C-5 and ceraBased on 1950 census defiClearly, an attempt tdevote special attentionThe Fertility of theThe fertility of the Iof a number ofto common, influences. \boom if we considerforeign-born white popiand rural components. Tfemales of reproductivevarious dates. In the pifor the foreign-born andFor the dependentsuse the fertility ratio, Uthe number of womenthe available data. As t]typically exceeds the ciiof twenty to twenty-five:Total WhiteCrude birth rate (annulFertility ratio (next cens6 A good discussion of thfertility ratio is given in [&
THE AMERICAN BABY BOOM / 83nation of the baby boom.Ltegy with regard to theining Kuznets cycles, pasther the underlying causesvith exceptional force inption that the subsequentre is one more feature ofthe precipitous decline inme fitted to the pre-1920igh the next two decadesfor the 1930's, but abovepanel, one finds that thehalves of the 1920's wasear record, falling only:cade. This drastic declinea cited by demographersa the baby boom on thethe interpretation ofof prolonged prosperitypretation of the reversalieriod of notable prosperperiod of sharply fallingut, the depressed 1980'sd expect on the basis of .us 1920's."reference is to Dudley Kirk,Birth Rates" (170, pp. 241—to correlate "trend deviationsmeasures of nuptiality andng fertility data for the totals are relevant to analysis ofin my view they cannot be"trend" lines fitted for thewhich constitutes the babymm "trend," Kirk in effectoreover, even with regard toIstinguish components of thedifferent influences, asTABLE 1. PERCENTAGE DISTRIBUTION OF WHITE FEMALES,20-44, BY NATIVITY, AND OF NATIVE WHITE FEMALES, 20-44,BY RURAL-URBAN RESIDENCE, 1890-1950Total whiteForeign-born whiteNative .695.464.730.7SOURCE: Tabk C-5 and census reports.aBased on 1950 census definition of "urban."Clearly, an attempt to reconcile present with past experience mustdevote special attention to the record for the 1920's.The Fertility of the Native and Foreign-Born White PopulationsThe fertility of the total white population is a composite of thatof a number of subgroups, each subject in part to distinctive, in partto common, influences. We can gain further perspective on the babyboom if we consider separately the experience of the native andforeign-born white populations, and, within the former, the urbanand rural components. Table 1 indicates the proportion of total whitefemales of reproductive age accounted for by each of these groups atvarious dates. In the present section, we consider fertility patternsfor the foreign-born and total native white populations.For the dependent variable, instead of the crude birth rate I nowuse the fertility ratio, the number of children under 5 years old tothe number of women 20 to 44 years old, a choice necessitated bythe availableAs the following figures suggest, the fertility ratiotypically exceeds the crude birth rate by a factor in the neighborhoodof twenty to twenty-five:Total White Population1885—891905—91925—29Crude birth rate (annual average)35.374429.463222.4505Fertility ratio (next census date) A good discussion of the conceptual and statistical problems relating to thefertility ratio is given in [82, p. 13 and Appendix A].I
84 / II: FERTILITY ANALYSESAnalytically, this reflects the fact that the fertility ratio is computedfrom (a) a denominator about one-fifth as large as that for thecrude birth rate (females aged 20—44 instead of the total population), and (b) a numerator four to five times as large. (Implicitly,birth experience over a five-year period is totaled rather than averaged,and is multiplied by a survival rate on the order of .85 to .95 to exclude those dying before the end of the period.) Thus the time patterns traced by the two measures may differ somewhat because ofvariations in the ratio of women aged 20—44 to the total populationand in the mortality of children under 5 years, particularly in infantLEVEL AND RATE OF CHANGEBAL FERTSLITY StATE, 192Fertility ratio1.000900 -600 —mortality.7500 -by nativity from 1875—79 to 1925—29, and, supplemented by general40058.8 The observations on fertility ratios are at census and mid-censusdates, but since they reflect fertility behavior over the preceding fiveyears, we have dated them according to the quinquennia to which they3001865-Figure 24 presents fertility ratios for the total white population-fertility rates, for the native and total white populations to 1954—refer. The lower panel shows the percentage rate of change perquinquennium in each series, computed in the same fashion as for thepreceding figure.Several points deserve mention. First, Kuznets cycles are evidentin the series for both the native- and foreign-born groups. Through1925—29, the timing of the swings appears to be usually the same,but the amplitude is substantially greater for the foreign-born white.There is some suggestion of increasing amplitude, particularly for theIII7579698589V. change ptr Quinquenniumintertility ratio 10 —a0-native white, and in the most recent period the magnitude of theswing for this group is strikingly greater than previous ones. Arithmetic1 Forthe total white population, the only one for which comparison is possible,the directions of change in the rate of change of the crude birth rate and of thefertility ratio are identical from 1885—89 on, the principal period of the analysis,with one exception. This exception is primarily due to an understatement of thefertility ratio for 1910—14, because no adjustment was made for the exceptionaleffect of the influenza epidemic of 1918.8 The fertility ratio estimates, prepared in connection with the present study,are based in large part on a valuable unpublished memorandum prepared byEverett S. Lee providing age and parentage detail underlying the quinquennialestimates of native white population published by Kuznets [103]. Because ofomissions or defects in the recent reporting of parentage and nativity, it was notpossible to continue these estimates beyond 1925—29. However, to provide someidea of the pattern after 1925—29, use has been made of the official estimates ofthe closely comparable general fertility rate (live births per 1,000 females aged15—44) for the total and native white 90Ito95Table C-3.analysis of the swingscaused in important minative and foreign-borshifts in the relative imi
rTHE AMERICAN BABY BOOM / 85fertility ratio is computedFIGURE 24as large as that for the1865—1929, AND OF GENLEVEL AND RATE OF CHANGE OF FERTILITYERAL FERTILITY RATE, 1920—58; TOTAL WRITE POPULATION, BY NATIVITYhead of the total populames as large. (Implicitly,General fertility roteFertihty rotLo1,000:aled rather than averaged,order of .85 to .95 to exnod.) Thus the time patFer somewhat because of4 to the total populationars, particularly in infant120110100ie total white populationsupplemented by generalite populations to 1954—at census and mid-censusr over the preceding fiveuinquennia to which they9 800101 whtteRatio 5-35-25—291939II4549—I705458age rate of change pere same fashion as for theuznets cycles are evidentn-born groups. Throughto be usually the same,the foreign-born white.tude, particularly for thethe magnitude of the)revious ones. Arithmeticvhich comparison is possible,crude birth rate and of theicipal period of the analysis,to an understatement of theas made for the -3945-49tO54-58tototoSouRcE: Table C-3.ion with the present study,memorandum prepared bytnderlying the quinquennialKuznets [103]. Because ofsge and nativity, it was notanalysis of the swings in the total white group shows that they arecaused in important measure by the fertility movements of both thenative and foreign-born components, and that the contribution ofHowever, to provide someof the official estimates ofths per 1,000 females agedshifts in the relative importance of the two groups has been negligible.tI
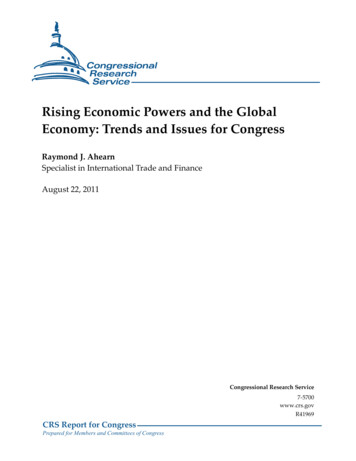
86 / II: FERTILITY ANALYSESThe native-born white group, despite the smaller amplitude of itsswings, typically accounted for the dominant part of the movementin the total because of its much greater share (Table C-12).Some light is also cast on the precipitous rate of decline in totalwhite fertility in the 1920's. For both the foreign- and native-bornpopulations there is a substantial drop in the fertility ratio between thefirst and second halves of the decade. However, the decline for theforeign-born is more than double that for the native—29 against 12per cent. Hence, a significant part of the decline in total white fertilityin the 1920's—to be precise, about one-third (Table C-12)—was owingto the drastic reduction in the fertility of the foreign-born white population. Indeed, for this group, if one adds the movement between thetwo preceding quinquennia, the drop in fertility was nothing short ofspectacular. Between 1915—19 and 1925—29 the foreign-born whitefertility ratio dropped by about four-tenths, more than double thedecline during the preceding forty years.The Fertility of the Urban and Rural Native White PopulationsOur data now become even more limited, relating only to thelatter half of each decade from 1885—89 on. Estimates published by theNational Resources Committee [204] for 1905—9 through 1925—29 havebeen carried back two additional decades. A constant 5 per cent adjustment by the NRC for underenumeration of children under fiveyears has been accepted here, in part because no basis for a differential rural-urban adjustment was readily available, and in part becausethe analysis rests primarily on the figures for the more reliable censusesfrom 1900 on. Our immediate interest is in the pattern through 1925—29, and estimates for the native white population by rural-urban residence are only available to this point. To fill out the picture since then,however, we have added overlap figures for the total white populationfor 1925—29 on, an approximation which seems reasonable in view ofthe much diminished importance of the foreign-born in recent years.As is clear from the curve for the total native white group inFigure 25, compared with that in Figure 24, the timing of the Kuznetscycles before 1925—29 is such that omission of the observations for"The decrease in fertility of foreign-born white women was perhaps the outstanding feature of the decline in the birth rate during the twenties" [205, p. 127].LEVEL AND RATE OF CRANDENCE: NATIVE WRITE POi'tFertihty ratio1,000900-Ratio scaleRurøl native white800700 —500 —'-.400-SOC885-8995-9905-09 6 change oer decodein fertility ratio 50 40 — 30— 20——Ruroirtotivewhite/0 09totoSouacE: Table C-6.
rIFIGURE 25LEVEL' AND RATE OF CHANCE OF FERTILITY RATIO BY RURAL-URBAN RESIDENCE: NATIVE WHITE POPULATION, 1885—1929; TOTAL WHITE POPULATION,1925—58smaller amplitude of itsant part of the movementIre (Table C-12).isis rate of decline in totalforeign- and native-bornFertility ratio-1,00c—-Ratio scale900800fertility ratio between theivever, the decline for thethe native—29 against 12in total white fertility700 Rural native whiteRural total white600(Table C-12)—was owinge foreign-born white pophe movement between thetility was nothing short of/%500 —w8ite400total white9 the foreign-born whitemore than double the885-8905-0995-99Vative White Populationsited, relating only to thestimates published by the5—9 through 1925—29 haveA constant 5 per cent adin of children under fivese no basis for a differenlable, and in part becausethe more reliable censuses:he pattern through 1925—ation by rural-urban resiout the picture since then,the total white populationms reasonable in view ofign-born in recent years.al native white group inthe timing of the Kuznetsof the observations fortowomen was perhaps the outig the twenties" [205, p. 127].95-99to05-09SoURcE: Table C-6.L151935-3945-4954-58
88 / II: FERTILITY ANALYSESthe first half of each decade tends to conceal the long swings. Nevertheless, some significant points stand out. As the upper panel shows,the decline from 1885—89 to 1925—29 in fertility of the total nativewhite population was significantly greater than that for either of thecomponents. This was caused by the depressing influence on totalnative white fertility of the continuous redistribution of populationfrom high-fertility rural to low-fertility urban areas. Quantitativelythis rural-urban shift accounted for about one-half of the total declineover the forty-year period (Table C-iS). The depressing effect onfertility was about the same in each successive decade.A second point of interest is the greater decline in rural thanurban fertility through 1925—29. The rural decline is about half againas great as the urban—18 as opposed to 12 per cent. Indeed, if oneconsiders the estimates for urban fertility from only 1895-99 to 1925—29, there is little evidence at all of a declining trend. The over-allreduction in these three decades is only 4 per cent, and the impressioncreated by the curve is one of general stability.This observation of substantial stability for a group accounting inthis period for a third to a half of white females of reproductive ageruns so counter to the common impression of a general and persistentsecular decline that it deserves further consideration. This is particu-larly true since this group has tended to assume an increasinglydominant role in determining the pattern for the total white populationand thus is of central significance for consideration 0f recent andprospective experience of the white population as a whole.' Couldthe finding be a statistical artifact resulting from deficiencies in ourestimating procedure? The possibility cannot be discounted—I haveattempted to make a reasonable estimate for 1895—99, but with moretime and larger resources it undoubtedly could be improved. However,even if we take only the more firmly based NRC estimates for 1905—9through 1925-29—at the expense unfortunately of reducing our spanof observation to two decades—there is still little evidence of a signifi-cant decline. In presenting these data the NRC does not call into10 Readers may be reminded in this connection of the finding in Dorothy S.Thomas' pioneering study of Sweden [1621 that during the nineteenth centuryshort-term fluctuations in fertility of the total population were initially dominatedby fluctuations in agriculture, but subsequently by those in industry.question the figures forare accorded hardly anregional fertility patternNRC does note that "thleveling off of birth raterate pattern" [205, p. iiSome additional hisstability is perhaps wort]a study of the fertilityEngland, in which he co:and 1915 no definite treip. 34]. For the period Istudy), he found anarea in the forefront oftion in which native whlong period stretchingappearance of a similardate would clearly beexperience.One final point shoiof total native white femore to a decrease in n1925—29, the reduction ithat for urban fertilitying of this perioddecline.SummaryWhile the fertilitytially from the latter pithere was significantamong componentas to eliminate or subscycle, marked fiuctuat11 A reexamination by Rsetts birth registration dataent evaluation from Spengi
p.,THE AMERICAN BABY BOOM / 89question the figures for urban native white population, though they1 the long swings. Nevers the upper panel shows,are accorded hardly any attention [205, p. 1271. With regard toregional fertility patterns of the total white population, however, theNRC does note that "these data show clearly a tendency toward theleveling off
THE AMERICAN BABY BOOM / 79 increase of the U.S. white 1870 to 1955. The familiar the recent increase are equally obtrusive, are sig-ge. The duration of the e years and their average arter of the mean rate of pter 2, the components of uctuations were identified igration was typically the up