Transcription
Session 13: Best Practices in Strategic Asset Allocation (SAA)SOA Antitrust DisclaimerSOA Presentation Disclaimer
Strategic AssetAllocation:Case StudyMay 2019
SAA Case Study– Overview Traditional SAA utilizes classic asset classes Equity Corporate Fixed Income High Yield Privates CML / Structured Assets /CMO, CMBS Esoteric / Alternative Case study on how we used SAA methodology in a less traditionalapproach to model a derivative solution for ALM gaps and incomeenhancement purposes1
SAA Case Study– Background & Considerations Classic SAA utilized as a tool for risk/reward balance – requires severalmodeling choices Highly dependent on assumptions scenarios, correlations, path assumptions, returns, reversions, riskmeasurements, Strategy Methodology Constant Allocation – “Set and Forget” Dynamic – “Active Management/Rule Based” Gap between model and execution Asset Liquidity and Supply Appropriate Asset Maturity Second Order Implications ALM consequences when maximizing risk/reward Duration Gaps – Roll Down of maturities, pre pays Required Capital, Accounting impacts2
SAA Case Study– Market Environment Steep Yield Curve Overall interest rates had been trending lower for several years Pre US Government debt downgrade – flight to quality mindset strong3
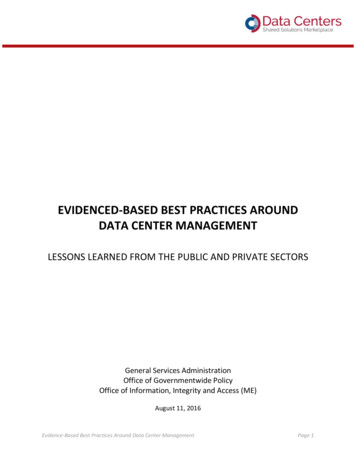
SAA Case Study– Unique Problem SetLiability Cash Flows800M700M600M500M400M300M200M 2010100MAnnuity portfolio with extreme long liabilitiesHighly competitive product pricingLarge reinvestment riskTraditional assets not long enough – reinvestment risk4
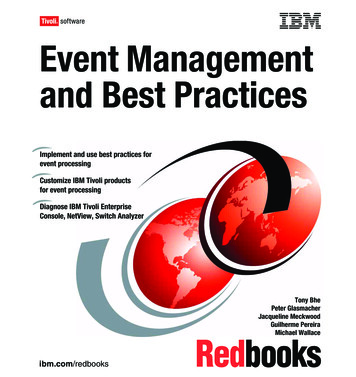
SAA Case Study– Asset vs. 000)15,000(10,000)10,000(15,000)5,0000Gap ( MIL)Asset / Liability ( MIL)35,000(20,000)1yr2yr3yrCurrent Assets ( MIL)5yr10yrCurrent Liabilities ( MIL)20yr30yr(25,000)Gap ( MIL) Asset maturity roll down Portfolio required re balance to address ALM gaps in intermediate yearsand long dated maturities5
SAA Case Study– Situation ReportSituation Long Duration Liabilities – Extremely long assets unavailable Competitive pricing pressure need for increased yield in a fairlycommoditized space with limited ability to increase market share ormargins Maturity roll down creating larger ALM gaps – more short asset thanliabilities, more long liabilities than assets Relatively small amount of asset turnover and new cash flow forinvestment Reinvestment Risk & Curve Flattening RiskObjective Minimize ALM Gaps & increase portfolio yield6
SAA Case Study– AlternativesEvaluate alternatives to increase portfolio yield while simultaneouslyimproving ALM gapBasic Choices Sell short assets and buy longer assets Some yield pick up, partially fill gaps, asset supply constraint Maximize long assets Some yield pick up, limited supply, doesn’t address short ALM gaps,limited cash flow for purchases Derivatives Yield pick up, addresses ALM gaps, no capital outlay, market valuevolatility7
SAA Case Study– Process Utilize Derivative solution for maximum customization Spot Swaps (Bull Flattener) primarily modeled – Rec Fixed Long, PayFixed Short, offsetting notional, long DV01 Model Scenarios for Market Value and Income (Risk/Return) of Derivativesolution Utilized 500 scenario analysis Model several different swap combinations (tenor and notional) Distribution of market value & income volatility across scenarios Analysis Organized results of 500 scenarios into 7 generic categories forpresentation purposes to senior management Solved for market value variance with a near constant income pickup8
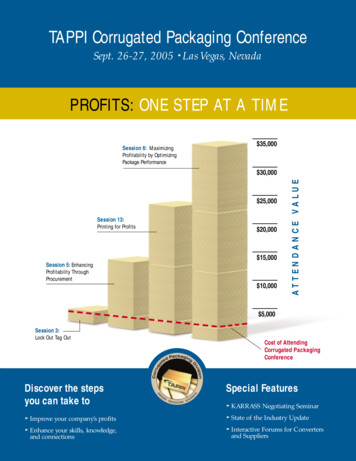
SAA Case Study– Risk / Reward ResultsScenario GroupCurrentProposedVarianceFlatten Short 25Bps(3.5)3.46.9Flatten Short 50Bps(6.8)6.713.5Steepen Long 100Bps(43.7)(46.1)(2.4)Parallel 50Bps(29.1)(25.2)3.9Parallel -50Bps24.729.54.8Parallel 100Bps(51.9)(46.8)5.1Parallel -100Bps56.363.87.5 Simplified categories made it easier to illustrate for business units andsenior management Categories tied in well with risk metrics business units use for impactprojections9
SAA Case Study– Risk / Reward ResultsExecution Combination of short pay fixed and receive fixed interest rate swaps Dynamic Program with rules for position rebalance based ALM and SAAquarterly analysis Monthly analysis and dashboard review of positions and relevant statisticsfor market value volatility, income and ALMImpact Portfolio yield enhancement Curve flatten and shift down ALM gap improvement Substantial increase in position market value10
SAA Case Study– Risk / Reward Results Significant parallel shift down within 3 months Yields continued to drop over following years and materially flatten11
Presentation Title Would Go Here2019 Life and Annuity SymposiumSession 13 - Best Practices in Strategic Asset AllocationAM Best New BCAR Impact on Portfolio OptimizationMark YuMay 20, 2019The material contained in this presentation has been prepared solely for informational purposes by New England Asset Management, Inc. (“NEAM, Inc.”) and/or New England Asset Management Limited (“NEAM Limited”) (collectively, “NEAM”) for theexclusive use of your company. The material is based on sources believed to be reliable and/or from proprietary data developed by NEAM, but we do not represent as to its accuracy or its completeness. This is not an offer to buy or sell any security orfinancial instrument. Certain assumptions, including tax assumptions, may have been made which have resulted in any returns detailed herein. Changes to the assumptions, including valuations or cash flows of any instrument, may have a material impact onany results. Please consult with your tax experts before relying on this material. Past performance results are not necessarily indicative of future performance. This document and its contents are proprietary to NEAM and are not to be given or discussed withanyone other than employees, directors, trustees or auditors of your company without our prior written consent. NEAM Limited is a subsidiary of NEAM, Inc. NEAM Limited is regulated by the Central Bank of Ireland. NEAM Limited is authorized by theCentral Bank of Ireland and subject to limited regulation by the Financial Conduct Authority. Additional information, including details about the extent of our regulation by the Financial Conduct Authority are available from us on request. NEAM Limited is notregistered with the SEC. Because this is intended to be an overview please note that some services described in this presentation may not be available to all clients in certain jurisdictions.Proprietary & Confidential 2019 New England Asset Management, Inc.
Topics Life Industry Investment Trends Portfolio Optimization: Enterprise Based Asset Allocation (EBAA ) EBAA Case Study – New BCAR Impact on Asset AllocationProprietary & Confidential 2019 New England Asset Management, Inc. 1
Life Industry Investment Trends
Life Industry Broad Sector Asset Allocation Trends Broad sector allocations largely unchanged Decreased bond allocation replaced by mortgage loans and Sch. 4.8%10.9%70%Derivatives60%Contract Loans50%Real EstateOther 5.3%75.8%Cash/Short Terms74.5%71.1%30%Mortgage LoansBonds20%10%0%2017Source: NEAM Analytics, SNL20162015201420132012201120102009Proprietary & Confidential2008 2019 New England Asset Management, Inc. 3
Life Industry Fixed Income Sector Allocations Reduced structured securities allocation replaced by increased Corporates,Municipals and Privates allocations Within structured securities, ABS trended up while RMBS CMBS trended downSectorGov't/AgcyCorpABSRMBS - AgcyRMBS - Non AgcyCMBS - AgcyCMBS - Non AgcyMunis - TaxableMunis - Tax ExemptPrivatesForeignOtherGrand TotalRMBS 1.8%29.7%Source: NEAM Analytics, SNLProprietary & Confidential 2019 New England Asset Management, Inc. 4
Life Industry Fixed Income Book Yield by Sector / Rating Book yields continued to decline; 154 bps reduction over the past 10 yearsSectorGov't/AgcyCorpABSRMBS - AgcyRMBS - Non AgcyCMBS - AgcyCMBS - Non AgcyMunis - TaxableMunis - Tax ExemptPrivatesForeignGrand TotalRatingAAA/AAABBB BBBTotal (exclude .345.926.277.615.85Source: NEAM Analytics, SNLProprietary & Confidential 2019 New England Asset Management, Inc. 5
Life Industry Fixed Income Allocation by Credit Rating Credit risk taking continued; BBB allocation continued to 24.9%24.7%23.7%24.4%24.0%21.9%21.4%21.1%70%60%NA 19.8%10%0%AAAA30%20%20.5%10.2%11.7%20122011Source: NEAM Analytics, SNLProprietary & Confidential 2019 New England Asset Management, Inc. 6
Life Industry Fixed Income Duration by Sector / Rating Duration extension continued; OAD extended by 1.5 years over the last 10 yearsSectorGov't/AgcyCorpABSRMBS - AgcyRMBS - Non AgcyCMBS - AgcyCMBS - Non AgcyMunis - TaxableMunis - Tax ExemptForeignIndustry AAA/AAABBB BBBTotal (exclude NonRated)Source: NEAM Analytics, SNLProprietary & Confidential 2019 New England Asset Management, Inc. 7
Portfolio Optimization: EnterpriseBased Asset Allocation (EBAA )
Enterprise Based Asset Allocation (EBAA ) ProcessWhat is it?Investment portfolio optimization within an enterprise framework Considers liability profile and cash flow sensitivity Enables holistic economic, rating agency and regulatory impact assessmentHow Does it Work?InputClient Operating Information Product segment cash flows forecast Additional financial statementinformation OutputEvaluationRecommendations for:Iterative ProcessStressTesting EfficientFrontierAsset AllocationsInvestment GuidelinesBenchmarksNEAM Provided Information Prospective investment returnsand volatility Additional return and risk metricsRegulator &Rating AgencyCapital ImpactMacro & MicroReturn & RiskMacro & MicroReturn & RiskWhat’s the Potential Benefit?Enhanced Risk-Adjusted Return ProfileProprietary & Confidential 2019 New England Asset Management, Inc. 9
Recent PublicationsProprietary & Confidential 2019 New England Asset Management, Inc. 10
EBAA Case Study – New BCARImpact on Asset Allocation
Compare and Contrast: New BCAR 95 vs. Old BCAROld BCARNew BCAR - VaR 95Ratingaaaaa aaaaa aabbb bbbbbbbb bbbbb to bccc to ccccc to cdEquity1 .16%1.89%2.21%4.35%6.52%24.38%28.45%32.51%2 .29%3.65%4.24%8.14%11.91%37.13%43.32%49.51%3 .20%5.15%5.94%11.12%16.32%43.41%50.64%57.87%4 .95%6.43%7.36%13.47%19.90%46.09%53.77%61.45%5 Year6 .77%46.77%54.56%54.56%62.36%62.36%25.00%7 .25%9.03%10.22%17.46%26.48%46.77%54.56%62.36%8 Year9 11.18%18.46%28.45%46.77%54.56%62.36%10 2.5%6.0%12.0%25.0%30.0%30.0%Most new risk charges are higher than the old risk charges (108 out of 171)Source: Understanding BCAR for U.S. and Canadian Life/Health Insurers - October 13, 2017Proprietary & Confidential 2019 New England Asset Management, Inc. 12
Compare and Contrast: New BCAR 99.6 vs. Old BCAROld BCARNew BCAR - VaR 99.6Ratingaaaaa aaaaa aabbb bbbbbbbb bbbbb to bccc to ccccc to cdEquity1 .62%2.47%2.82%5.10%7.43%25.46%29.70%33.94%2 .19%4.76%5.40%9.48%13.44%38.31%44.69%51.08%3 .42%6.67%7.52%12.89%18.29%44.42%51.82%59.23%4 .40%8.26%9.28%15.50%22.13%46.84%54.64%62.45%5 Year6 .67%9.51%10.53%10.65% 11.73%17.51% 18.82%25.09% 27.25%47.30% 47.30%55.18% 55.18%63.06% 63.06%44.00%7 .02%11.23%12.50%19.66%28.79%47.30%55.18%63.06%8 Year9 4%13.51%20.56%30.61%47.30%55.18%63.06%10 2.5%6.0%12.0%25.0%30.0%30.0%Most new risk charges are higher than the old risk charges (131 out of 171)Source: Understanding BCAR for U.S. and Canadian Life/Health Insurers - October 13, 2017Proprietary & Confidential 2019 New England Asset Management, Inc. 13
Portfolio OptimizationFramework and Assumptions Enterprise Based Asset Allocation* with U.S. life industry 2017 year end reported statutoryfinancials, investment holdings, and generic product and liability assumptionsSources of Enterprise Return and RiskSteps:1. Objective: maximize book yield (income return) while maintaining initial BCAR C1 charges2. Optimize asset portfolio under old and new BCAR C1 charges (95 and 99.6 confidencelevel) separately3. Assess the impact of new BCAR 95 and 99.6 C1 charges on optimizations4. Assess the impact of duration constraint on optimizations5. Identify key directional differences between optimized allocations based on old and newBCAR C1 charges*Refer to NEAM’s June 2016 Perspectives - Life Insurer Asset Optimization: A Top-Down Enterprise ApproachProprietary & Confidential 2019 New England Asset Management, Inc. 14
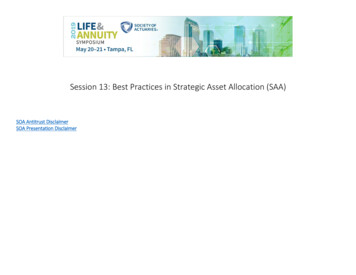
Book Yield Maximization: Old vs. New (1/2)Efficient frontierunder old BCAREfficient frontierunder new BCAR 99.6Efficient frontierunder new BCAR 95Current PortfolioResultsEnterprise StatisticsCurrentOld BCARMaxim ize BYTotal Return on EquityEarnings Risk (Std Dev)95.00 VAR % CapitalTotal Return on AssetsInvestment LeverageProduct LeverageProduct .5(4.1)BCAR C1( ) OldBCAR C1( ) New 95BCAR C1( ) New 99.6Book YieldMarket Yield (OAY)Duration (OAD)1411892764.403.527.1141Add. Return/Risk Metrics4.864.399.8New BCAR 95Maxim ize BY13.624.537.35.09.68.5(4.1)1894.824.209.4New BCAR 99.6Maxim ize BY13.323.034.75.09.68.5(4.1)2764.794.108.8Book income maximization with BCAR C1 maintained at initial levels: New BCAR C1 more restrictive than old BCAR C1 99.6 BCAR more restrictive than 95 BCAR Maximized book yield: 4.86 ( old) vs. 4.82 ( BCAR 95) vs. 4.79 ( BCAR 99.6)Source: NEAMFigures are for illustrative purposes only.Proprietary & Confidential 2019 New England Asset Management, Inc. 15
Book Yield Maximization: BCAR 95 vs. BCAR 99.6 (2/2)Efficient frontierunder old BCAREfficient frontierunder new BCAR 99.6Efficient frontierunder new BCAR 95Current PortfolioResultsEnterprise Statisticsduration than Orange dot portfolio; similaraverage credit rating (& default loss) butdifferent letter rating distribution Orange dot (BCAR 99.6) portfolio hasoverweight in structured securities andunderweight in IG corporate bonds relative toGreen dot portfolioSource: NEAMFigures are for illustrative purposes only.Old BCARMaxim ize BYNew BCAR 95Maxim ize BYNew BCAR 99.6Maxim ize BYTotal Return on EquityEarnings Risk (Std Dev)95.00 VAR % Capital9.820.632.514.025.539.0BCAR C1( ) OldBCAR C1( ) New 95BCAR C1( ) New 99.6Book YieldMarket Yield (OAY)Duration (OAD)Default Loss ( .46.22764.794.108.86.2Average RatingAAAAAABBB (%) BBB (%)Non-FI 44.23.66.3100.0Short TermUS Govt AgncyPublic InvGrd CreditMuni - Tax ExemptPrivate PlacementHigh YieldStructured Sec.Comml MortgageBank 02.72.650.50.011.42.710.912.50.01.35.3100.0Add. Return/Risk MetricsQuality Distribution Green dot (BCAR 95) portfolio has a longerCurrentSector DistributionProprietary & Confidential 13.624.537.318913.323.034.7 2019 New England Asset Management, Inc. 16
Book Yield Maximization: Targeting a Relative Book Yield of 4.79%Efficient frontierunder old BCARCurrentEfficient frontierunder new BCAR 99.6Efficient frontierunder new BCAR 95Enterprise StatisticsTotal Return on EquityEarnings Risk (Std Dev)95.00 VAR % CapitalAdd. Return/Risk MetricsCurrent PortfolioBCAR C1( ) OldBCAR C1( ) New 95BCAR C1( ) New 99.6Book YieldMarket Yield (OAY)Duration (OAD)Default Loss ( )exhibit longer OAD and higher credit qualitythan old BCAR optimized portfolio New BCAR (95 & 99.6) favors more structuredsecurities and less IG corporate and HY thanold BCAR Among new BCAR optimized portfolios, BCAR99.6 portfolio has higher credit quality thanBCAR 95 portfolioSource: NEAMFigures are for illustrative purposes only.9.820.632.513.318.125.2New BCAR 95Maxim ize BY13.319.427.7New BCAR 99.6Maxim ize 14.794.108.36.62764.794.108.86.2Average RatingAAAAAABBB (%) BBB (%)Non-FI 44.23.66.3100.0Short TermUS Govt AgncyPublic InvGrd CreditMuni - Tax ExemptPrivate PlacementHigh YieldStructured Sec.Comml MortgageBank 02.72.650.50.011.42.710.912.50.01.35.3100.0Quality Distribution New BCAR (95 & 99.6) optimized portfoliosOld BCARMaxim ize BYSector DistributionProprietary & Confidential141 189 2019 New England Asset Management, Inc. 17
Book Yield Maximization with Constant DurationEfficient frontier under new BCAR 95Efficient frontier under old BCAREfficient frontier under new BCAR 99.6Current PortfolioResultsEnterprise Statisticsefficient frontiers overlap; similar maximizedbook yields: 4.74% vs. 4.76% vs. 4.74% Optimized portfolios under new BCARs showlower expected losses (7.5 vs 8.5); newBCARs favor AAA and BBB over A thanold BCAR New BCARs favor structured securities overIG corporate and HY than old BCARSource: NEAMFigures are for illustrative purposes only.Old BCARMaxim ize BYNew BCAR 95Maxim ize BY9.820.632.512.921.832.5BCAR C1( ) OldBCAR C1( ) New 95BCAR C1( ) New 99.6Book YieldMarket Yield (OAY)Duration (OAD)Default Loss ( .17.52764.744.007.17.5Average RatingAAAAAABBB (%) BBB (%)Non-FI 17.544.74.06.3100.0Short TermUS Govt AgncyPublic InvGrd CreditMuni - Tax ExemptPrivate PlacementHigh YieldStructured Sec.Comml MortgageBank .02.72.743.00.111.43.017.912.50.01.35.3100.0Add. Return/Risk MetricsSector DistributionProprietary & Confidential 13.021.331.5New BCAR 99.6Maxim ize BYTotal Return on EquityEarnings Risk (Std Dev)95.00 VAR % CapitalQuality Distribution Old (Blue) and new (Green and Orange)Current18912.820.630.3 2019 New England Asset Management, Inc. 18
Key Takeaways – New BCAR Impact on Asset Optimization New BCARs, which vary C1 capital charges by letter credit rating and maturity,produce more restrictive efficient frontiers than the old BCARs. New BCARs produce optimized portfolios with shorter duration and lower defaultloss than old BCARs; 99.6 factors result in optimized portfolios with lower defaultlosses than 95 factors. Portfolio optimizations under new BCAR will favor structured securities as thesetend to have high credit qualities and short durations. Portfolio optimization needs to evaluate the “risk-adjusted returns” of variousasset classes along with their respective BCAR charges. Use of marked-tomarket metrics (Value at Risk or VaR) may result in different optimizationoutcomes.Proprietary & Confidential 2019 New England Asset Management, Inc. 19
Q&AMark M. Yu, CFA, FSA, FRM, MAAAMark is an Enterprise Capital Return & Risk Management Professional at NEAM, Inc. focusing on thecapital management and corporate development activities for U.S. insurance companies. He joined theFirm in 2012 having been a Senior Risk Manager within the Governance and Strategy team at AIGEnterprise Risk Management. Prior to working at AIG ERM, he was a Senior Vice President andTreasury Director within the Group’s Capital Management division of Swiss Re. Mark holds a Bachelor ofArts from National Tsing Hua University in Taiwan, an M.S. from the University of Iowa, is a Fellow of theSociety of Actuaries, a CFA Charter holder, a Financial Risk Manager, and is a Member of the AmericanAcademy of Actuaries. He has been employed in the insurance or investment industry since 1999.mark.yu@neamgroup.com860.676.8722Proprietary & Confidential 2019 New England Asset Management, Inc. 20
Thank You
Session 13: Best Practices in Strategic Asset Allocation (SAA) SOA Antitrust Disclaimer SOA Presentation Disclaimer . Strategic Asset Allocation: Case Study May 2019. SAA Case Study– Overview Traditional SAA uti