Transcription
Medical diagnostic ultrasound- physical principles and imagingBy Jens E. Wilhjelm, Andreas Illum, Martin Kristensson and Ole Trier AndersenBiomedical Engineering, DTU ElektroTechnical University of Denmark(Ver. 3.1, 5 December 2016) 2001-2013 by J. E. WilhjelmPrefaceThis document attempts to introduce the physical principles of medical diagnostic ultrasound to abroad audience ranging from non-engineering students to graduate level students in engineering andscience. This is sought achieved by providing chapters with different levels of difficulty:Chapters with no asterisk can be read by most.* These chapters are directed towards bachelor students in engineering.** These chapters are directed towards graduate students in engineering.The document can be studied at a given degree of detail without loss of continuation.To help understanding, a number of Flash animations and quizzes are included. Inorder for these to work, the computer used for viewing this document must have oneof the newest Flash players installed (www.adobe.com). The version of the current Flash player iswritten in the box to the right. If no version number appear at all, you must update Flash.If viewing this text in a browser, please use one that supports Adobe pdf-files with embedded Flashsuch as e.g., Internet explorer or Mozilla Firefox. Also note that internet access might be required forsome animations to work. Please also note that if you start an animation and then move onto anotherpage, the animation might still run in the background slowing the computer.This document contains a number of quizzes that will pop up in individual windows when activatedby the reader. If the window appears difficult to read, do this: right click on the quiz icon and enterthe window size (written in parenthesis after the quiz) in the window that appear and set “Play backstyle” to “Play content in floating window”. If it is necessary to move the quiz window, drag the window at the black frame.This chapter does not consider blood flow imaging with ultrasound, which is treated excellently elsewhere[5].1 IntroductionMedical diagnostic ultrasound is an imaging modality that makes images showing a slice of the body,so-called tomographic images (tomo Gr. tome, to cut and graphic Gr. graphein, to write). It is adiagnostic modality, meaning that it gathers information about the biological medium without modification of any kind1.BMEDTU Elektro1/21
Ultrasound is sound with a frequency above the audible range which ranges from 20 Hz to 20 kHz.Sound is mechanical energy that needs a medium to propagate. Thus, in contrast to electromagneticwaves, it cannot travel in vacuum.The frequencies normally applied in clinical imaging lies between 1 MHz and 20 MHz. The soundis generated by a transducer that first acts as a loudspeaker sending out an acoustic pulse along a narrow beam in a given direction. The transducer subsequently acts as a microphone in order to recordthe acoustic echoes generated by the tissue along the path of the emitted pulse. These echoes thus carry information about the acoustic properties of the tissue along the path. The emission of acoustic energy and the recording of the echoes normally take place at the same transducer, in contrast to CTimaging, where the emitter (the X-ray tube) and recorder (the detectors) are located on the oppositeside of the patient.This document attempts to give simple insight in to basic ultrasound, simple wave equations, somesimple wave types and generation and reception of ultrasound. This is followed by a description ofultrasound’s interaction with the medium, which gives rise to the echo information that is used tomake images. The different kinds of imaging modalities is next presented, finalized with a descriptionof more advanced techniques. The chapter is concluded with a list of symbols, terms and references.2 Basics of ultrasoundUltrasound (as well as sound) needs a medium, in which it can propagate by means of local deformation of the medium. One can think of the medium as being made of small spheres (e.g. atoms ormolecules), that are connected with springs. When mechanical energy is transmitted through such amedium, the spheres will oscillate around their resting position. Thus, the propagation of sound is dueto a continuous interchange between kinetic energy and potential energy, related to the density andthe elastic properties of the medium, respectively.The two simplest waves that can exist in solids are longitudinal waves in which the particle movements occur in the same direction as the propagation (or energy flow), and transversal (or shearwaves) in which the movements occur in a plane perpendicular to the propagation direction. In waterand soft tissue the waves are mainly longitudinal. The frequency, f, of the particle oscillation is relatedto the wavelength, λ, and the propagation velocity c:λf c(1)The sound speed in soft tissue at 37 C is around 1540 m/s, thus at a frequency of 7.5 MHz, the wavelength is 0.2 mm.2.1 The 1D wave equation*Describing the wave propagation in 3D space in a lossy inhomogeneous medium ((Danish: et inhomogent medium med tab) such as living tissue is very complicated. However, the description in 1Dfor a homogenous lossless medium is relatively simple as will be shown.An acoustic wave is normally characterized by its pressure. Thus, in order to obtain a quantitativerelation between the particle velocity in the medium, u, and the acoustic pressure, p, a simple situation1. To obtain acoustical contact between the transducer and the skin, a small pressure must be applied from thetransducer to the skin. In addition to that, ultrasound scanning causes a very small heating of tissue (less than1 C) and some studies have demonstrated cellular effects under special circumstances.BMEDTU Elektro2/21
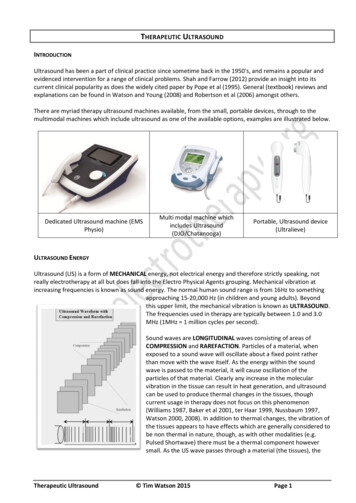
pp ΔpuAxu Δux ΔxFigure 1 1D situation showing a liquid element inside a sound wave.with 1D propagation in a lossless media will be considered, as shown in Figure 1. This figure showsa volume element of length Δx and with cross-sectional area A. The volume is thus V AΔx. The density of the medium - a liquid, for instance, - is ρ and the mass of the element will then be ρAΔx.The pressure p is a function of both x and t. Consider the variation in space first: There will be a pressure difference, Δp, from the front surface at x to the back surface at x Δx, thus the volume elementwill be subject to a force –AΔp. By applying Newton’s second law (F ma):du– AΔp ρAΔx -----dt(2)or after performing the limit (Δ d)dudp------ – ρ -----(3)dtdxNext consider the variations over a time interval Δt. A difference in velocity, Δu, between the frontsurface (at x) and the back surface (at x Δx) of the elemental volume will result in a change in thatvolume which is:ΔV A ( ( u Δu )Δt – uΔt ) AΔuΔt(4)which in turn is connected with a change in pressure, Δp, according toΔV – κ ( AΔx ) Δp(5)where κ is the compressibility of the material (e.g. a liquid) in units of Pa-1. Performing the same limitas above, gives the second equation:dpdu------ – κ -----(6)dtdxEquations (3) and (6) are the simplest form of the wave equations describing the relation betweenpressure and particle velocity in a lossless isotropic medium.BMEDTU Elektro3/21
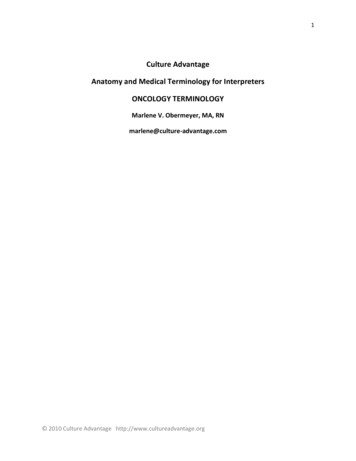
3 Types of ultrasound wavesThe equations above describe the relation between pressure and displacement of the elements of themedium. Two simple waves fulfilling the above will now be considered. Both are theoretical, sincethey need an infinitely large medium.Since optical rays can be visualized directly, and since they behave in a manner somewhat similar toacoustic waves, they can help in understanding reflection, scattering and other phenomena takingplace with acoustic waves. Therefore, there will often be made references to optics.There are two types of waves that are relevant. They can both be visualized in 2D with a square acrylic water tank placed on an overhead projector: The plane wave which can be observed by shortly lifting one side of the container. The spherical wave, which can be visualized by letting a drop of water fall into the surface ofthe water.When the plane wave is created at one side of the water tank, one will also be able to observe thereflection from the other side of the tank. The wave is reflected exactly as a light beam from a mirroror a billiard ball bouncing off the barrier of the table.The spherical wave, that on the other hand, originates from a point source and propagates in all directions; it creates a complex pattern when reflected from the four sides of the tank.3.1 The plane wave*The plane wave is propagating in one direction in space; in a plane perpendicular to this direction,the pressure (and all other acoustic parameters) is constant. As a plane extends over the entire space,it is not physically realizable (but within a given space, an approximation to a plane wave can be obtained locally, such as in the shadow of a planar transducer (see later)).(a)(b)Figure 2 Dynamic visualization of plane wave (a) and spherical wave (b) pressure fields. The pressurefields are monochromatic, i.e., contains only one frequency. Pure black indicates zero pressure, red indicates positive and blue negative pressure values. The wavelength can be read directly from the plots. Whenincluding the propagation velocity, c 1500 m/s, the frequency of the wave can also be found.BMEDTU Elektro4/21
If the plane wave is further restricted to be monochromatic, that is, it oscillate at a single frequency,f0, then the wave equation in 1D is:p(x,t) P0 exp(–j (2πf0t – 2πx/λ))(7)where P0 is the pressure magnitude (units in pascal, Pa) x is the distance along the propagation direction and λ c/f0. (7) is a complex sinusoid that depends on space and time. The equation will be thesame in 3D, provided that the coordinate system is oriented with the x-axis in the propagation direction. The plane wave travelling in the x-direction is sought illustrated by the pressure animation in Figure 2a.A plane wave thus propagates in one direction, just like a laser beam, however, it is merely the opposite of a beam.Quiz 1(Open in floating window of size 800 x 1100)3.2 The spherical wave*The other type is a spherical wave. It originates from a point (source) and all acoustic parametersare constant at spheres centred on this point. Thus, the equation is the same as in (7), except that thex is substituted with r in a polar coordinate system:p(r,t) P0 exp(–j (2πf0t – 2πr/λ))(8)where r is the distance from the centre of the coordinate system (i.e., the source) to any point in 3Dspace. The spherical wave are sought illustrated by the pressure animation in Figure 2b.Problem 1 With the animations in Figure 2, measure the wavelength and calculate the centre frequency of the waves.Problem 2 There are a few aspects of Figure 2, that were too difficult to visualize correctly, whenusing Flash as the programming tool. Which?3.3 Diffraction**An important concept in wave theory is diffraction. Ironically, the term diffraction can best be described by what it is not: “Any propagating scalar field which experiences a deviation from a rectilinear propagation path, when such deviation is not due to reflection or refraction (see later), is generallysaid to undergo diffraction effects. This description includes the bending of waves around objects intheir path. This bending is brought about by the redistribution of energy within the wave front as itpasses by an opaque body.”[3] Examples where diffraction effects are significant are: Propagation ofwaves through an aperture in a baffle (i.e. a hole in a plate) and radiation from sources of finite size.[3]With the above definition, the only non-diffracted wave is the plane wave.4 The generation of ultrasoundThe ultrasonic transducer is the one responsible for generating ultrasound and recording the echoesgenerated by the medium. Since the transducer should make mechanical vibrations in the megahertzrange, a material that can vibrate that fast is needed. Piezoelectric materials are ideal for this.BMEDTU Elektro5/21
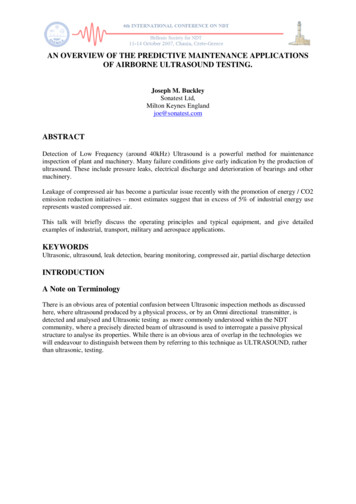
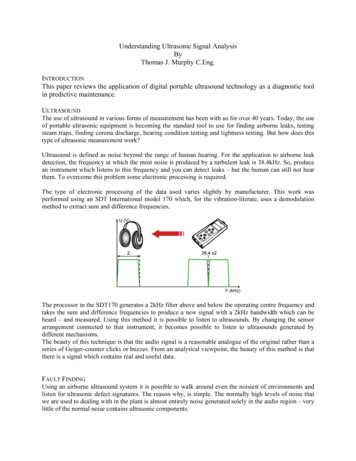
Figure 3 Example of modern ultrasound transducer of type 8820e (BK Medical,Denmark) with frequency range 2 - 6 MHz. From www.bkmed.com.The typical transducer consist of a disk-shaped piezoelectric element that is made vibrating by applying an electrical impulse via an electrode on each side of the disc. Likewise, the echo returning tothe disk makes it vibrate, creating a small electrical potential across the same two electrodes that canbe amplified and recorded. In modern clinical scanners, the transducer consists of hundreds of smallpiezoelectric elements arranged as a 1D array packed into a small enclosure. The shape of this linecan be either linear or convex. An example of the latter can be seen in Figure 3. The use of arrays withhundreds of elements, makes it possible to electronically focus and steer the beam, as will be considered later in Chapter 7. However, first the single-element transducer will be considered.4.1 PiezoelectricityThe acoustic field is generated by using the piezo electric effect present in certain ceramic materials.Electrodes (e.g. thin layers of silver) are placed on both sides of a disk of such a material. One side ofthe disk is fixed to a damping so-called backing material, the other side can move freely. If a voltageis applied to the two electrodes, the result will be a physical deformation of the crystal surface, whichwill make the surroundings in front of the crystal vibrate and thus generate a sound field. If the material is compressed or expanded, as will be the case when an acoustic wave impinges on the surface,the displacement of charge inside the material will cause a voltage change on the electrodes, as illustrated in Figure 4 (left). This is used for emission and reception of acoustic energy, respectively.BackingCrystal λ/4 matching layer andwear plateShadow region2aAcoustic axisHousingg(t)Figure 4 Left: Piezo electric crystal at different states of compression. Right: Single element transducerconsisting of piezoelectric crystal with electrodes. This “sandwich” is placed between a backing materialand the matching layer towards the medium.BMEDTU Elektro6/21
4.2 The acoustic field from a disk transducer*Since the ultrasound transducer - or the piezoelectric crystal - has a size comparable to or larger thanthe wavelength, the field generated becomes very complex. Rather than providing equations for describing the field, it will now be attempted visualised.It is assumed that the piezoelectric, disk-shaped crystal is fixed at the back, as illustrated in Figure 4(right) and can move freely at the front. Specifically, movement of the surface of the transducer canbe described by a velocity vector oriented perpendicular to the surface. In short, the electrical signalapplied to the transducer is converted by the electro-mechanical transfer function of the transducer toa velocity function describing the movement of the transducer surface. Note the backing material located behind the crystal; this is used to dampen the free oscillation of the crystal (in the time periodjust after a voltage is applied), thereby creating a short vibration, when an impulse is applied to thecrystal. The radius of the crystal is denoted a. The thickness of the crystal is selected according to thefrequency of operation, so that it is λpiezo/2, where λpiezo is the wavelength of sound in the crystal material.In order to assess the pressure field generated by the transducer, the surface of the crystal will bedivided up into many small surface elements, each contributing to the entire pressure field. If the surface elements are much smaller than the wavelength, they can be considered point sources. In thepresent case, the point source will generate a semi-spherical wave in the space in front of the transducer. The waves are identical, the only difference is the location of the point source. At a given fieldpoint in front of the transducer, the total pressure will then be the pressure due to the individual pointsources. This is an application of Huygens1 principle. Of course, these individual pressure contributions will interfere positively and negatively dependent on the location of the field point. This interference will result in the final beam, which can be rather complex.Rather than doing this calculation analytically, a graphical illustration is provided in Figure 5 whichshows point sources along a diameter of the transducer disk (the remaining point sources on the disksurfaces are ignored for simplicity). For each point source, a bow shows the location of the equalphase-fronts (or equal-time-lag) of the spherical pressure wave generated from that source at giveninstances in time. The equal-phase-fronts are not the same as the pressure field; the latter can be created by adding the pressure fields of each individual source time-shifted according to the equal-timelag. Hence, the moving bows in Figure 5 reveal how complicated the field is at a given point.The “wave” fronts generated by the flat piston transducer in Figure 5 (left) tend towards a (locally)plane wave inside the shadow of the transducer. The pressure field is thus broad, and unsuitable forimaging purposes, as will become clear, when the imaging technique is considered later. In order tofocus the ultrasound field and obtain a situation where the acoustic energy travels along a narrow path,a focused transducer is used, as illustrated in Figure 5 (right). In this situation, the individual sphericalwaves from the transducer are performing constructive interference at the focal point, whereas at allother points, the interference is more or less destructive. In order to make this work efficiently, thewavelength must be much smaller than the distance to the focal point. However, a typical depth of thefocal point for a 7.5 MHz transducer - 20 mm - will correspond to 100λ.Notice here, that the key to understand this is the fact that it takes a different amount of time to travelto a given field point from two different source locations. The interference that is caused by this isquite unique for ultrasound.1. Christian Huygens, physicist from the Netherlands, 1629-95.BMEDTU Elektro7/21
Example: The interference phenomena can be explored in everyday life: if one positions oneself withone ear pointing into a loudspeaker and turns up the treble, then the sound picture will change if youmove in front of the loudspeaker, especially when moving perpendicular to the loudspeaker’s acousticaxis. What happens is that the ear is moved to different points in space, which exhibits differentamounts of constructive and destructive interference. This phenomenon is less distinct at low frequencies (bass), because the wavelength gets larger. This is also the reason that a stereo sound system cando with one subwoofer for the very low frequency band, but needs two loudspeakers for the remaininghigher frequencies.As noted above, dimensions give most insight, when they are measured in wavelength. Consider theplanar transducer in Figure 5 (left): The near field from this type of transducer is defined[4] as the region between the transducer and up to a range of a2/λ. The far field region corresponds to field pointsat ranges much larger than a2/λ. In Figure 5 (left), a is specified, but λ is not. If the transducer frequency is f0 0.5 MHz, then a2/λ 33 mm, which is in the middle of the plot. If f0 7.5 MHz, thena2/λ 0.5 m! The explanation is as follows: The far field is defined as the region, where there is onlymoderate to little destructive interference. If this should be possible, then from a given field point inthis region, the distance to any point on the transducer surface should vary much less than a wavelength: Consider a given field point not on the acoustic axis. Next, draw two lines to the two oppositeedges of the transducer. Now the difference in length of these two lines - measured in wavelength must be much less than one, in order to have little destructive interference at this field point. Thus, thehigher the frequency, the lower the wavelength, and the farther away one must move from the transducer surface in order to get differences between the length of the two lines much less than one wavelength.An ultrasound field from a physical transducer will always show a complicated behaviour as can besensed from Figure 5. Each point source is assumed to emit exactly the same pressure wave (an example of the temporal shape is given in Figure 8). Thus, the circles in the animation in Figure 5 indicate spatial and temporal locations of each of the individual waveforms. The contribution of all thesewaveforms would have to be added in order to construct the total pressure field in front of the transducer (however, the circles in Figure 5 only represent point sources on a single diameter across thetransducer; many more point sources would be needed to represent the total field from a disk transducer).Figure 5 Left: Example of moving circles showing “wave fronts” of equal phase (or equal travel time)at as a function of time from selected point sources ( red dots). For simplicity, only point sources locatedon a diameter are shown, making this drawing two dimensional. Right: The same for a focused transducer.c 1500 m/s. The radius of curvature of the disk surface can be deducted from this Figure. What is it?BMEDTU Elektro8/21
Problem 3 Huygens’ principle. How would you find - or calculate - how many point sources are needed on the transducer surface in Figure 5 in order to represent the pressure field in front of the transducer with a given accuracy?Problem 4 Write a short summary of this chapter.5 Ultrasound’s interaction with the mediumThe interaction between the medium and the ultrasound emitted into the medium can be describedby the following phenomena:The echoes that travel back to the transducer and thus give information about the medium is due totwo phenomena: reflection and scattering. Reflection can be thought of as when a billiard ball bounces off the barrier of the table, where the angle of reflection is identical to the angle of incidence. Scattering (Danish: spredning) can be thought of, when one shines strong light on the tip of a needle: lightis scattered in all directions. In acoustics, reflection and scattering is taking place when the emittedpulse is travelling through the interface between two media of different acoustic properties, as whenhitting the interface of an object with different acoustic properties.Specifically, reflection is taking place when the interface is large relative to the wavelength (e.g. between blood and intima in a large vessel). Scattering is taking place when the interface is small relativeto the wavelength (e.g. red blood cell).The abstraction of a billiard ball is not complete, however: In medical ultrasound, when reflection istaking place, typically only a (small) part of the wave is reflected. The remaining part is transmittedthrough the interface. This transmitted wave will nearly always be refracted, thus typically propagating in another direction. The only exception is when the wave impinges perpendicular on a large planar interface: The reflected part of the wave is reflected back in exactly the same direction as it camefrom (like with a billiard ball) and the refracted wave propagates in the same way as the incident wave.Reflection and scattering can happen at the same time, for instance, if the larger planar interface isrough. The more smooth, the more it resembles pure reflection (if it is completely smooth, specularreflection takes place). The rougher, the more it resembles scattering.When the emitted pulse travels through the medium, some of the acoustic (mechanical) energy isconverted to heat by a process called Absorption. Of course, also the echoes undergo absorption.Finally, the loss in intensity of the forward propagating acoustic pulse due to reflection, refraction,scattering and absorption is under one named attenuation.5.1 Reflection and transmission*When a plane wave impinges on a plane, infinitely large, interface between two media of differentacoustic properties, reflection and refraction occurs meaning that part of the wave is reflected and partof the wave is refracted. The wave thus continues its propagation, but in a new direction.To describe this quantitatively, the specific acoustic impedance, z, is introduced. In a homogeneousmedium it is defined as the ratio of pressure to particle velocity in a progressing plane wave, and canbe shown to be the product of the physical density, ρ, and acoustic propagation velocity c of the medium. Thus, if medium 1 is specified in terms of its physical density, ρ1, and acoustic propagation velocity c1, the specific acoustic impedance for this medium is z1 ρ1c1. The units become kg/(m2s)which is also denoted rayl. Likewise for medium 2: z2 ρ2c2. The interaction of ultrasound with thisBMEDTU Elektro9/21
interface can be illustrated by use of Figure 6, where an incident plane wave is reflected and transmitted at the interface between medium 1 and medium 2. The (pressure) reflection coefficient betweenthe two media is:[2]z 2 ( cos θ t ) – z 1 ( cos θ i )R ---------(9)z 2 ( cos θ t ) z 1 ( cos θ i )where the angle of incidence, θi, and transmission, θt, are related to the propagation velocities assin θc------------i ----1- .(10)sin θ tc2Equation (10) is a statement of Snell’s law,[2] which also states that: θr θi. The pressure transmissioncoefficient is T 1 R.It should be noted here, that Snell’s law applies to optics, where the light can be considered to travelin rays. For a planar wave in acoustics, which only have one direction, the above formulation ofSnell’s law applies as well. However, when the acoustic wave travels like a beam, Snell’s law is onlyapproximately valid. The validity is related to the properties of the beam, namely to which degree thewave field inside the beam can be considered locally plane (which again is related to the thickness ofthe beam, measured in wavelengths).Strictly speaking, if the field incident on an interface is not fully planar, and the interaction is to bemodelled quantitatively, then the field should be decomposed into a number of plane waves, just likea temporal pulse can be decomposed into a number of infinite tone signals. The plane waves can thenbe reflected one by one, using (9) and (10).In the human body, approximate reflection can be observed at the interface between blood and theintima of large vessel walls or at the interface between urine and the bladder wall.Quiz 2(Open in floating window of size 800x700)Quiz 3(Open in floating window of size 800x400)Figure 6 Graphical illustration of Snell’s law describing the direction of an incident plane wave (pi), reflectedplane wave (pr) and transmitted (refracted) plane wave (pt) from a large smooth interface. The three arrows indicate the propagation direction of the plane waves; the three parallel lines symbolizes that the wave is planar. Thepressure amplitudes of the reflected and transmitted waves are not depicted, but their relative amplitude can becalculated from R and T. θr θi.BMEDTU Elektro10/21
5.2 Critical angle**Depending on the speed of sound of the two media, some special cases occur.[2]If c1 c2, the angle of transmission, θt, is real and θt θi, so that the transmitted wave is bent towardsthe normal to the interface. This can be studied with the interactive Figure 6.If c1 c2, the so-called critical angle can be defined ascsin θ c ----1- .(11)c2If θi θc, the situation is the same as above, except that θt θi, i.e., the transmitted wave is bent awayfrom the normal to the interface. This can be studied with the interactive Figure 6.If θi θc, the transmitted wave appear to have a very peculiar form. In short, the incident wave is totally reflected.[2] The interested reader can find more details in larger textbooks[2].5.3 Scattering*While reflection takes place at interfaces of infinite size, scattering takes place at small objects withdimensions much smaller than the wavelength. Just as before, the specific acoustic impedance of thesmall object must be different from the surrounding medium. The scattered wave will be more or lessspherical, and thus propagate in all directions, including the direction towards the transducer. The latter is denoted backscattering.The scattering from particles much less than a wavelength is normally referred to as Rayleigh scattering. The intensity of the scattered wave increases with frequency to the power of four.Biologically, scattering can be observed in most tissue and especially blood, where the red bloodcells are the predominant cells. They have a diameter of about 7 μm, much smaller than the wavelength of clinical ultrasound.5.4 Absorption*Absorption is the conversion of acoustic energy into heat. The mechanisms of absorption are not fully understood, but relate, among other things, to the friction loss in the springs, mentioned in Subsection 2. More details on this can be found in the literature.[2]Pure absorption can be observed by sending ultrasound through a viscous liquid such as oil.5.5 Attenuation*The loss of intensity (or energy) of the forward propagating wave due to reflection, refraction, scattering and absorption is denoted attenuation. The intensity is a measure of the power through a givencross-section; thus the units are W/m2. It can be calculated as the product between particle velocityand pressure: I pu p2/z, where z is the specific acoustic impedance of the medium. If I(0) is theintensity of the pressure wave at some reference point in space and I(x) is the intensity at a point xfurther along the propagation direction then the attenuation of the acoustic pressure wave can be written as:I(x) I(0)e–αx(12)where α (in uni
This document attempts to introduce the physical principles of medical diagnostic ultrasound to a broad audience ranging from non-engineering students to graduate level students in engineering and science. This is sought achieved b