Transcription
Mapping the PostsecondaryData Domain:Problems and PossibilitiesBY MAMIE VOIGHT, ALEGNETA A . LONG, MARK HUELSMAN, AND JENNIFER ENGLEMarch 2014A REPORT BYInstitute for HigherEducation PolicySUPPORTED BYAccess and SuccessAccountabilityDiversityFinanceGlobal ImpactThe Bill & MelindaGates Foundation
Table of ContentsExecutive SummaryWhy Do We Need Better Postsecondary Data?What Do We Mean By Postsecondary Data?What Do Students, Policymakers, and Institutions Need to Know?What Are the Core Postsecondary Questions and Measures–and are the Data Available?How Can We Better Use Postsecondary Data?What is Next on the Postsecondary Data Frontier?This paper is a product of the Reimagining Aid Design and Delivery (RADD) Simplification and Transparency Consortium,funded by the Bill & Melinda Gates Foundation. Under this consortium, seven organizations joined together to exploreways to simplify the college admissions and financial aid process to make it simpler and more transparent. This paperrepresents the Institute for Higher Education Policy’s (IHEP’s) research and recommendations. While collaborations withthe consortium informed this paper, an organization’s participation in the consortium does not necessarily signal fullendorsement of this content. Consortium partners include: Center for Law and Social Policy, the College Board, Institutefor Higher Education Policy, National College Access Network, New America, the U.S. Chamber of Commerce Foundation,and Young Invincibles.AcknowledgementsThis report is the product of hard work and thoughtful contributions from a number of individuals and organizations. Wewould like to thank the Institute for Higher Education Policy (IHEP) staff who helped in this effort, including Michelle AshaCooper, president; Melissa Moreland, research analyst; and Eunkyoung Park, former research analyst. We also thank TiaT. Gordon at TTG PARTNERS for her communication efforts, Paula Amann for her editorial expertise, and Matthew Reedand Jessica Thompson from The Institute for College Access and Success (TICAS) for their thoughtful feedback on thereport’s content. We especially thank the Reimagining Aid Design and Delivery (RADD) Simplification and Transparencymembers, all of whom have been strong partners throughout this project. Finally, we are grateful for the Gates Foundation’ssupport of the RADD project and, in particular, this research on postsecondary data. Although many have contributedtheir thoughts and feedback throughout the production of this report, the research and recommendations presented hereare those of the authors alone.
Executive SummaryIn a time of rising college costs and stagnating rates of completion, America’s students, policymakers,and colleges and universities need better information about our postsecondary educationsystem. While their data needs do differ, each of these constituencies needs to be able to answercritical questions: Which students have access to which colleges?How many—and which—students complete college?How much does college cost, and how do students pay?What outcomes do students experience after college inthe workplace and society?These might seem like straightforward questions to which wealready have the answers. Yet, a careful mapping of federaldata systems against these questions shows that while wehave a solid base of understanding in some areas, we fall farshort in others. In an attempt to fill these gaps, a series ofvoluntary data initiatives have arisen in recent years. Theseinitiatives do not include all institutions or even all states, butthey do signal an emerging consensus on the importance ofanswering the key questions outlined in this paper. Projectslike Complete College America, Achieving the Dream, andAccess to Success collect voluntary data from states, institutions, or systems on access and success measures. Otherefforts like College Measures, the Project on Student Debt, andthe Workforce Data Quality Campaign aim to improve andreport cost, debt, and workforce results data.some core measures offers an opportunity to unify postsecondary data more broadly than is possible through voluntaryinitiatives. While the federal government could rework theunderlying structure of existing postsecondary data systems,this paper examines current systems like the Integrated Postsecondary Education Data System (IPEDS) and the NationalStudent Loan Data System (NSLDS) and proposes improvements to fill gaps in knowledge about postsecondary institutions and programs. Still others in the field are exploringalternative options such as state or regional approaches.The core measures (see TABLE 1) and proposed improvements described in this paper will be useful for all constituencies: Students and families as they make college decisions,policymakers as they make funding and policy decisions, andinstitutions as they work to continuously improve the ways inwhich they serve students. Each group also could benefit fromsupplemental measures suited to their particular needs. Thispaper provides a framework for understanding those needs,evaluating how well existing data meet them, and recommending practical solutions that would greatly improve theexisting data infrastructure.Despite sometimes disparate decisions on definitions andtechnicalities, growing agreement on the critical questions andINSTITUTE FOR HIGHER EDUCATION POLICY01
Why Do We Need BetterPostsecondary Data?The higher education community seems to have reached consensus: Now more than ever, studentsneed better information to help them make more informed postsecondary decisions. Too many oftoday’s college students are paying far too much at institutions that offer them far too few chances forsuccess, an outcome neither students nor the country can afford.Recent years have seen the rollout of the White House’s CollegeScorecard, the U.S. Department of Education’s Financial AidShopping Sheet, and a number of websites—among themCollege Measures, College Results Online, and College RealityCheck—aimed at helping students choose institutions that offerthem a better return on their college investment. Today, federaland state policymakers are developing rating and fundingsystems intended to more directly influence institutions to easecosts and improve outcomes for students. Amid these and otherefforts, demand has grown for more and better data to answerimportant questions about the value of a college education.Yet, our current data systems were not designed with today’sneeds in mind. In fact, significant gaps in the data on which wecurrently depend leave important questions unanswered:02MAPPING THE POSTSECONDARY DATA DOMAIN: PROBLEMS AND POSSIBILITIES How many part-time, adult, military, remedial, and Pellgrant students are successfully completing their degrees? Are students who do not graduate transferring to anotherschool or dropping out altogether? How much are students learning in college, and how arethey contributing to society after college? Are students leaving school with loan debt, and are theypaying back their loans, especially students who do notcomplete? What types of jobs are students getting after college? Arethey going to graduate school?
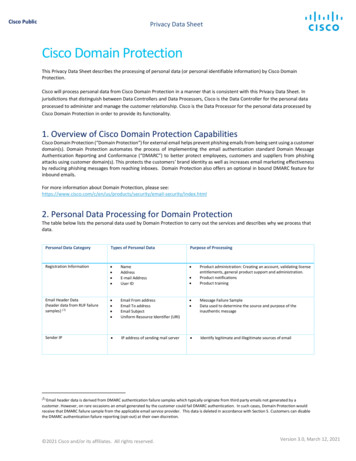
What Do We Mean byPostsecondary Data?Fundamentally, most people mean “information” when talking about “data.” However, without a clearframework, postsecondary data conversations can devolve quickly into debates about numerators,denominators, definitions, and cohorts—sometimes losing focus on the purpose.Clearly, these technical conversations are critical, as data availability, definitions, and quality all shape effective data use, butthese must not occur in a vacuum from a broader discussionabout the goals we aim to achieve with better data. This paperoffers a structure for organizing postsecondary data along severaldimensions to map the existing data domain and to chart a coursetoward getting the information needed to improve higher education using existing data systems (see FIGURE 1).First, before diving into the details, we need to articulate whatQUESTIONS need answering with improved data. Thesequestions may differ depending on the audience: Consumers1trying to make better, more affordable choices about where togo to college; institutions trying to improve student outcomes;or policymakers trying to protect the public investment. To besure, this is not a static nor straightforward process as the1Throughout this paper, the word “consumer” refers to students and in some cases, families. Thisinterchangeable use of the words “consumer” and “student” should not be interpreted to meanthat college is purely a consumer good, bestowing only private benefits on graduates. Rather,higher education creates thoughtful citizens who contribute to society as innovators, thinkers,artists, employees, parents, volunteers, taxpayers, and much, much more.higher education enterprise does and should evolve over timeto meet the changing needs of students. After identifying therelevant questions for today’s students, we then must identifyMEASURES that can answer those questions, and at this point,definitions and technicalities become highly relevant. Thispaper draws on existing postsecondary data initiatives, as wellas conversations with higher education data, research, andpolicy experts to outline the core questions for students, policymakers, and institutions, and then proposes measures toanswer those questions.To populate the measures, we must rely on the collection andsubmission of data housed in DATABASES—either existing ornew. The existing national postsecondary databases were builtfor different purposes at different times, making it challengingto adapt them to today’s needs. For example, the IntegratedPostsecondary Education Data System (IPEDS) was designedto provide a national composite of the nation’s postsecondarysystem with reporting required for compliance to maintain TitleINSTITUTE FOR HIGHER EDUCATION POLICY03
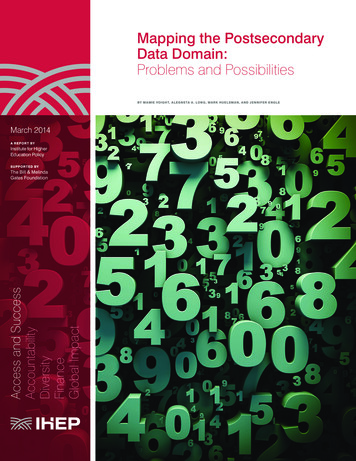
FIGURE 1What Do We Mean by tudent Unit Record Systems(Federal, National, State, Institutional)IV eligibility.2 The National Student Loan Data System (NSLDS)primarily serves as a transactional tool for student loans (seeBOX 1), although research and policy analysis also areapproved uses.3 This paper outlines how existing national datasets can be amended, added to, or linked together to answerthe core postsecondary questions identified herein. Alternately,a new student-level database could be conceived andconstructed to generate the data postsecondary educationdemands (see New America’s forthcoming paper on a studentunit record system); others in the community are consideringstate or regional approaches.4Finally, data must be communicated clearly through userfriendly, context-sensitive INTERFACES that truly convert datainto information that can drive change. Regardless of thequality of these interfaces, especially for consumers, they mustbe accompanied by counselors, mentors, teachers, or otherexperts who can help students interpret and use the information. Data alone do not change student behavior; people do.INTERFACESTools andcounseling forconsumers04Accessible data setsand dashboards forpolicymakersManipulable datasets for institutions234MAPPING THE POSTSECONDARY DATA DOMAIN: PROBLEMS AND POSSIBILITIES“Integrated Postsecondary Education Data System (IPEDS) 2014–16 and 2013 carry overSupporting Statement Part A” (OMB No. 1850-0582 v. 13), 15. Submitted by the National Centerfor Education Statistics, March 6, 2013, Revised July 31, 2013.20 USC 1092b(b).Western Interstate Commission for Higher Education. Facilitating Development of a MultistateLongitudinal Data Exchange. Retrieved from: http://www.wiche.edu/longitudinalDataExchange.
BOX 1. Existing Postsecondary Data SourcesHigher education depends on a limited number of large-scaleand national postsecondary data collection efforts to providefoundational information about the system. The most comprehensive national sources of postsecondary data today are thefederally mandated Integrated Postsecondary Education DataSystem (IPEDS) and the National Student Loan Data System(NSLDS), along with a third-party organization, the NationalStudent Clearinghouse (NSC). In addition to these threeprimary data sets, several less comprehensive data sources—such as state longitudinal data systems, many of which do notinclude private nonprofit or for-profit institutions;5 voluntarydata initiatives like Complete College America; and the NationalCenter for Education Statistics’ (NCES’) nationally representative sample studies6—provide their own glimpse into the postsecondary system.Each of the three primary data systems was created for aunique purpose. IPEDS was authorized in 1992 to use anumber of existing surveys to provide a national portrait of alltypes of institutions in the postsecondary system; institutionsmust report data to IPEDS in order to retain eligibility for theTitle IV program. The creation of NSLDS was mandated in 1986to respond to an environment of waste, fraud and abuse in thestudent aid system, while also minimizing administrativeburden. NSC is a private nonprofit organization launched in1993 with the initial goal of streamlining student loan administration, but which now contains a wealth of student-level information and serves a variety of purposes, but charges a fee andhas no mandate to share institution-level information publicly.Because of the varied—and sometimes very specific—goals ofeach of these systems, users face challenges and limitationswhen trying to repurpose the data for broader consumer information, policymaking, or institutional improvement. Forinstance, in the case of IPEDS, concern over student athleteoutcomes in the late 1980s led to the creation of the Graduation Rate Survey and the inclusion of only first-time, full-timestudents in the graduation rate cohort.7 While this definitionaldecision made sense for student athletes, it is far less useful forthe broader student population, especially given the makeupof today’s student population. Also, because different institutional identifiers are used in IPEDS and NSLDS (and otherFederal Student Aid (FSA) data), merging information acrossdata systems can be challenging and complicated.8Each of these data systems contributes to our understanding ofthe postsecondary system. Furthermore, the voluntary initiativeshave moved the data conversation forward, converging keystakeholders around several core measures and metrics that arelacking in the national data sets. However, when recentlysurveyed about progress in measuring outcomes for post-traditional students, institutions cited “lack of consensus on key definitions and metrics” and “insufficient coordination amongindustry stakeholders” as two challenges facing the community.9Given the emerging consensus around measures, paired withseeming confusion around definitions and nuances and theneed for streamlining of collections, the federal government canplay a unifying role in these data debates.56789Data Quality Campaign, Data for Action survey.NCES’ postsecondary sample studies include the National Postsecondary Student Aid Study(NPSAS), Beginning Postsecondary Students (BPS), and Baccalaureate and Beyond (B&B).Bryan Cook and Natalie Pullaro, “College Graduation Rates: Behind the Numbers,” (Washington,DC: American Council on Education, September 2010), 4 and 7. Retrieved from: ions for Improvements to the Collection and Dissemination of Federal Financial AidData,” (Washington, DC: National Postsecondary Education Cooperative, 2011), 23. Retrievedfrom: http://nces.ed.gov/pubs2012/2012834.pdf. This document offers more details on thecomplexities of IPEDS and FSA institutional identifiers.“Measuring Post-Traditional Student Success: Institutions Making Progress, but ChallengesRemain,” (Washington, DC: University Professional and Continuing Education Association andInside Track, 2013), 3. Retrieved from: /06/upcea whitepaper 2013.pdf.INSTITUTE FOR HIGHER EDUCATION POLICY05
What Do Students,Policymakers, andInstitutions Need to Know?The million-dollar question facing all higher education constituencies involves the concept of “value.”Which colleges produce value or return on investment for students, as measured by inputs, outputs,and cost? While terms like “value” and “return on investment” tend to evoke economic and workforceconcepts, measures of learning and social good can be incorporated as “outputs” as well, providinga more holistic perspective on college value. This question of value—which institutions provide itto which students in what quantities—permeates postsecondary discussions today and touches allactors in the system, including students, policymakers, and colleges and universities.For students, the evidence is clear: On average, college graduates have higher earnings and are less likely to face unemployment than those without a postsecondary credential.10 Werestudent graduation, debt, and employment outcomes relativelysimilar across all institutions, then students might not requirebetter data to inform decision-making. Yet, graduation ratesand student debt do vary tremendously across institutions.11And while comprehensive information on employmentoutcomes is unavailable, data on states participating in CollegeMeasures12 and on gainful employment programs13 indicatethat labor market outcomes also vary considerably by institution and program.Bureau of Labor Statistics, Current Population Survey (2013), Employment Projections: Earningsand Unemployment Rates by Educational Attainment. (Washington, DC: Bureau of Labor Statistics, 2013). Retrieved from: http://www.bls.gov/emp/ep chart 001.htm.11Mamie Lynch, Jennifer Engle, and José L. Cruz. “Priced Out: How the Wrong Financial-Aid Policies Hurt Low-Income Students,” (Washington, DC: The Education Trust, 2011), 5, Figure 4.Retrieved from: cedOutFINAL.pdf; (2013).“Student Debt and the Class of 2012” (Oakland, Calif.: The Institute for College Access andSuccess, December 2013). 012.pdf.12College Measures. Retrieved from: www.collegemeasures.org.13“2011 Gainful Employment Informational Rates” (Washington, DC: Federal Student Aid, U.S. Department of Education, 2012). Retrieved from: ge/data.To select a college and course of study most likely to setstudents up for success, they need clear information aboutcollege access, outcomes, and cost.14 In fact, research showsthat high-achieving, low-income students who receive information on college costs and financial aid options are more likelyto take steps toward attending college, particularly institutionswith strong outcomes.15 Similarly, when low-income parentsreceive information about college outcomes, they act on it,allowing graduation rates to trump even location when identifying colleges to encourage their children to attend.16 (For moreinformation on students’ particular data needs, see BOX 2.)1006“Will College Be Worth It?” (Washington, DC: Young Invincibles, 2013). Retrieved from: e-worth-it/. This report includes examples of the typesof information students seek.15Sara Turner and Caroline Hoxby, “Expanding College Opportunities for High-Achieving, LowIncome Students” (Stanford, Calif.: Stanford Institute for Economic Policy Research, 2013), 23–26.Retrieved from: http://siepr.stanford.edu/?q 6Andrew P. Kelly and Mark Schneider, “Filling in the Blanks: How Information can Affect Choice inHigher Education” (Washington, DC: American Enterprise Institute, 2011), 15. Retrieved theblanks.pdf.14MAPPING THE POSTSECONDARY DATA DOMAIN: PROBLEMS AND POSSIBILITIES
Consumer information is a critical piece of our nation’s postsecondary data infrastructure, informing one of the biggest decisionsof students’ lives. In addition, consumer information can act as aform of soft accountability, allowing some students to “vote withtheir feet” in the direction of institutions that serve them well.However, soft accountability is just that: Soft. While other consumerinformation efforts, such as public campaigns about the adversehealth consequences of smoking, have substantially changedbehavior—albeit slowly,17 college choices are fundamentallydifferent. In the higher education context, many students—particularly adults, members of the military, and low-income, first-generation students—face very limited choices in where to go to college.Even with access to perfect information some of these studentswill remain place-bound, searching for colleges near their homeand family, or at least within their state, where they qualify forin-state tuition.18 Real accountability and improvement requiresaction by policymakers and institutions.And such accountability is warranted. Taxpayers invest billionsof dollars in higher education through student financial aid,research and development, institutional tax exemptions, stateand local spending and investment in Title III and V institutionsand programs. To safeguard this substantial investment andprotect students from subpar institutions, policymakers needbetter information on institutional costs, student prices, and“The Health Consequences of Smoking—50 Years of Progress. A report of the Surgeon General”(Washington, DC, U.S. Department of Health and Human Services, 2014), 5. Retrieved from ears-of-progress/exec-summary.pdf.18Amanda Griffith and Donna S. Rothstein, “Can’t get there from here: The decision to apply to aselective college,” Economics of Education Review 28 (2009) 620–628. The study containsresearch on how distance impacts college decisions. Retrieved from: http://eric.ed.gov/?id EJ850771.17student outcomes—information that is more detailed and morenuanced than that used to inform students. For example,students need to know how much they must pay for college,but they do not need to know the total amount of Pell grantdollars or state appropriations received by their institutions.Nonetheless, those data on public investments are crucial forpolicymakers trying to determine how best to distribute scarceresources. (For more information on policymakers’ specificdata needs, see BOX 3.)Clearly, students and policymakers need access to critical information to guide thoughtful choices and policymaking. But in theend, both students and policymakers will have only indirectimpacts on institutional performance. Some students may avoidinstitutions with poor outcomes, but such choices are not realisticfor all students given location and cost constraints, as mentioned.In terms of policymaking, most accountability systems issue harshsanctions only for the worst-of-the-worst performers, allowingsome subpar or mediocre institutions and programs to continueoperating without substantial consequences.19For all institutions, though, continual improvement is critical—and thoughtful data use can inform and drive those effortsdirectly. Serving students and serving them well is arguably thecore function of institutions of higher learning. But too manyinstitutions are struggling to increase student success on theircampuses. Better and more deliberate use of data can help19President Obama’s proposed rating systems may offer more broad-based accountability for institutions at all levels of performance, depending on the design of the system and its penalties orincentives.INSTITUTE FOR HIGHER EDUCATION POLICY07
BOX 2. Additional Data for StudentsIn addition to the core measures, students also need informationabout what experiences and supports colleges offer, includingstudent services, opportunities to expand their learning, andvenues to contribute to their communities and the greater society. In its College Access & Opportunity Guide, the Center forStudent Opportunity advises students to ask a range of questions including the following: Do all entering students have assigned academic advisors? To what extent does the school help students deal withtheir academic and social needs? What percentage of students do community service? What percentage of students study in other countries? What percentage of students gain internship or co-opexperience before graduating?20While these questions will help students build an understandingof each campus environment, many students—particularlythose receiving less guidance in the college search process—may not think to ask them. As a proactive step to informstudents, institutions should provide clear information aboutthe availability and student use of student support services,career services, experiential learning, and civic and communityengagement. Minimally, institutions should break down dataon student use of services by socioeconomic status and race/ethnicity, so as to ensure broad access to these programs andopportunities. All of this information should be easily accessible on websites and in marketing materials, as part of the mixof data available to students during the college search process.20Center for Student Opportunity, College Access & Opportunity Guide, 2010.BOX 3. Additional Data for PolicymakersIn this era of budget cuts and fiscal austerity, policymakersneed to spend each public dollar wisely. To make thoughtfuland productive decisions about where and how to invest fundsfrom the public coffer, federal and state policymakers needbetter information on how institutions and states spend theirown dollars, how public funds currently are distributed, andhow these investments can best promote access and completion, especially among underserved populations. For instance:Targeting of State and Institutional Aid: While the federal Pellgrant program targets students with the greatest need,21 statesand institutions too often undermine this investment byspending their aid dollars on students who do not need thefinancial support.22 Existing data are not yet fine-grainedenough to understand individual state and institutional aidpractices. To make these data available, the net price by incomecomponent of the Student Financial Aid survey could disaggregate average grant aid by source to allow policymakers toexamine which students the state and institution supports, andby how much.23 To make these data as useful as possible, thenet price data would need to incorporate non-Title IV recipients.Current Federal Investment: Institution-level information is available on federal grant, loan, and work-study expendituresthrough the Federal Student Aid Data Center (http://studentaid.ed.gov/data-center). However, while national trends show that35 percent of tax credit expenditures benefit families makingmore than 75,000 annually, more detailed data are not available by state and institution.24 The Internal Revenue Service(IRS) likely could generate this more detailed information,disaggregated by student/family income, using the institution08name and address included on the 1098-T—the tax form institutions must complete to allow students to claim education taxbenefits.25 This process could be streamlined if the IRS addedan IPEDS UnitID field to the filer portion of the 1098-T.Investments to Promote Access and Completion: Measures ofstate investment per completion can be calculated usingexisting data sources,26 but other measures of investment percompletion may be useful as well. These data on investmentscould be useful in quantifying the impact of public investment,but also should be interpreted with care and not used tomeasure program effectiveness inappropriately. For example,the population of students receiving Pell grants differs from thepopulation of students receiving tax benefits in a number ofways, including the number and type of obstacles to successthey face. As such, if dollars per completion proved to be lowerfor tax benefits than for Pell grants, that finding would not indicate that tax benefits are more efficient.Federal Pell Grant program of the Higher Education Act-Background, Recent Changes, andCurrent Legislative Issues, Congressional Research Service, 5.31.2011. Retrieved from: http://www.nasfaa.org/EntrancePDF.aspx?id 5410.22Stephen Burd, “A Troubling Milestone for Higher Education” (Washington, DC: New AmericaFoundation, 2011). Retrieved from: /a troubling milestone for higher education-59952. 40th Annual Survey Report on State-SponsoredStudent Financial Aid: 2011-2012 Academic Year. (Washington, DC: National Association of StateStudent Grant and Aid Programs, 2013). Retrieved from: yID 3#.23See technical report for other proposed changes to the net price data in IPEDS.24“Trends in Student Aid,” (Washington, DC: The College Board 2013), 27. Retrieved from: s/student-aid-2013-full-report.pdf.251098-T. Internal Revenue Service. Retrieved from: http://www.irs.gov/pub/irs-pdf/f1098t.pdf.26The State Higher Education Executive Officers (SHEEO) reports annually on state higher education appropriations. These data could be combined with IPEDS completion data to calculateinvestment per completion.21MAPPING THE POSTSECONDARY DATA DOMAIN: PROBLEMS AND POSSIBILITIES
BOX 4. Additional Data for InstitutionsColleges and universities hold a wealth of data beyond what isreported to governmental agencies, or even to voluntary initiatives or accrediting bodies. And research has shown that deliberate use of that data as part of a data-driven culture can be theimpetus for substantial improvements in student outcomes.27To d
secondary Education Data System (IPEDS) and the National Student Loan Data System (NSLDS) and proposes improve-ments to fill gaps in knowledge about postsecondary institu-tions and programs. Still others in the field are exploring alternative options such as state or regional approaches. The core measures (see TABLE 1) and proposed improve-