Transcription
Introduction toConfocal Laser ScanningMicroscopy (LEICA)This presentation has been put together as a common effort of Urs Ziegler, Anne Greet Bittermann, MathiasHoechli. Many pages are copied from Internet web pages or from presentations given by Leica, Zeiss andother companies. Please browse the internet to learn interactively all about optics. For questions ®istration please contact www.zmb.unizh.ch .
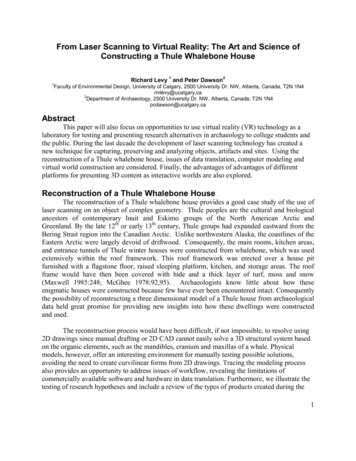
Confocal Laser Scanning Microscopyxyyz100 µm100 µmxzxyyzxzthick specimens at different depth3D reconstruction
{{{Types of confocal microscopespoint confocalslit confocalspinning disc confocal (Nipkov)Best resolution and out-of-focus suppression as well as highest multispectralflexibility is achieved only by the classical single point confocal system !
Fundamental Set-up of Fluorescence Microscopes:confocal vs. tector pinholeapertureCCDFluorescenceLight SourceDichroic mirrorOkularLight sourcepinhole apertureFluorescenceFilter CubeObjectivesSample PlaneZ Focus
Confocal laser scanning microscope - set up:The system is composed of a a regular florescence microscope andthe confocal part, including scan head, laser optics, computer.
Comparison: Widefield - ConfocalYXHigher z-resolution and reduced out-of-focus-blur make confocal pictures crisperand clearer.Only a small volume can be visualized by confocal microscopes at once. Biggervolumes need time consuming sampling and image reassembling.
Comparison: Widefield - Confocaloptical resolution in zWidefield2 - 3 µmConfocal0.5 µm
Comparison: Widefield - Confocalregion of out-of-focusinformationWidefieldblurred &largeConfocalvery small
Widefield: optical sectionMany signals can not be seen separately!Side viewSignals on top of each other can not be seen separatelyOptical sectionTop view
Confocal : optical sectionImproved z-resolution allow for more accurate signal discrimination!Side viewThese structures are not superimposedOptical sectionTop view
Confocal: “extended focus””Side viewsingle optical sections get projected on one plane - the result isan clean image: everything is focused over the hole depth withoutany out-of-focus-noise.Projection(Top view):Informationcontent of allthe sections isprojected toone plane.
Z galvo stage provides fast z stacking! Pivot-mounted arm withgalvo motor! 166 µm-z-range on SP21.5 mm-z-range on SP5! fast motor allowslive xz-imaging! Reproduceability 40nm! Different inserts possible
Z-stackingDefining a volume:Setting the z-values forbegin & end of the samplingDefining the resolution:defining the thickness andnumber of optical sections withinthe volume
Aquisition of 3D data setsA xy top viewB, C xz side viewsat different y-positonsThe number of opticalsections defines the zresolution in the data set.The section thicknesstogether with the xy-pixeldimension defines the„voxel“ size (voxel volume element, thesmallest unit of thesampled 3D volume).
Consequences for the confocal imageCell cultureCellular structures can be resolved due to the good resolution in zTissueOnly a very thin layer through the tissue is visualized.
Image aquisitionfrom differentsample depthsA tissue sectionwas opticallysectiones every10 µm.On each sectiona differentsituation in thevery same tissuecontext can beimaged.
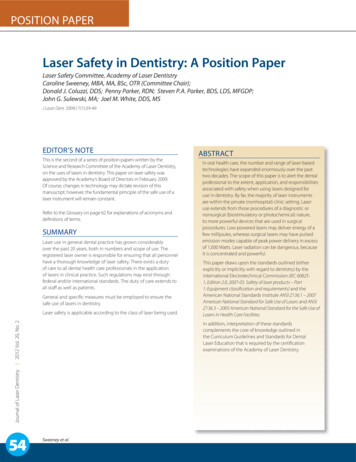
Deep Penetration into a thick sampleThick specimen (100µm): GFP muscle fibers, embedded in Glycerol (80/20)matchcenter sectionmismatchcenter sectionoozGlycerol Objective PL APO 63x1.3zOil Objective PL APO 63x1.32Glycerol immersion allows deeper penetration into the sample without severelight loss or distortion. Oil immersion is ideal for imaging near the cover glass.
Immersion media and depth penetrationcover glass(z 0)Z10µM FITC in Glycerol-Water (80/20)-xyz-series120GlycerolBeads 220 nm embedded in ivs allow for deep penetrationinto the embedded biological sample(distortion, brightness).050100150200Depth !m1.3 GlycCorr1.32 Oil250300
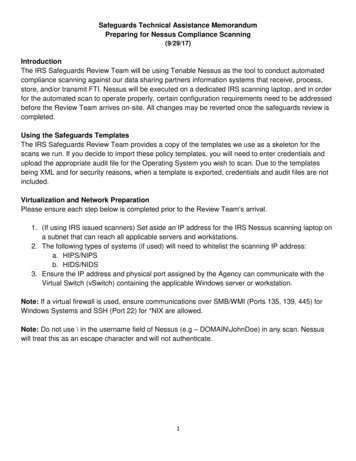
Effect of immersion media on sperical aberration9AirLongitudinal diameter (µm)Sphericalaberrationis one of themostcommonlyobservedproblems inconfocalmicroscopy!6Oil Glycerol300.911.11.21.31.41.51.6refractive indexSide view (xz plane) of the 2.76 µm fuorescent microsperes embedded indifferent media with known refractive indices. The speres immersed in oilappear to be more sperical than the others.
Specifications of the objective- need for cover glass thickness (i.e. 0,17 mm), immersion medium (air, water, oil, glycerol)- abilities for working distance (sample thickness), NA (signal brightness), magnification (field of view)- resolution power in XY & Z (- optical section thickness)
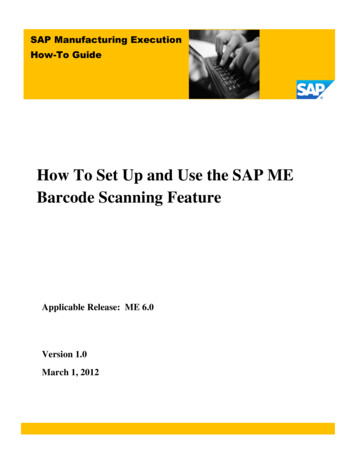
z - resolution in confocal microscopyOptical sectioning thicknessas a function of NA of the objectiveOptical sectioning thicknessversus confocal pinhole diameter2.0Immersion Oiln 1.51.0Airn 100.20.40.60.8NA1.01.2Z1/2 (µm)Z (µm)3.01.4Pinhole diameter (mm)
confocal imaging - in focus/out of focusexem
Pinhole diameter effectsopt. sectionsmall pinhole diameter:big pinhole diameter:- thin optical section- thick optical section high z-resolution possible low signal strength low z-resolution brighter signal
The pinhole is optimized foreach objectiv. „Airy 1“ is a good start, butNOT an iron rule; play withpinhole to get either morelight or more resolution. Resolution depend also onwavelength; keep in mind ifresolution REALLY matters.Leica pinhole values areoptimized for mediumwavelength.µmPinhole size, color and z-resolutionµmThe pinhole variable determines your z-resolution.
The single point confocal systemBeam diameter is limited by a „pinhole“ aperture- field of illumination & detected signal are pointed !consequences for confocal imaging:The illumination intensity has to be very high.(LASER light)Photo multipier tubes (PMT) are used for sensitive and fast single point intensity registration.The light source is scanned over the sample.The image has to be rebuilt from the recordedpoint intensities according to the xy- coordinates.The image is not directly visible for the eye.The image has to be electronically generated.(Sequential acquisition process)
LASER as confocal light sourceMercury and Xenon Light sources are to week for point confocalsystems. Strong bundled light is generated by LASERS.There are different types of LASERS: Argon, Argon-Krypton, HeliumNeon, etc. The coupling to the system and the alignment has to bedone by trained engineers.LASER sources generate monochromatic light of a discretewavelength - “LASER line”. For the spectral range are differentLASERS necessary. Depending on the hardware of the microscope,some of the following lines might be available (" in nm):352, 364, 405, 430, 458, 476, 488, 496, 514, 543, 561, 596, 633
Laser Excitation561 nmLASERAlexa 568543 nmLASERAlexa 568514 nmLASERAlexa 568! choose florochromes accordingly to the laser lines: as further away the laser line is from theabsorption maximum of a fluorochrome as weaker the emission signal gets!
The filter free CLSM: Leica confocalsNon-LEICA:glas filters and dicroicmirrors determine thespectral detectionLEICA:Prisms, free adjustablebarriers and tunable quarzcristals determine thespectral detection: AOTF,AOBS, SP
Leica TCS SP5*-the newest generationof Leica confocalmicroscopes*The ZMB owns an inverted Leica TCS,a TSC SP2 confocal system with up-rightand inverted microscope stand andan inverted Leica TCS SP5.
Leica confocal laser scanning microscopeLight source (Lasers, AO TF)Filters (SP)Detectors (PMT, APD)Beam splitters (AO BS)Scanner (conventional, resonant)
AOTFAcousto Optical Tunable FilterUltrasonicabsorberIncident LaserlightDiffracted LaserlightFiberUndiffracted LaserlightAcousto Optical CrystalUltrasonic SourceThis adjustable quartz filter works at frequencies as high as sound, that is "Acousto-".! Light,which passes the AOTF, is diffracted depending on ist own wavelength and the wavelength ofthe ultrasonic wave field. The ultrasonic wave field can be modulated, so that the intensities ofthe different laser lines can be changed between 0% and100% by the software even during thescanning process.
AOTFAcousto Optical Tunable FilterArgon LASERAOTF458 nm476 nm488 nm496 nm514 nmThe AOTF enables you toselect the wavelengths(laser lines on/off).The AOTF enables you tocontrol the intensity of theexcitation light.
Excitation optimumFluorophore .00E 003.00E 246.00E 249.00E 241.20E 251.50E 25Excitation Photonsexex em##Avoid oversaturation !- lower light power decreasesphototoxicity and bleaching.em
Leica confocal laser scanning microscopeLight source (Lasers, AO TF)Filters (SP)Detectors (PMT, APD)Beam splitters (AO BS)Scanner (conventional, resonant)
spectral detection in Leica CLSMPrisma andadjustablebarriersallow freechoice ofdetectionwindows.The Leica spectrophotometer detectionsystem (SP): After passing the detection pinhole, the light emitted from thefocal plane is passed through a prism,which stretchs the emitted light. Theentire spectrum can be imaged ontothe window of the PMT. In front of thePMT is a slit. The slit 1) can bewidened or narrowed to include alarger or a smaller part of the spectrum& 2) can be moved across thespectrum. Due to the slit in front, thePMT detects only a particularbandwidth. The remainder of thespectrum is excluded by the plates oneach side of the slit.The surfaces ofthese two plates are mirrored andangled to reflect the rejected portionsof the spectrum off to other detectors.
Multispectral imaging with the Leicaspectrophotometer detection system (SP)freely tuneable emission bands allowto adjust for a variety of dyesUp to 5 confocal channels simultaneously(multispectral imaging)Recording of emission spectra via "-scan
sprectral discrimination.
Leica confocal laser scanning microscopeLight source (Lasers, AO TF)Filters (SP)Detectors (PMT, APD)Beam splitters (AO BS)Scanner (conventional, resonant)
Digital image detectors in CLSMRead-out of all sensors: voltage / currentCCD cameras for point-confocal microscopes not suitable.PMT s have a high dynamic range and noise-free signal amplification.APD photodiodes have highest sensitivity and wide spectral range.
Spectral sensitivity of confocal detectors
How PMT s work .rplieulti-motoPhetubIntensity measurementswithout spectral information(high sensitivity, pseudocolors)Principle of signal amplificationSequential single pointmeasurements- coordinates get defined byposition in the scan sequence1)Conversion of photones into electrons2)Multiplying electrons3)Signal readout
Electronic grayscale imageEach pixel (picture element) has its coordinates and intensity values.
Dynamic rangeinformation depth - number of grey levels in an image, resolution of intensityA higher dynamic rangeallows quantifications,image analysis.The computer monitordisplays 256 grey levels.The human eye candiscriminate about60 gray levels (6 bit).More Bits need morestorage space in thecomputer.
look up table (LTU)051102153204255Detected intensity values are displayed as gray levels. The display range ofa typical 8-bit monitor covers 256 gray levels. The full range of the LUT isutilized if an image shows all shades of gray between black ( 0) and white( 255). The gray levels might be presented in pseudo-colors.
AsigningPseudocolorsFor multi-channelaquisition it is helpful toasign indexed colors tothe different gray-scaleimages.„Glow over-under“facilitates the gain &offset-adjustments.
Electronic pseudocolor imagesMultilabeled samples are imaged under different fluorescence conditionsby black&white-detectors - overlay of pseudocolor-indexed grayscale images
Gain & Offsetgain and offset are used to adjust the detector signal (input) in a way, thata maximal number of grey levels is included in the resulting image (output).gainoffsetamplifies the input signal bymultiplication, which results in ahigher gray level value; brightfeatures are brought closer tosaturation, general imagebrightness is increased.sets the gray level of a selectedbackground to zero; adjust thedarkest features in the image toblack.
look-up table “glow over/under”to determine underexposure and saturation of an imageLook up table “glow”051Black turns into green102153204255White turns into blue
Contrast and resolutionResolution also depends oncontrast!Rayleigh criterion: Theseparation between twopoints requires a certainlevel of contrast betweenthem. A 26.5% depressionin brightness appearingbetween two maxima, isgiving the sensation oftwoness.unresolvedRayleigh limitresolved- Adjustment of gain& offset can improveresolution!!!
signal-to-noise ratio & averagingshort sampling timelonger sampling timeSeveral images (frames) get accumulated and averaged.Averaging allows to reduce noise - signal apears clearer.
Leica confocal laser scanning microscopeLight source (Lasers, AO TF)Filters (SP)Detectors (PMT, APD)Beam splitters (AO BS)Scanner (conventional, resonant)
AOBS Acousto-Optical Beam Splitterin comparison to the filter-mirror beam splitterElectronically tuneableFixed device (no mecanicalmovements)Fast switching timeUp to 8 Illumination linespossible simultaneouslyAOBSConventional beam splitter
i.e. FITC -„cut off“(lostemissionsignal)Beam splitter versus AOBSDicroicBeam splitterDD 488/543Acusto-OpticalBeam splitter/flexiblecharacteristics)
AOBS: Operation (1)Acousto-Optical Beam Splitterthe passive elementto detectorPassiveelementfrom Laser
AOBS: Operation (2)Acousto-Optical Beam Splitterexcitation by one lineto detectorRadio frequency 1appliedfrom Laser
AOBS: Operation (3)Acousto-Optical Beam Splittertwo excitation lines: .and so on up to 8 lines!to detectorRadiofrequencies1 and 2appliedfrom Laser(s)
Beam splitter transmissionConventional dichroicbeam splitter:transmission No sharp bandsTransmission holesFixed characteristicsNon-linear transmissiondistorted spectraAcusto-Opticalbeam splitter: Perfect selectivitywavelength(0,6-2 nm bandwidth) More transparent More “room” to detectfluorescence Linear transmission,correct spectra
Leica confocal laser scanning microscopeLight source (Lasers, AO TF)Filters (SP)Detectors (PMT, APD)Beam splitters (AO BS)Scanner (conventional, resonant)
Detection timescales - image formats1:1(512 x 512)2:1(512 x 256)4:1(512 x 128)
Detection timescales* uni- vs. bi- directional scanning* galvo vs. resonant scanning400Hz unidirectional to 1400Hz bidirectional8000 Hz resonant8000 Hz resonant bidirectional1:1(512 x 512)2:1(512 x 256)4:1(512 x 128)
The resonant scanner:increases speed and sensitivityXhigh scan speedby coupling thex-scanner withtwo y-scanners(x-2y scanner set)Y1Y2
Resonant scanner (Leica TCS SP5)Dynamic live cell imaging and kinetic measurementsBrighter imagesLess photobleachingWork with a frequency of 8000 Hz instead of the conventional 400 Hz
Resonant scanner delivers brighter imagesConventional scanner: froma certain location we gain anamount of fluorescenceConventional scannerResonant scannerWhen running the scanner atdouble speed (and line-accumulation resp. averaging), we gainmore signal.If illumination is short enough,we get much better signal-tonoise ratio in identicalacquisition times.Note: total illumination timestays constant. Repetitive short illuminationresults in brighter images
confocal softwareOptions:Microscope controlMulti-spectral aquisition3D-samplingSpectrum collectionDye finderQuantificationTime lapsImage processingMulti-position imagingModules for FRET,FRAP, FLIM
Zoom-functionallows flexible higher magnificationno zoomzoomBy zooming, a smaller area gets scaned with the same number of image points- the field of view is reduced, the pixel resolution stays constant, details areshown magnified.(The zoom up to 10-15x is real: more details get depicted. Additional zooming (20-30x) is „empty“: noinformaition gain, the same detais are shown bigger by blown-up pixels.)
pixel resolutionHow many pixels are neededto reproduce the object withthe full resolution obtained bythe microscope?- Nyquist criterion for digitalresolution: smallest resolvedstructures should have 2,3pixels!!Aquired with 512 x 512 pixelsAquired with128 x 128 pixels
Scanning options:beam parking, regions of interest (ROI),.Regions of interest (ROI):some regions in the field of view might be illuminateddifferently than the surrounding areaThe regions might have any shape or positionBeam parking allows:Spot bleachingSpot measurements- FRAP & FLIP -Experimentsfluorescence recovery after photopleachingfluorescence loss in photobleaching
QuantificationsIntensity measurementsHistogram, spectrumSelection of ROIsand Channels
Processed DyeSeparationDyeFinder-tool:Not wanted: CrosstalkFast elimination of crosstalkUse of ReferencesSuppression of autofluorescencerawrawseparatedWanted: Perfect Dye Separation
Multi position samplingIntegration of motorized xy-stage allows mark&findfunctions:Multi PositioningLocation specific stacksCombination with time lapseZZPos 1Pos 1Pos 3Pos 3Pos 2XYPos 2XY
Tile ScanHigh Resolution OverviewIntegration of Motorized xy-stage allows stitching of neighbouringdata sets - hight magnification in a larger field of view
Beam Path Settings* Excitation light: fixed LASER lines* Beam splitter:auto-adjustment* Emission light:free choice ofdetection windows
Visualizing fluorescent samples inLeica CLSM You have to choose one of the given LASER lines accordingly tothe excitation properties of your dye. You are totally free to choose your CLSM detection window.In order to do so, you must know about the emission properties ofyour dye. The detection window should not hit an active LASERline. If you don t know anything about your fluorochrome, you have tocheck different laser lines for response and perform a " scan todetermine the emission properties.
ex/em-properties of somecommon EmissionMaximum(nm)DAPI358461FITCGFPAlexa 488Cy2490488495489520507519506TRITCCy3Alexa 546Teaxas red547550556595572570573615Cy5649670
Beam Path SettingsexChoose appropriate laser lines and tune themto the minimal useful intensityemPlace detection windows within the spectralrange and adjust the band width.
Beam Path SettingsSettings mightbe savedChoose settingsaccording to ex/emproperties of yourfluorochromeAvoid detection on active LASER lines(- reflection !)
Multi-channeldetection IUp to 4 fluorescentchannels can becaptured simultaneously.Fluorochromes withnon overlappingemission spectra might bedetected in parallel.
Multi-channeldetection II1. 2.Fluorochromes with overlappingemission spectra might be detected inparallel if LASER power and GAIN areproperly adjusted and the detectionwindow is well choosen.Fluorochrome 1(shorter wave lenght ex/emspectra)- use as low LASER power as possible1.2.Fluorochrome 2 (longer wave lenght spectra)- low gain- high LASER power- detection window is shifted out of theoverlapping zone as much as possble- check carefully for absence of cross talk !
Multi-channel detection III4 ch:-(2 chparallel1.Fluorochromes with strongly overlappingemission spectra are best detectedsequentially in order to avoid cross talk.1 ch1 ch2.3.Sequential detection of emission channels
Multi-channel detection modesin CLSM Parallel („the fast choice“)Several laser lines excite the various fluorochromes in the sample at thesame time. The multicolor emissions are collected in several channelssimultaneously by several active PMTs. Sequential („the safe choice“ - avoids cross talk !)Only one laser line is active. Only one fluorophore is excited and emits itssignal, which is collected by one active PMT. Then Laser & PMT are switchedoff and the next laser line and PMT are activated in order to capture the nextchannel.
Inquiring spectral properties1Autofluorescence (and unknown flourochromes) might need some characterization 1 Which LASER line triggers the strongest emissionresponse in the sample? - checking different LASER lineswith a wide open detecton window.2Lambda-scan: a narrow detection window3is measuring the emission signal at different "223Emission spectrum: emissionsignal at selectet spots: intensity versus "
CLSM: Choosing fluorochromes Choose fluorochromes accordingly to the LASER lines of the system(excitation spectrum should have ist maximum close to a given LASER line)!!! Remember: not all suitable fluorochromes are visible by eye (i.e. Cy5) For multi-channel fluorescence microscopy, best use fluorophores with nonoverlapping spectra. If your fluorophores have overlapping emission spectras, avoid cross talk bycareful adjustments OR by detecting the channels sequentially instead ofparallel Because of the chromatic abberation of the lenses, you best use a green/redpair of fluorescent markers for co-localization to avoid z-mismatch of thechannels
Lens aberration effects in the data- need for image processing: deconvolution, pixel shifts, .top viewside view3D dataset ofmultifluorescentbeads.best xy-resolution 200 nmThe 3D roundobject looksperfectly concentric in xy, butseems elongated in z - point spreadfunction PSF.best z-resolution 300-400 nmSperical aberrationxyxzChromatic aberrationyzThe different colors,located in the sameplace, are depictedcolocalized in xy ,but seem to be shiftedapart in z.(z-mismatch)
Fluorescent dyes with overlapping spectra Cross excitationThe excitation spectra of two fluorochromesare broad and overlapping to a significantextend - avoid this fluorochromecombination Bleed throughThe emission spectra of two fluorochromesare overlapping - measure the emissionsequentially Energy transferThe emission light of one dye stimulateexcitation of the second dye(- ideal only for FRET colocalizationstudies)exdapiemex/emfitc
Preparation of confocal sampesConfocal microscopy is an expensive and time consuming technique.Only good preparations are worth to be examamined. The higher resolutionpower of confocal microscopes has special demands on the sample:- i.e. collocation of structures in fixed cell cultures ! use freshly prepared buffered paraformaldehyde for fixation choose fluorochromes for optimal excitation and minimal crosstalk use water soluble embedding mediawhich polymerizes and contains antibleach-agent. use cover glass- set ups (cover glass thickness of 0,17 mm) use immersion objectives (oil or glycerol immersion)- i.e. observation of living cells Heatable table, clima chamber with CO2 gas control Inverse microscope: use glass bottom cell culture dishesand water- or glycerol-immersion objectives Upright microscope: use plastic dishes and dip-in objectives
Resolution controling factorsin confocal microscopyxy (image resolution) depends on emission wavelenght, numericalaperture of the objective, immersion medium, stability of the system,brightness/contrast-settings, pixel sizez (optical section thickness) depends on pinhole size, coverglassthickness (0,17 mm !!!), immersion mediumt (time resolution) depends on hardware parameters like scanningspeed! (spectral resolution) depends on spectrophotometric devise (SP)and/or beam splitters and filtersi (dynamic range) depends on bit-resolution
Decisions in signal detectionscanner, sampling time,averaging, xyz-resolution, .triangleof frustrationpinhole, pixel resolution,z-sampling, .detector, gain&offset,signal intensity, averaging,objective NA, .You allways have to decide what is the “must have” of yourexperiment. All settings have their benefits and limitations!Compromises in some respects are necessary. What is best,depends on the application requirements!
Only a very thin layer through the tissue is visualized. . Glycerol immersion allows deeper penetration into the sample without severe light loss or distortion. Oil immersion is ideal for imaging near the cover glass. o z o. Immersion media