Transcription
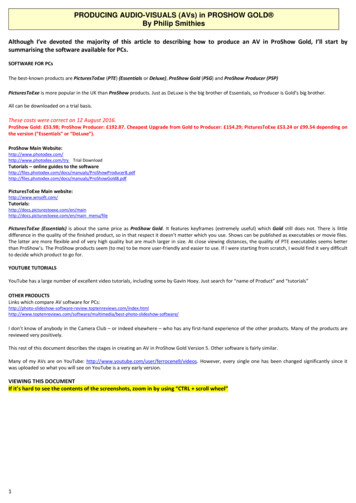
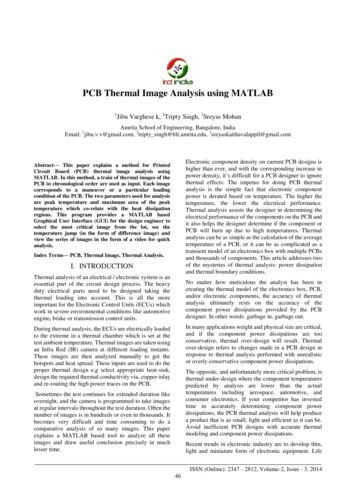
Transmission of material in this release is embargoed until8:30 a.m. (ET), Tuesday, March 15, 2022Technical information: (202) 691-7705 ppi-info@bls.gov www.bls.gov/ppiMedia contact:(202) 691-5902 PressOffice@bls.govUSDL 22-0466PRODUCER PRICE INDEXES – FEBRUARY 2022The Producer Price Index for final demand increased 0.8 percent in February, seasonally adjusted, theU.S. Bureau of Labor Statistics reported today. This rise followed advances of 1.2 percent in Januaryand 0.4 percent in December 2021. (See table A.) On an unadjusted basis, final demand prices moved up10.0 percent for the 12 months ended in February.In February, the advance in the index for final demand can be attributed to prices for final demandgoods, which rose 2.4 percent. The index for final demand services was unchanged.Prices for final demand less foods, energy, and trade services rose 0.2 percent in February following a0.8-percent increase in January. For the 12 months ended in February, the index for final demand lessfoods, energy, and trade services moved up 6.6 percent.Chart 1. One-month percent changes in selected PPI final demand price indexes, seasonally adjustedPercent al demandJulyAugSepOctFinal demand goodsNovDecJanFeb'22Final demand servicesChart 2. Twelve-month percent changes in selected PPI final demand price indexes, not seasonally adjustedPercent change15.012.09.06.03.00.0Feb'21MarAprMayFinal demandJuneJulyAugSepFinal demand goodsOctNovDecFinal demand servicesJanFeb'22
Final DemandFinal demand goods: Prices for final demand goods jumped 2.4 percent in February, the largest advancesince data were first calculated in December 2009. Two-thirds of the broad-based increase can be traced toan 8.2-percent rise in the index for final demand energy. Prices for final demand goods less foods and energyand for final demand foods also moved higher, 0.7 percent and 1.9 percent, respectively.Product detail: Nearly 40 percent of the February increase in prices for final demand goods can be attributedto the index for gasoline, which rose 14.8 percent. Prices for diesel fuel, electric power, jet fuel, motorvehicles and equipment, and dairy products also advanced. In contrast, the index for fresh and dry vegetablesdecreased 9.4 percent. Prices for beef and veal and for hot rolled steel sheet and strip also moved lower. (Seetable 2.)Final demand services: Prices for final demand services were unchanged in February after a 1.0-percentincrease in January. In February, a 1.9-percent rise in the index for final demand transportation andwarehousing services and a 0.2-percent advance in margins for final demand trade services offset a 0.4percent decrease in the index for final demand services less trade, transportation, and warehousing. (Tradeindexes measure changes in margins received by wholesalers and retailers.)Product detail: Within the index for final demand services in February, prices for truck transportation offreight moved up 2.0 percent. The indexes for food and alcohol retailing, machinery and vehicle wholesaling,transportation of passengers (partial), and outpatient care (partial) also rose. Conversely, prices for portfoliomanagement decreased 4.2 percent. The indexes for guestroom rental; apparel, jewelry, footwear, andaccessories retailing; automobile retailing (partial); and residential real estate loans (partial) also declined.2
Intermediate Demand by Commodity TypeWithin intermediate demand in February, prices for processed goods rose 1.6 percent, the index forunprocessed goods jumped 14.6 percent, and prices for services were unchanged. (See tables B and C.)Processed goods for intermediate demand: The index for processed goods for intermediate demandincreased 1.6 percent in February after climbing 2.0 percent in January. Leading the broad-based advance inFebruary, prices for processed energy goods rose 7.4 percent. The indexes for processed foods and feeds andfor processed materials less foods and energy moved up 1.9 percent and 0.1 percent, respectively. For the 12months ended in February, prices for processed goods for intermediate demand jumped 23.3 percent.Product detail: Over 40 percent of the February increase in prices for processed goods for intermediatedemand can be attributed to a 14.9-percent rise in the index for diesel fuel. Prices for gasoline, primary basicorganic chemicals, commercial electric power, nonferrous metals, and prepared animal feeds also advanced.In contrast, the index for hot rolled steel sheet and strip fell 16.0 percent. Prices for natural gas to electricutilities and for beef and veal also declined.Unprocessed goods for intermediate demand: Prices for unprocessed goods for intermediate demandmoved up 14.6 percent in February, the largest increase since rising 17.4 percent in January 2001. Ninetypercent of the broad-based advance in February can be traced to a 32.3-percent jump in the index forunprocessed energy materials. Prices for unprocessed foodstuffs and feedstuffs and for unprocessed nonfoodmaterials less energy also moved higher, 3.0 percent and 1.4 percent, respectively. For the 12 months endedin February, the index for unprocessed goods for intermediate demand climbed 35.1 percent.Product detail: Over two-thirds of the February advance in prices for unprocessed goods for intermediatedemand can be attributed to a 65.1-percent jump in the index for natural gas. Prices for crude petroleum;slaughter hogs; hay, hayseeds, and oilseeds; nonferrous scrap; and slaughter cattle also increased.Conversely, the index for raw milk decreased 8.7 percent. Prices for carbon steel scrap and for nonferrousmetal ores also moved lower.3
Services for intermediate demand: The index for services for intermediate demand was unchanged inFebruary following three consecutive advances. In February, a 0.8-percent increase in margins for tradeservices for intermediate demand and a 0.6-percent rise in prices for transportation and warehousing servicesfor intermediate demand offset a 0.4-percent decline in the index for services less trade, transportation, andwarehousing for intermediate demand. For the 12 months ended in February, prices for services forintermediate demand moved up 7.4 percent.Product detail: Among prices for services for intermediate demand in February, margins for hardware,building materials, and supplies retailing advanced 6.3 percent. The indexes for machinery and equipmentparts and supplies wholesaling; securities brokerage, dealing, and investment advice; truck transportation offreight; and paper and plastics products wholesaling also increased. In contrast, prices for gross rents forretail properties fell 6.8 percent. The indexes for portfolio management; loan services (partial); warehousing,storage, and related services; and chemicals and allied products wholesaling also decreased.Intermediate Demand by Production FlowStage 4 intermediate demand: Prices for stage 4 intermediate demand rose 0.5 percent in February aftermoving up 1.4 percent in January. In February, the index for total goods inputs to stage 4 intermediatedemand increased 1.3 percent. Conversely, prices for total services inputs fell 0.2 percent. (See table D.)Advances in the indexes for gasoline; diesel fuel; machinery and equipment parts and supplies wholesaling;commercial electric power; securities brokerage, dealing, and investment advice; and hardware, buildingmaterials, and supplies retailing outweighed declining prices for portfolio management, gross rents for retailproperties, and hot rolled steel sheet and strip. For the 12 months ended in February, the index for stage 4intermediate demand climbed 12.4 percent.4
Stage 3 intermediate demand: Prices for stage 3 intermediate demand increased 1.0 percent in Februaryfollowing a 1.5-percent rise in January. In February, the index for total goods inputs to stage 3 intermediatedemand advanced 1.8 percent, and prices for total services inputs edged up 0.1 percent. Increases in theindexes for diesel fuel, slaughter hogs, jet fuel, primary basic organic chemicals, gasoline, and arrangementof freight and cargo transportation outweighed decreasing prices for hot rolled steel sheet and strip, raw milk,and gross rents for retail properties. For the 12 months ended in February, the index for stage 3 intermediatedemand jumped 18.4 percent.Stage 2 intermediate demand: The index for stage 2 intermediate demand increased 6.5 percent in Februaryafter two consecutive declines. In February, prices for total goods inputs to stage 2 intermediate demandsurged 13.5 percent. In contrast, the index for total services inputs inched down 0.1 percent. Rising prices forgas fuels, crude petroleum, oilseeds, primary basic organic chemicals, nonferrous scrap, and arrangement offreight and cargo transportation outweighed decreases in the indexes for loan services (partial), ethanol, andcold rolled steel sheet and strip. For the 12 months ended in February, prices for stage 2 intermediate demandadvanced 19.6 percent.Stage 1 intermediate demand: Prices for stage 1 intermediate demand moved up 0.9 percent in Februaryfollowing a 1.2-percent increase in January. In February, the index for total goods inputs to stage 1intermediate demand rose 1.7 percent. Prices for total services inputs were unchanged. Advances in theindexes for diesel fuel; hardware, building materials, and supplies retailing; gasoline; primary basic organicchemicals; commercial electric power; and securities brokerage, dealing, and investment advice outweighedfalling prices for hot rolled steel sheet and strip, cold rolled steel sheet and strip, and gross rents for retailproperties. For the 12 months ended in February, the index for stage 1 intermediate demand climbed 16.4percent.The Producer Price Index for March 2022 is scheduled to be released on Wednesday, April 13,2022, at 8:30 a.m. (ET).*****5
Resampling of IndustriesEffective with the release of data for February 2022, the Producer Price Index (PPI) includes data for 10resampled industries classified according to the 2017 North American Industry Classification System(NAICS). The Bureau of Labor Statistics periodically updates the sample of producers providing datafor the PPI to reflect current conditions more accurately when the structure, membership, technology, orproduct mix of an industry shifts. The first results of this systematic process were published in July1986. Subsequent efforts have been completed at regular intervals.For information on index additions, deletions, and recodes effective February 2022, see the current issueof the PPI Detailed Report online at www.bls.gov/ppi/detailed-report/ or contact the PPI Section ofIndex Analysis and Public Information at ppi-info@bls.gov or (202) 299333441K336214336370621111IndustryDried and dehydrated food manufacturingHardwood veneer and plywood manufacturingOther millwork, including flooringOther pressed and blown glass and glasswareNonferrous metal (except copper and aluminum) rolling, drawing, and extrudingAmmunition manufacturing (except small arms), more than 30 mm.Capacitor, resistor, coil, transformer, and other inductor manufacturingTravel trailer and camper manufacturingMotor vehicle metal stampingOffices of physicians, except mental health6
Technical Notefrom the Benchmark Input-Output Accounts of the U.S. Inmany cases, the same commodity is purchased by differenttypes of buyers. As a result, commodities are often includedin several FD-ID indexes. For example, regular gasoline ispurchased for personal consumption, export, government use,and business use. The PPI program publishes only onecommodity index for regular gasoline (wpu057104), reflectingsales to all types of buyers, and this index is used in allaggregations regardless of whether the gasoline is sold forpersonal consumption, as an export, to government, or tobusinesses. Proportions based on BEA “Use of Commodities”data are used to allocate the correct portion of the total weightof gasoline to each use category. In cases when buyer type isan important price determining characteristic, indexes arecreated based on specific buyer type. For example, within thePPI category for loan services, separate indexes for consumerloans and business loans were constructed. For moreinformation relating to the FD-ID structure, see “A new,experimental system of indexes from the PPI program” in theFebruary 2011 Monthly Labor Review.Brief Explanation of Producer Price IndexesThe Producer Price Index (PPI) of the Bureau of LaborStatistics (BLS) is a family of indexes that measures theaverage change over time in prices received (price changes) byproducers for domestically produced goods, services, andconstruction. PPIs measure price change from the perspectiveof the seller. This contrasts with other measures, such as theConsumer Price Index (CPI). CPIs measure price changefrom the purchaser’s perspective.More than 10,000 PPIs for individual products and groupsof products are released each month. PPIs are available for theproducts of virtually every industry in the mining andmanufacturing sectors. Over time, new PPIs have beenintroduced for products of industries in the services andconstruction sectors of the U.S. economy. As of January 2018,the PPI covered 71 percent of services as measured by 2012Census revenue, and 31 percent of construction.More than 100,000 price quotations per month areorganized into three sets of PPIs: (1) Final demandIntermediate demand (FD-ID) indexes, (2) commodityindexes, and (3) indexes for the net output of industries andtheir products. The FD-ID structure organizes products byclass of buyer and degree of fabrication as well as by stage ofproduction. The commodity structure organizes products bysimilarity of end use or product type. The entire output ofvarious industries is sampled to derive price indexes for thenet output of industries and their products.Final Demand: The final demand portion of the FD-IDstructure measures price change for commodities sold forpersonal consumption, capital investment, government, andexport. The system is composed of six main price indexes:final demand goods; final demand trade services; final demandtransportation and warehousing services; final demandservices less trade, transportation, and warehousing; finaldemand construction; and overall final demand.The final demand goods index measures price change forboth unprocessed and processed goods sold to final demand.Fresh fruits sold to consumers and computers sold for capitalinvestment are examples of transactions included in the finaldemand goods price index. The final demand trade servicesindex measures price change for the retailing and wholesalingof merchandise sold to final demand, generally withouttransformation. (Trade indexes measure changes in marginsreceived by wholesalers and retailers.) The final demandtransportation and warehousing services index tracks pricechange for transportation of passengers, as well as,transportation of cargo sold to final demand, and also includesprices for warehousing and storage of goods sold to finaldemand. The final demand services less trade, transportation,and warehousing index measures price change for all servicesother than trade and transportation sold to final demand.Publishing, banking, lodging, and health care are examples ofthese services. The final demand construction index tracksprice change for new construction, as well as maintenance andrepair construction sold to final demand. Construction ofoffice buildings is an example of a commodity that would beincluded in the final demand construction index. Lastly, theoverall final demand index tracks price change for all types ofcommodities sold to final demand by combining the five finaldemand component indexes described above.Final Demand–Intermediate DemandIndexesThe PPI FD-ID structure measures price change forgoods, services, and construction sold to final demand and tointermediate demand. The FD-ID system replaced the PPIstage-of-processing (SOP) system as PPI’s primaryaggregation model with the release of data for January 2014.The FD-ID model expands coverage beyond that of the SOPsystem through the addition of services, construction, exports,and government purchases.Compared with finished goods under the SOP system, thePPI for final demand goods includes nearly a 50 percentexpansion of coverage. This increase can be traced to theaddition of government purchases and exports. For overallfinal demand, expansion to include final demand servicesrepresents an even larger increase in coverage. In December2017, final demand goods were about 33 percent of overallfinal demand, final demand services were roughly 65.5percent, and final demand construction was about 1.5 percentof final demand. Within intermediate demand, coverage ofservices for intermediate demand resulted in about a 45percent increase in coverage of the intermediate demandportion of the economy.FD-ID indexes are constructed from commodity-basedproducer output price indexes. Commodities are allocated toaggregate indexes primarily based on the type of buyer. Themain source of data used to determine the type of buyer is the“Use of commodities by industries, before redefinition,” tableIntermediate Demand: The intermediate demand portion ofthe FD-ID system tracks price change for goods, services, andconstruction products sold to businesses as inputs to7
intermediate demand index, for example, tracks price changefor inputs consumed, but not produced, by industries includedin the fourth stage of production. Hence, the index tracksprice change in inputs to industries that primarily producefinal demand commodities (stage 4 producers primarilyproduce commodities sold to final demand).Examples of heavily weighted goods-producing industriesin stage 4 include the manufacture of light trucks and utilityvehicles, automobiles, and pharmaceuticals. Retail trade, foodservice and drinking places, and hospitals are examples ofheavily weighted service industries included in stage 4. Stage4 also includes all new construction industries. Examples ofgoods consumed by stage 4 industries include motor vehicleparts, commercial electric power, plastic constructionproducts, biological products, and beef and veal. Engineeringservices, machinery and equipment wholesaling, long distancemotor carrying, and legal services constitute examples ofservices consumed by stage 4 industries.Examples of highly weighted goods-producing industriesincluded in stage 3 are motor vehicle parts manufacturing,animal (except poultry) slaughtering and processing, andsemiconductor manufacturing. Services industries classifiedin stage 3 include wholesale trade; insurance carriers;architecture, engineering, and related services; and hotels andmotels. Examples of goods consumed by stage 3 industriesinclude slaughter steers and heifers, industrial electric power,and hot rolled steel bars, plates, and structural shapes.Services commonly consumed by stage 3 industries includecommissions from sales of property and casualty insurance,business loans, temporary help services, and administrativeand general management consulting services.Petroleum refineries; electricity generation, transmission,and distribution; natural gas distribution; cattle ranching andfarming; and plastic materials and resin manufacturing areamong the goods-based industries assigned to stage 2.Services industries that are heavily weighted in stage 2 includemanagement of companies and enterprises; non-depositorycredit intermediation; insurance agencies and brokerages; andservices to buildings and dwellings. Goods commonlypurchased by stage 2 industries include crude oil, natural gas,formula feeds, and primary basic organic chemicals. Servicesthat are heavily weighted in the intermediate demand stage 2index are legal services, business loans, and cellular phone andother wireless telecommunication.Goods producing industries in stage 1 include oil and gasextraction, paper mills, and grain farming. Real estate, legalservices, and advertising services are examples of highlyweighted services industries included in stage 1. Examples ofgoods consumed by stage 1 industries are commercial andindustrial electric power and gasoline. Services commonlyconsumed by stage 1 industries include solid waste collection,chemicals and allied products wholesaling, and guestroom orunit rental. It should be noted that all inputs purchased bystage 1 industries are by definition produced either withinstage 1 or by latter stages of processing, leaving stage 1 lessuseful for price transmission analysis. For uction, excluding capital investment. The system includestwo parallel treatments of intermediate demand. The firsttreatment organizes intermediate demand commodities bytype. The second organizes intermediate demand commoditiesinto production stages, with the explicit goal of developing aforward-flow model of production and price change.The intermediate demand by commodity type portion ofthe system organizes commodities by similarity of product.The system is composed of six main price indexes:unprocessed goods for intermediate demand; processed goodsfor intermediate demand; intermediate demand trade services;intermediate demand transportation and warehousing services;intermediate demand services less trade, transportation, andwarehousing; and intermediate demand construction.The unprocessed goods for intermediate demand priceindex measures price change for goods sold to businesses asinputs to production that have undergone no fabrication. Crudepetroleum sold to refineries is an example of an unprocessedgood sold to intermediate demand. The processed goods forintermediate demand index tracks price change for fabricatedgoods sold as business inputs. Examples include car parts soldto car manufacturers and gasoline sold to trucking companies.The index for trade services for intermediate demandmeasures price change for the services of retailing andwholesaling goods purchased by businesses as inputs toproduction. The intermediate demand transportation andwarehousing services index measures price change forbusiness travel, as well as, transportation and warehousing ofcargo sold to intermediate demand. The intermediate demandservices less trade, transportation, and warehousing indexmeasures price change for services other than trade,transportation, and warehousing sold as inputs to production.Legal and accounting services purchased by businesses areexamples of intermediate demand services excluding trade,transportation, and warehousing. Finally, the construction forintermediate demand index measures price change forconstruction purchased by firms as inputs to production. Theindex for construction for intermediate demand tracks pricechange for maintenance and repair construction purchased byfirms.The production flow treatment of intermediate demand isa stage-based system of price indexes. These indexes can beused to study price transmission across stages of productionand final demand. This system is constructed in a manner thatmaximizes forward flow of production between stages, whileminimizing back-flow of production. The production flowtreatment contains four main indexes: intermediate demandstage 1, intermediate demand stage 2, intermediate demandstage 3, and intermediate demand stage 4.Indexes for the four stages were developed by firstassigning each industry in the economy to one of four stagesof production, where industries assigned to the fourth stageprimarily produce output consumed as final demand,industries in the third stage primarily produce outputconsumed by stage 4 industries, industries assigned to thesecond stage primarily produce output consumed by stage 3industries, and industries assigned to the first stage produceoutput primarily consumed by stage 2 industries. The fourindexes then track prices for the net inputs consumed byindustries in each of the four stages of production. The stage 48
Comparing the PPI with CPIaddition, most industries have secondary product indexes thatshow changes in prices received by establishments forproducts chiefly made in some other industry. Some industrieshave miscellaneous receipts indexes that track price changesfor other sources of revenue received by establishments withinthe industry that are not derived from sales of their products;for example, resales of purchased materials, or revenues fromparking lots owned by a manufacturing plant.Although some data users utilize the PPI as a potentialindicator of the Consumer Price Index (CPI), there are manyreasons why the PPI and the CPI may diverge. The scope ofthe personal consumption portion of the PPI includes allmarketable output sold by domestic producers for households.The scope of the CPI includes goods and services provided bybusiness or government, where explicit user charges are paidby consumers. For example, the most heavily weighted item inthe CPI, owners’ equivalent rent, is excluded from the PPI.The scope of the CPI includes imports. The PPI excludesimports. The CPI only includes components of personalconsumption directly paid for by the consumers, while the PPIincludes components of personal consumption that may not bepaid for by consumers. For example, the PPI includes medicalservices paid for by third parties. In contrast to CPI, PPI doesnot completely cover services. PPIs exclude taxes, since theydo not represent producer revenue. Conversely, sales and othertaxes paid by consumers are part of household expenditure andare included in the CPI. Additional technical differencesbetween PPI and CPI also exist. For more information see“Comparing new final demand producer price indexes withother Government price indexes,” Monthly Labor Review,January 2014, at www.bls.gov/opub/mlr/.Data CollectionPPIs are constructed using selling prices reported byestablishments of all sizes, selected by probability sampling,with the probability of selection proportionate to size.Individual items and transaction terms also are chosen byprobability proportionate to size. BLS strongly encouragescooperating companies to supply actual transaction prices atthe time of shipment to minimize the use of list prices. Pricessubmitted by survey respondents are effective on the Tuesdayof the week containing the 13th day of the month. The surveyis conducted online via the BLS Internet Data CollectionFacility (IDCF).Price data are provided on a voluntary and confidentialbasis; only sworn BLS employees are allowed access toindividual company price reports. BLS publishes priceindexes instead of actual prices. All PPIs are subject tomonthly revisions up to 4 months after original publication toreflect the availability of late reports and corrections byrespondents.BLS periodically updates the PPI sample of surveyrespondents to better reflect current conditions when thestructure, membership, technology, or product mix of anindustry shifts significantly and to spread reporting burdenamong smaller firms. Information on these resampling effortsare noted in the PPI News Release and PPI Detailed Report inthe months they occur.As part of an ongoing effort to expand coverage to sectorsof the economy other than mining and manufacturing, anincreasing number of service and construction sectorindustries have been introduced into the PPI. The followinglist of industries introduced since the mid-1990s includes themonth and year in which an article describing the industry’scontent appeared in the PPI Detailed Report.Commodity IndexesThe commodity classification of the PPI organizes goods,services, and construction by similarity of product or end use,disregarding industry of origin. With the release of data forJuly 2009, PPI expanded its commodity structure to includeindexes for services and construction products. Prior to thisdate, the PPI commodity structure only included productsfrom goods producing sectors. Table 9 of the PPI DetailedReport includes data for commodity indexes, organized in ahierarchal structure, including major groupings, subgroups,product classes, sub-product classes, and individual items.Industry Net-Output Price IndexesPPIs for the net output of industries and their products aregrouped according to the North American IndustryClassification System (NAICS). Prior to the release ofJanuary 2004, industry-based PPIs were published accordingto the Standard Industrial Classification (SIC) system.Industry price indexes are compatible with other economictime series organized by industry, such as data onemployment, wages, and productivity. Table 11 of the PPIDetailed Report includes data for NAICS industries andindustry groups (3-, 4-, 5-, and 6-digit codes), Census productclasses (7- and 8-digit codes), products (9-digit codes), moredetailed sub-products (11-digit codes), and, for someindustries, indexes for other sources of revenue.Indexes may represent one of three kinds of productcategories. Every industry has primary product indexes thatshow changes in prices received by establishments classifiedin the industry for products made primarily, but notnecessarily exclusively, by that industry. The industryclassification of an establishment is determined by whichproducts make up a plurality of its total shipment value. InService and construction sector industries introduced into theProducer Price Index, by SIC or NAICS code and the PPI DetailedReport that announces their introductionPPI DetailedTitleCodeReport IssueSIC9Wireless telecommunications .4812July 1999Telephone communications, exceptradio telephone .Television broadcasting .48134833July 1995July 2002Grocery stores .5411July 2000Meat and fish (seafood) markets .5421July 2000Fruit and vegetable markets .5431J
5 Stage 3 intermediate demand: Prices for stage 3 intermediate demand rose 0.4 percent in December following a 0.8-percent advance in November. In December, the index for total services inputs to stage 3 intermediate demand moved up 0.8 per