Transcription
Introduction to Geology and Resources ofGold, and Geochemistry of GoldU.S. GEOLOGICAL SURVEY BULLETIN 1857-A
AVAILABILITY OF BOOKS AND MAPS OF THE U.S. GEOLOGICAL SURVEYInstructions on ordering publications of the U.S. Geological Survey, along with prices of the last offerings, are given in the current-year issues of the monthly catalog "New Publications of the U.S. Geological Survey." Prices of available U.S. Geological Survey publications released prior to the current year are listed in the most recent annual "Price and Availability List." Publicationsthat are listed in various U.S. Geological Survey catalogs (see back inside cover) but not listed in the most recent annual "Price andAvailability List" are no longer available.Prices of reports released to the open files are given in the listing "U.S. Geological Survey Open-File Reports," updated monthly, which is for sale in microfiche from the U.S. Geological Survey, Books and Open-File Reports Section, Federal Center, Box25425, Denver, CO 80225. Reports released through the NTIS may be obtained by writing to the National Technical InformationService, U.S. Department of Commerce, Springfield, VA 22161; please include NTIS report number with inquiry.Order U.S. Geological Survey publications by mail or over the counter from the offices given below.BY MAILOVER THE COUNTERBooksProfessional Papers, Bulletins, Water-Supply Papers, Techniquesof Water-Resources Investigations, Circulars, publications of general interest (such as leaflets, pamphlets, booklets), single copies of Earthquakes& Volcanoes, Preliminary Determination of Epicenters, and some miscellaneous reports, including some of the foregoing series that have goneout of print at the Superintendent of Documents, are obtainable by mailfromU.S. Geological Survey, Books and Open-File ReportsFederal Center, Box 25425Denver, CO 80225Subscriptions to periodicals (Earthquakes & Volcanoes andPreliminary Determination of Epicenters) can be obtained ONLY fromtheSuperintendent of DocumentsGovernment Printing OfficeWashington, D.C. 20402(Check or money order must be payable to Superintendent of Documents.)BooksBooks of the U.S. Geological Survey are available over thecounter at the following Geological Survey Public Inquiries Offices, allof which are authorized agents of the Superintendent of Documents:WASHINGTON, D.C.-Main Interior Bldg., 2600 corridor,18th and CSts.,NW.DENVER, Colorado-Federal Bldg., Rm. 169,1961 Stout St.LOS ANGELES, California-Federal Eldg., Rm. 7638,300 N.Los Angeles St.MENLO PARK, California-Bldg. 3 (Stop 533), Rm. 3128,345MiddlefieldRd.RESTON, Virginia-503 National Center, Rm. 1C402,12201Sunrise Valley Dr.SALT LAKE CITY, Utah-Federal Bldg., Rm. 8105,125South State St.SAN FRANCISCO, California-Customhouse, Rm. 504,555Battery St.SPOKANE, Washington-U.S. Courthouse, Rm. 678, West920 Riverside Ave.ANCHORAGE, Alaska-Rm. 101,4230 University Dr.ANCHORAGE, Alaska-Federal Bldg, Rm. E-146,701 C St.MapsFor maps, address mail orders toU.S. Geological Survey, Map DistributionFederal Center, Box 25286Denver, CO 80225Residents of Alaska may order maps fromAlaska Distribution Section, U.S. Geological Survey,New Federal Building - Box 12101 Twelfth Ave., Fairbanks, AK 99701MapsMaps may be purchased over the counter at the U.S. Geological Survey offices where books are sold (all addresses in above list) andat the following Geological Survey offices:ROLLA, Missouri-1400 Independence Rd.DENVER, Colorado-Map Distribution, Bldg. 810, FederalCenterFAIRBANKS, Alaska-New Federal Bldg., 101 Twelfth Ave.
Chapter AIntroduction to Geology and Resources ofGold, and Geochemistry of GoldThe Case for Gold An Introduction to Geologyand Resources of Gold in the United StatesBy DANIEL R. SHAWEGeochemistry of Gold in Hydrothermal DepositsBy SAMUEL B. ROMBERGERU.S. GEOLOGICAL SURVEY BULLETIN 1857GEOLOGY AND RESOURCES OF GOLD IN THE UNITED STATESDANIEL R. SHAWE and ROGER P. ASHLEY, Scientific EditorsLM.H. CARTER, Technical Editor
U.S. DEPARTMENT OF THE INTERIORMANUEL LUJAN, JR., SecretaryU.S. GEOLOGICAL SURVEYDallas L. Peck, DirectorAny use of trade, product, or firm names in this publication is for descriptivepurposes only and does not imply endorsement by the U.S. Government.UNITED STATES GOVERNMENT PRINTING OFFICE: 1988First printing 1988Second printing 1991For sale by theBooks and Open-File Reports SectionU.S. Geological SurveyFederal CenterBox 25425Denver, CO 80225Library of Congress Cataloging-in-Publication DataGeology and resources of gold in the United States.(U.S. Geological Survey bulletin : 1857)Supt. of Docs. no. : I 19.3:1857-ABibliography: p.Contents: ch. A. Introduction to geology and resources of gold, andgeochemistry of gold.1. Gold ores United States. 2. Geochemistry United States.I. Shawe, Daniel R., 1925- . II. Ashley, Roger P. (Roger Parkmand),1940- . III. Carter, LM.H. IV. Series.QE75.B9no. 1857, etc.[QE390.2.G65]557.3s [553.4'1'0973]88-600238
CONTENTSThe case for gold An introduction to geology and resourcesof gold in the United d as a store of wealth the uses of goldA2How much gold?A2Factors influencing the price and production of goldThe role of gold in world monetary systemsA6Where gold comes fromA6Scope of this series, and conventions usedA7References citedA8A3Geochemistry of gold in hydrothermal depositsAbstractA9IntroductionA9Nature and source of solutionsA9Sources for goldA12Mechanisms of gold transport and depositionReferences citedA22A15FIGURESAl.A2.A3.A4.A5.A6.A7.A8.Chart showing gold production, United States consumer price index, andprice of gold, 1845-1987A4Schematic diagram of hydrothermal mineralizing environmentA10Schematic diagram of generation of a mineralizing solutionA12Schematic diagram of processes responsible for releasing gold to leachablesites in a source rockA12Periodic table of the elements illustrating relationship between gold, silver,and copperA13Graph calculating volume of source rock required to form gold depositscontaining various amounts of goldA15Eh-pH diagram for Au-Cl-H2O system at 25 C and aqueous chlorideconcentration of 20 ppmA16Oxygen activity-pH diagram for the system Au-NaCl-S-H2O: relativesolubilities of gold chloride and bisulfide complexesA17ContentsIII
A9.A10.All.A12.A13.A14.Oxygen activity-pH diagram for the system Au-Fe-NaCl-S-H2O: relativestabilities of iron minerals and goldA18Oxygen activity-sulfur activity diagram for the system Au-Fe-NaCl-S-H 2 O:relative stabilities of iron minerals and goldA19Oxygen activity-pH diagram for the system Au-Fe-CaO-K2O-Al2O3-SiO2NaCl-C-S-H2 O: relative stabilities of aluminosilicate alteration minerals andcarbon, and relative stabilities of iron minerals and goldA19Oxygen activity-sulfur activity diagram for the system Au-Fe-As-NaCl-C-S-H2O:relative stabilities of arsenic and carbon phases and relationships offigure A10A20Oxygen activity-sulfur activity diagram for the system Au-Fe-As-NaCl-S-H2O:relative stability field of arsenopyrite, and relationships offigure A10A21Gold solubility versus oxygen activity diagram showing solution path duringoxidationA22TABLESAl. Temperatures of formation and salinities for selected epithermal preciousmetal deposits AllA2. Summary of gold contents for selected rock typesA14A3. Partial list of aqueous gold species occurring in natural systemsA16IVContents
GEOLOGY AND RESOURCES OF GOLD IN THE UNITED STATESIntroduction to Geology and Resources of Gold, andGeochemistry of GoldThe Case for Gold An Introduction to Geology and Resources ofGold in the United StatesBy Daniel R. ShaweAbstractGold has long been a store of wealth, whether held bygovernments or in private hoards. Of the total of about 3billion troy ounces of gold that has been mined worldwidethrough man's history, about one-third is held by centralbanks, another third is held privately, and the last third isfabricated in jewelry (also a store of wealth) and in formsuseful in industries such as electronics and dentistry.Since the British Gold Standard was established in1717, the price of gold generally has been fixed officially, andthus it has tended to remain stable. The U.S. Congress in1792 adopted a gold standard of 19.39 per troy ounce,which lasted to 1834 when the official price was set at 20.67.In 1934 the official U.S. price (effectively, the world price) wasraised to 35 per ounce. At times during this long period ofstable gold price, aberrations such as the American Civil Warand financial panics caused either temporary de factoabandonment of the gold standard or suspension of speciepayments. The U.S. government declared a de factoabandonment of the standard in 1968 and then an officialabandonment in 1971, at the time of the collapse of theBretten Woods Agreement, which had established the U.S.dollar as the world's monetary standard at gold parity of 35per ounce. Thereafter, the world gold price rose rapidly. Apeak of 850 per ounce was reached in January 1980; sincethen the price has settled in the range of 300- 500 perounce.Gold production in the United States prior to 1848 wasless than 2 metric tons annually. Discovery of gold in California in that year led to annual production of 60-100 metricPublication approved by the Director, U.S. Geological Survey,April 26, 1988.tons during the 1850's. Gold production gradually declinedthereafter, until discoveries in South Dakota, Alaska, Colorado, and Nevada provided new sources to help finance thecountry's expanding economy, culminating in peak annualproduction of more than 150 metric tons just before WorldWar I. Following the war, production declined sharply, untilthe depression of the early 1930's and the gold price increasein 1934 again stimulated gold mining. An all time high inannual gold production of 187 metric tons was reached justprior to World War II. The government order restricting goldmining in the United States during the war resulted in aprecipitous drop in annual production to less than 50 metrictons. After the war, a brief increase in annual productiontailed off into a gradually declining trend near 50 metric tonsannually. The rapid price increases in the 1970's were notmatched by increased gold production until 1981, reflectingthe long lead times required to develop gold mines. Annualgold production in the United States presently again exceeds100 metric tons.Because of the importance of gold as a store of wealth,and because of the historical bond between gold and money,it is hoped that the descriptions of the geology of goldprovided in this series will help increase the supply of gold,and thus they may also benefit the world's monetarysystems.Gold has been mined throughout the world from a greatvariety of types of deposits and of all geologic ages.Excepting placers, most of the world's gold production hascome from Precambrian terranes, and commonly from deepgeologic environments. In the United States most productionhas come from deposits of younger geologic age andshallower geologic environments. Aside from theIntroduction to Geology and Resources of Gold, and Geochemistry of GoldA1
Precambrian-age Homestake deposit at Lead, South Dakota,the United States' largest producer, most of the major golddeposits are of Mesozoic and younger age. They occurpredominantly in intermediate to shallow geologic environments such as the mid-level quartz-vein system of theCalifornia Mother Lode and numerous porphyry-coppersystems of the Western United States, and shallow-levelbonanza-type deposits such as the Comstock Lode inNevada and Cripple Creek in Colorado, and recently, avariety of disseminated deposits mostly in Nevada.This series describing the geology of gold deposits inthe United States consists of chapters on the geochemistry ofgold, the distribution of gold in the United States, descriptions of major gold terranes, and descriptions ofindividual deposits or districts. Deposits are grouped asthose in metamorphic rocks; mesozonal deposits consistingof polymetallic replacements and veins, porphyry coppersystems, and mid-level gold-quartz veins; a variety of epizonal deposits, including bonanza and disseminated types;and placer deposits.INTRODUCTIONThe value of gold in international political andcommercial relations makes a secure and substantialdomestic source of gold a significant national asset. Thisseries is being prepared in the belief that a broaderunderstanding of the geologic occurrence of gold willassure a more extensive and a more efficient exploitationof this valuable resource, and thereby contribute to thenational well-being.ACKNOWLEDGMENTSA.R. Wallace, G.A. Desborough, T.A. Steven, andR.P. Ashley of the U.S. Geological Survey, and I.E.Tilton of the Mineral Economics Department, ColoradoSchool of Mines, Golden, Colo., have offered mesuggestions that have materially improved this introductory report.In addition to the authors of reports in this series,many people have contributed to its preparation. Initialplanning was by R.P. Ashley, W.F. Cannon, A.V. Heyl,T.P. Miller, W.C. Prinz, D.R. Shawe, J.F. Slack, R.B.Taylor, and E.W. Tooker, all of the U.S. GeologicalSurvey. D.R. Shawe and R.P. Ashley coordinated workon the series. R.B. Taylor and E.W. Tooker providedmuch useful advice and suggestions during preparationof the series. V.E. Swanson edited several manuscripts.D.P. Buscher computer-drafted many of the illustrationsusing the U.S. Geological Survey's GSDRAW system.GOLD AS A STORE OF WEALTHTHE USES OF GOLDGold has been prized by man from distantprehistory because of its beauty, rarity, and durability.A2Geology and Resources of Gold in the United StatesFrom its use as an article of adornment, it grew to be astable item of trade and eventually became what is nowcalled money. Other metals and printed (paper) money,however, now have replaced gold coinage in circulationworldwide. Though in theory these substitutes representa reserve of gold that is held as backing by the issuer ofthe substitute money, in fact, this support of money bymeans of a gold reserve is seldom strictly true. Nevertheless, with the organization of industrialized nationsand the development of international commerce, goldbecame the primary instrument for settlement ofinternational debt, whether used in direct payment, or asbacking, officially or de facto, for national currencies(that is, as monetary reserves). Thus gold is accumulatedand held as reserves by national banking institutions, theso-called central banks. But individuals worldwidecommonly do not trust the vagaries of national andinternational politics and economics, and of wars, andthey prefer to hold their own reserves as private hoards ofgold. Whether held privately, or as a public hoard, goldhas long been a store of wealth.With modern advances in technology, gold now isfinding more and more industrial uses, particularly inelectronics. However, with respect to the total store ofgold the amount involved in industrial uses is minor, andlikely to remain so. Because of the high price of gold,industrial applications tend to use very small amounts ofgold.Of the total gold available in the world todaywhich represents virtually all the gold that has ever beenmined about one-third is held by national central banksand other official agencies such as the World Bank andthe International Monetary Fund as a support, albeitimperfect, for monetary systems. At the end of 1983central bank gold holdings were about 35,000 metric tons(Mining Journal, March 8,1985). Another third is held inprivate hoards, as a hedge against inflation and suddendomestic or international instabilities, or for speculationpurposes. The last third is in jewelry (in some respects astore of wealth) and in other fabricated uses such as inthe electronics industry and dentistry (Stoehr, 1984;Davenport, 1981).HOW MUCH GOLD?Probably at least 5,000 years have passed since thefirst gold was mined on this planet, during which timeslightly more than 3 billion troy ounces (about 94,000metric tons; fig. Al) have been produced. Most of thishas been produced since A.D. 1500 (Kavanagh, 1976),and about half of the total has been mined within the last35 years (Stoehr, 1984). The increasing quantity ofavailable gold was highlighted by Stoehr (1984) in thefollowing figures: assuming an even distribution of allavailable gold among all living persons on the planet, in
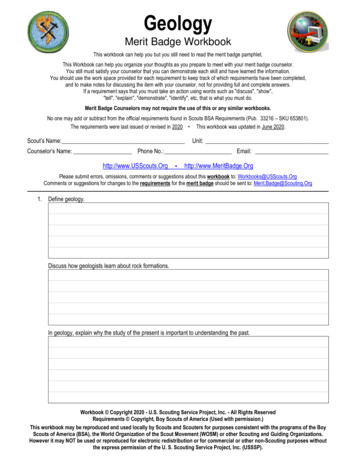
the year 1800 there was 0.14 oz per person, in 1900 0.31oz, in 1980 0.71 oz, and projected at current trends to2000 there will be about 1 oz per person. Thisremarkable acceleration in gold production has resultedfrom improved extraction technology and a better understanding of the geologic environments of gold, coupledwith an ever-increasing demand that in recent years hassubstantially increased the price of gold.Despite the long-term increase in gold productionworldwide, gold mining has been sporadic through timeand from locale to locale, owing in part to nature'suneven allotment of gold to different geologic environments and to man's unstable political and economicactivities. Figure Al shows the production of gold in theUnited States and in the world during the period1845-1987.FACTORS INFLUENCING THE PRICEAND PRODUCTION OF GOLDThe British Gold Standard was established in 1717by Sir Isaac Newton, then Master of the Mint, at 4.248per troy ounce. The standard lasted for more than 2centuries. In 1792 the U.S. Congress adopted a bimetallic(gold-silver) standard for the new Republic, fixing theprice of gold at 19.39 per troy ounce (U.S. gold pricehistory from Cycles, 1981) at a fixed ratio of 1 to 15 goldto silver, at parity with the British pound sterling. TheUnited States suspended specie (coinage, particularly ofgold and silver) payments in August 1814 following theWar of 1812 with Great Britain, and resumed them inFebruary 1817. The gold price then remained constant at 19.39 until 1834, when because of inflation a new pricewas set at 20.67, at a fixed ratio of 1 to 16 gold to silver.The financial panic of 1837 brought on a one-yearsuspension of specie payments. Specie payments alsowere suspended briefly during the panic of 1857. TheCivil War brought on a further specie suspension inDecember 1861 which lasted until 1879. Unofficial goldprices soared during the war (fig. Al) but droppedsubstantially on "Black Friday," September 24, 1869, atthe time of the "silver panic." With the panic of 1873, theU.S. adopted a de facto gold standard that brought thegold price down close to its earlier fixed price.In January 1874, Congress provided for redeemability of paper money in gold effective January 1879.This action did not generate a rush for gold, but insteadit induced an increase in gold deposits in banks and anincreased demand for government securities (Wormser,1967), because of the strengthening effect of the goldbacking upon the nation's monetary system. Thus, speciepayments were resumed in 1879 at 20.67 per troy ounce,and in 1900 the U.S. again officially (de jure) adopted thegold standard. During World War I, between September1917 and June 1918, free export of gold from the UnitedStates was prohibited. Following World War I in 1919Britain was forced off the gold standard because ofinflation that diminished the value of gold. Gold prices inBritain, as well as in South Africa where the world's mostsignificant gold production was already underway,thereafter improved gradually until 1925, when Britainand South Africa, with inflation controlled, returned tothe old standard of 4.248 per troy ounce. Then in March1933, following the 1929 stock market crash and collapseof the Federal banking system in the United States, theCongress prohibited U.S. citizens from owning gold, andthe administration in January 1934 fixed the official priceof gold at 35.00 per troy ounce. But by the end of 1932the Great Depression had already destroyed the goldstandard in Britain. As a consequence, the gold pricethere rose to 8.40 per troy ounce by January 1940,where it was fixed through World War II. In 1944 as aresult of the Bretten Woods Agreement, the U.S. dollarbecame the world's monetary standard at gold parity of 35 per ounce (data in part from Mining Journal, Dec.1986 suppl.) .In 1968 the U.S. government declared a de factoabandonment of the gold standard, and within 3 years theprice increased slightly to about 40 per troy ounce. TheBretten Woods system collapsed in 1971 (Lehrman,1986). At that time also the United States officially (dejure) came off the gold standard, and citizens were againallowed to own gold, and thereafter the price roserapidly. A significant increase in the price of gold to anaverage of about 160 per ounce followed the oilproducing and exporting countries' (OPEC's) fourfoldincrease in oil prices in 1973. After a temporary declineto 115 in 1976, the gold price soared to a peak of 850per troy ounce in January 1980, following further oilprice increases, the U.S.S.R.'s invasion of Afghanistan,the Iranian revolution and occupation of the U.S.Embassy in Teheran, and general worldwide economicuncertainty. The average price for the entire year of 1980was well above 600 per ounce. Since 1980, and inresponse to several factors including a strong U.S. dollar,a drop in oil prices, and a drop in interest rates, the priceof gold declined, somewhat erratically, to an averageprice of about 315 per ounce in 1985. With a weakeningdollar and new increases in oil prices and interest rates,the price of gold again climbed, and in May 1987 wasabove 450 per ounce, where it now (December 1987)rests.Gold production in the United States prior to 1848was less than 2 metric tons annually (fig. Al). Discoveryof gold in California in that year led to the great gold rushof 1849, following which, up to the beginning of the CivilWar, 60 to nearly 100 metric tons (in 1853) of gold wereproduced annually. This period was that of peak production from the California goldfields, where placer production exceeded lode production by a margin of 2 to 1.Introduction to Geology and Resources of Gold, and Geochemistry of GoldA3
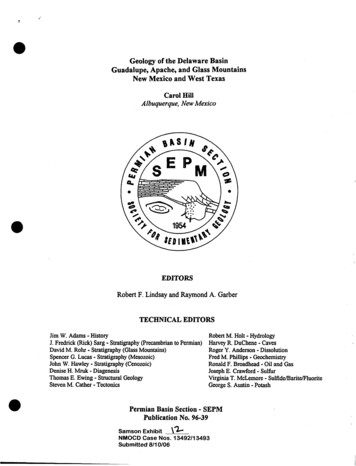
oowOOI Daft)Oo DooooooDOLLARSoo01ooa ooooooMETRIC TONS-JOoCDoo
Depletion of the placers and new laws constrainingplacer mining were major factors in the subsequentdecline in production. During the Civil War, andfollowing the prewar decline in California gold production, U.S. production temporarily increased asunofficial gold prices soared. Although the ComstockLode (Nevada), which was discovered in 1859, producedsilver that financed a large part of the Union's war costs(for example, Smith, 1943), as well as substantial gold, ithad little effect on the immediately prewar decline in goldproduction. Likewise the discoveries of the Homestakedeposit in 1876, the Juneau goldfields in 1880, the Yukonplacers in 1882, and the Cripple Creek (Colorado)district in 1891 had no immediate effect on a graduallybut erratically falling U.S. gold production. However, by1893 the cumulative effect of the newly discoveredsources of wealth, spurred by an ever-growing need forcapital to finance a rapidly expanding U.S. economy,sharply increased gold production.The financial panics in the United States in 1857,1869, and 1873 had little effect on production of gold. Ineach instance the panics occurred during or just prior toperiods of declining gold production. The 1857 panic wasin a period in which gold specie payments continued,whereas the 1869 and 1873 panics were in a period inwhich specie payments were suspended, and unofficialgold prices were substantially higher than the fixed priceof gold (fig. Al).Discovery of the Nome (Alaska) gold placers in1897, the Tonopah (Nevada) gold-silver district in 1900,and the Goldfield (Nevada) district and the Fairbanks(Alaska) placers in 1902 added impetus to U.S. goldproduction, which soared into the range of 100 to morethan 150 metric tons annually during the years1899-1918. This period saw peaks of production of goldfrom Cripple Creek, Fairbanks, Nome, Tonopah,Goldfield, and the Comstock Lode (Koschmann andBergendahl, 1968).During World War I, gold production droppedappreciably, under a fixed price. A precipitous dropFigure A1 (facing page). Annual world and United Statesgold production, United States consumer price index, andyearly average price (per troy ounce of gold), 1845-1987.World gold production from Ridgway (1929), Ryan (1965),Anonymous (1982), Anonymous (1986), and various issuesof Mining Journal (1980-1987); U.S. gold production fromU.S. Geological Survey (1883-1923), U.S. Bureau of Mines(1924-1931), U.S. Bureau of Mines (1932-1984), and variousissues of Mining Journal (1980-1987); U.S. consumer priceindex from U.S. Bureau of the Census (1970) and Facts onFile Yearbook (1971-1986); price of gold (average annualprice for 1968-1987) from Cycles (1981) and various issuesof Mining Journal (1980-1987); dotted interval 1861-1879indicates "unofficial" or black market price during andfollowing the Civil War.occurred in 1918, following the United States entry intothe war and the prohibition of the export of gold. Goldproduction generally declined until the stock marketcrash of 1929. Gold production then rapidly increased,culminating at the start of World War II in the largestannual production of gold ever in the United States. Thisburgeoning gold production was accelerated in 1934 bythe official increase of almost 70 percent in the fixedprice of gold. Resurgence of gold mining, following thefinancial crash of 1929 and with the impetus of the 1934price increase, was made possible by the large reserves ofgold still available in the Yukon placers, the AlaskaJuneau lode mine, the Mother Lode mines, theHomestake mine, and lesser districts in Idaho (forexample, the Boise Basin), Montana (Virginia City-AlderGulch), Nevada (Eureka; the Comstock), New Mexico,Oregon, and Washington (Republic). Porphyry copperdeposits in Utah, Arizona, Montana, Nevada, and NewMexico also contributed substantial byproduct goldduring this period.An all-time high in annual U.S. gold production ofabout 187 metric tons was reached in 1940, just prior toUnited States entry into World War II. The mostcatastrophic drop in gold production in U.S. history cameduring World War II, a period of constant gold price,following the government order that closed downdomestic gold mines. When the ban on gold mining waslifted at the end of the war, gold production spurtedmomentarily and then declined irregularly as inflationeroded the value of the fixed gold price of 35 per oz.Production never again reached its prewar level, for inaddition to the damping effect of inflation, mining couldnot resume in many of the abandoned mines whoseworkings were caved or flooded. Discovery of the Carlingold deposit in 1962 and its early production starting in1965 had little influence on the overall U.S. production ofgold. In spite of sharply rising gold prices and increasingdiscoveries in the years 1973-1980, production of goldcontinued to fall.Figure Al shows that production of gold in theUnited States between 1845 and the end of World War IIclosely paralleled that in the rest of the world. However,after a momentary spurt that followed the war, goldproduction in the United States gradually decreased upto 1980; during the same period, world productionsoared. The discrepancy probably can be attributed toseveral factors, including high U.S. wages relative to therest of the world, and the fact that gold mines worldwideexcept in the United States were generally maintainedduring the war. By 1981, even though prices began todrop substantially, gold production rose sharply and itcontinues to rise. Much of the lag in production can beattributed to the long lead times required to put new goldmines into production. Exploration and developmentspurred by the gold price increases between 1973 andIntroduction to Geology and Resources of Gold, and Geocnemistry of GoldA5
1980 did not begin to reach fruition until 1981.Moreover, a significant advance in the technology of goldextraction during the past decade, notably the development of cyanide heap leaching (Nettesheim, 1987), hasgreatly accelerated the production of gold in the UnitedStates.THE ROLE OF GOLD IN WORLDMONETARY SYSTEMSThe importance of gold as a store of wealth,including its role in world monetary systems, is theprincipal driving force that leads to efforts to find andproduce gold. This series, intended to provide a morethorough understanding of the geology of gold andconsequently an increase in the supply of gold, thus mayhave a bearing on gold's influence upon world monetarysystems. This brief discussion is not intended to showwhat the interrelationships of gold and monetary systemsought to be, but instead it is meant only to emphasize thehistorical bond between gold and money.The interrelationships between gold and monetarysystems are complex and have long been debated;opinions are far from unanimous. Nevertheless, there is ageneral recognition that a tie exists between the two. Theconnection has been expressed in many ways. Forexample: "Whatever mineral you have in your mine, youare mining for gold" (Mining Magazine, July, 1985, p. 5)."The price of gold***is determined not only by thesupply and demand for gold, but by the supply anddemand for money" (Wall Street Journal, Sept. 4, 1986,p. 26). "If there is success in restoring price stability andconfidence in our currency, tighter linkage of ourmonetary system to gold may well become supererogatory" (U.S. Gold Commission, as reported byMining Journal, April 30, 1982, p. 5). "Under fixedexchange rates based on a true international goldstandard, even during periods of very rapid growth asduring the first century and a half of the IndustrialRevolution global financial balance is maintained byvirtue of the fact that total international reserves increasethrough increased gold production, not increased dollar(or other reserve-currency) debt" (Lehrman, 1986).Inasmuch as monetary systems are extension
Residents of Alaska may order maps from Alaska Distribution Section, U.S. Geological Survey, New Federal Building - Box 12 101 Twelfth Ave., Fairbanks, AK 99701 OVER THE COUNTER Books Books of the U.S. Geological Survey are available over the counter at the

![[IV‐ADV‐9‐A] Tips and Tricks for Payroll and Human Resources](/img/9/tips-and-tricks-payroll-and-hr.jpg)