Transcription
USMLE STEP 1Lecture Notes 2018Behavioral Science and Social SciencesUSMLE Step 1 Behavioral Science.indb 19/18/17 11:43 AM
USMLE is a joint program of the Federation of State Medical Boards (FSMB) and the National Board ofMedical Examiners (NBME), neither of which sponsors or endorses this product.This publication is designed to provide accurate information in regard to the subject matter covered asof its publication date, with the understanding that knowledge and best practice constantly evolve. Thepublisher is not engaged in rendering medical, legal, accounting, or other professional service. If medicalor legal advice or other expert assistance is required, the services of a competent professional should besought. This publication is not intended for use in clinical practice or the delivery of medical care. To thefullest extent of the law, neither the Publisher nor the Editors assume any liability for any injury and/ordamage to persons or property arising out of or related to any use of the material contained in this book. 2018 by Kaplan, Inc.Published by Kaplan Medical, a division of Kaplan, Inc.750 Third AvenueNew York, NY 1001710 9 8 7 6 5 4 3 2 1Course ISBN: 978-1-5062-2825-9All rights reserved. The text of this publication, or any part thereof, may not be reproduced in any mannerwhatsoever without written permission from the publisher. This book may not be duplicated or resold,pursuant to the terms of your Kaplan Enrollment Agreement.Retail ISBN: 978-1-5062-3953-8Kaplan Publishing print books are available at special quantity discounts to use for sales promotions,employee premiums, or educational purposes. For more information or to purchase books, please call theSimon & Schuster special sales department at 866-506-1949.USMLE Step 1 Behavioral Science.indb 29/18/17 11:43 AM
EditorsEpidemiology, Statistics, Behavioral ScienceAlice Akunyili, MDAssociate Director of Clinical AcademicsKaplan MedicalNew York, NYAlina Gonzalez-Mayo, MDPsychiatristDepartment of Veterans AdministrationBay Pines, FLMark Tyler-Lloyd, MD, MPHExecutive Director of AcademicsKaplan MedicalNew York, NYBasic Science of Patient SafetyTed A. James, MD, MS, FACSChief, Breast Surgical OncologyVice Chair, Academic AffairsDepartment of SurgeryBeth Israel Deaconess Medical CenterHarvard Medical SchoolBoston, MAUSMLE Step 1 Behavioral Science.indb 39/18/17 11:43 AM
We want to hear what you think. What do you like or not like about the Notes?Please email us at medfeedback@kaplan.com.USMLE Step 1 Behavioral Science.indb 49/18/17 11:43 AM
Table of ContentsPart I: Epidemiology and BiostatisticsChapter 1: Epidemiology . . . . . . . . . . . . . . . . . . . . . . . . . . . . . . . . . . . . . . . . . 3Chapter 2: Biostatistics. . . . . . . . . . . . . . . . . . . . . . . . . . . . . . . . . . . . . . . . . . .25Part II: Behavioral ScienceChapter 3: Developmental Life Cycle . . . . . . . . . . . . . . . . . . . . . . . . . . . . . . .53Chapter 4: Theories of Learning and Behavioral Modification. . . . . . . . . . 61Chapter 5: Defense Mechanisms . . . . . . . . . . . . . . . . . . . . . . . . . . . . . . . . . 67Chapter 6: Psychological Health and Testing . . . . . . . . . . . . . . . . . . . . . . . . .73Chapter 7: Substance Use Disorders . . . . . . . . . . . . . . . . . . . . . . . . . . . . . . 79Chapter 8: Sleep and Sleep Disorders . . . . . . . . . . . . . . . . . . . . . . . . . . . . . 87Chapter 9: Psychiatric (DSM-5) Disorders . . . . . . . . . . . . . . . . . . . . . . . . . . 93Chapter 10: Psychopharmacology . . . . . . . . . . . . . . . . . . . . . . . . . . . . . . . 109Chapter 11: Brain Function and Neurocognitive Disorders . . . . . . . . . . . 115Chapter 12: Ethics, Law, and Physician Behavior . . . . . . . . . . . . . . . . . . . 125Chapter 13: Health Care Delivery Systems. . . . . . . . . . . . . . . . . . . . . . . . . 145Part III: Social SciencesChapter 14: Basic Science of Patient Safety . . . . . . . . . . . . . . . . . . . . . . . . .149Index . . . . . . . . . . . . . . . . . . . . . . . . . . . . . . . . . . . . . . . . . . . . . . . . . . . . . . . . . . . . . . 177Additional resources available at www.kaptest.com/usmlebookresourcesvUSMLE Step 1 Behavioral Science.indb 59/18/17 11:43 AM
USMLE Step 1 Behavioral Science.indb 69/18/17 11:43 AM
PART IEpidemiology andBiostatisticsUSMLE Step 1 Behavioral Science.indb 19/18/17 11:43 AM
USMLE Step 1 Behavioral Science.indb 29/18/17 11:43 AM
Epidemiology1Learning Objectives Answer questions about epidemiologic measures Use knowledge of screening tests Explain information related to study designsEPIDEMIOLOGIC MEASURESEpidemiology is the study of the distribution and determinants of health-relatedstates within a population. It refers to the patterns of disease and the factors thatinfluence those patterns. Endemic: the usual, expected rate of disease over time; the disease ismaintained without much variation within a region Epidemic: occurrence of disease in excess of the expected rate; usuallypresents in a larger geographic span than endemics (epidemiology is thestudy of epidemics) Pandemic: worldwide epidemic Epidemic curve: visual description (commonly histogram) of an epi-demic curve is disease cases plotted against time; classic signature ofan epidemic is a “spike” in timeThe tools of epidemiology are numbers; the numbers in epidemiology are ratiosconverted into rates. The denominator is key: who is “at risk” for a particularevent or disease state.To determine the rate, compare the number of actual cases with the number ofpotential cases:Actual casesNumerator RATEPotential casesDenominatorRates are generally, though not always, per 100,000 persons by the Centersfor Disease Control (CDC), but can be per any multiplier. (Vital statistics areusually per 1,000 persons.)A disease may occur in a country at a regular annual rate, which makes itendemic. If there is a sudden rise in the number of cases in a specific month,we say that there is an epidemic. As the disease continues to rise and spread toother countries, it becomes a pandemic. Thus the terminology is related to boththe number of cases and its geographical distribution.3USMLE Step 1 Behavioral Science.indb 39/18/17 11:43 AM
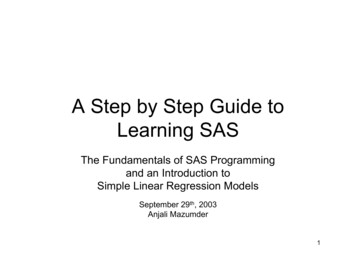
Medical GeneticsPart IEpidemiology and BiostatisticsBehavioral Science/Social SciencesThe graph below represents the incidence of 2 diseases (cases in 100,000).Disease 1 is endemic as the rate of disease is consistent month to month withminor variation in the number of cases. Disease 2 experiences an epidemic inMarch and April in which the number of cases is in excess of what is t3434443355885555Although the data isin 100,000 cases, thevariation in disease 1is still consistent whencompared to disease 2.Figure 1.1 Epidemic vs. Endemic CasesConsider the following scenario. A Japanese farmer begins to sell meat that isinfected with salmonella. Within 2 days, hundreds of villagers begin to experience crampy abdominal pain. This is an example of an epidemic. The suddenrise of salmonella gastroenteritis in this village is much higher than the averageincidence for the given time period.Now what if the farmer ships 1,000 pounds of infected beef to other regionsof Japan before he realizes what happened? What can one anticipate wouldhappen? The answer is there would be no change to the endemic rate ofgastroenteritis. The farmer is only shipping out 1,000 pounds of beef to a fewcities nationwide. Unlike the earlier scenario which addressed the populationof a village, this would be the entire nation. Assuming that every person whoconsumes the beef gets gastroenteritis, that number would not significantly increase the national average of cases and would therefore not significantly changethe incidence of the disease nationwide.Incidence and PrevalenceIncidence rate (IR) is the rate at which new events occur in a population. The numerator is the number of new events that occur in a defined period. The denominator is the population at risk of experiencing this newevent during the same period.4USMLE Step 1 Behavioral Science.indb 49/18/17 11:43 AM
Chapter 1Incidence rate EpidemiologyNumber of new events in a specified period 10nNumber of persons “exposed to risk”of becoming new cases during this periodThe IR includes only new cases of the disease that occurred during the specifiedperiod, not cases that were diagnosed earlier. This is especially important whenworking with infectious diseases such as TB and malaria.If, over the course of a year, 5 men are diagnosed with prostate cancer, out of atotal male study population of 200 (with no prostate cancer at the beginning ofthe study period), the IR of prostate cancer in this population would be 0.025(or 2,500 per 100,000 men-years of study).Attack rate is the cumulative incidence of infection in a group of peopleobserved over a period of time during an epidemic, usually in relation tofood-borne illness. It is measured from the beginning of an outbreak to the endof the outbreak.Attack rate Number of exposed people infected with the diseaseTotal number of exposed peopleAttack rate is also called attack ratio; consider an outbreak of Norwalk virusin which 18 people in separate households become ill. If the population of the18community is 1,000, the overall attack rate is 100% 1.8%.1,000Figure 1.2 Reported Cases of Hepatitis C in the United StatesFigure 1.3 Cumulative Incidence 2005–20155USMLE Step 1 Behavioral Science.indb 59/18/17 11:43 AM
Part IEpidemiology and BiostatisticsPrevalence is all persons who experience an event in a population. The numeratoris all individuals who have an attribute or disease at a particular point in time (orperiod of time). The denominator is the population at risk of having the attributeor disease at that point in time or midway through the period.Prevalence All cases of a disease at a given point / period 10 nTotal population “at risk” for being cases at a given point / periodPrevalence, in other words, is the proportion of people in a population whohave a particular disease at a specified point in time (or over a specified periodof time). The numerator includes both new cases and old cases (people whoremained ill during the specified point or period in time). A case is countedin prevalence until death or recovery occurs. This makes prevalence differentfrom incidence, which includes only new cases in the numerator.Prevalence is most useful for measuring the burden of chronic disease in apopulation, such as TB, malaria and HIV. For example, the CDC estimated theprevalence of obesity among American adults in 2001 at approximately 20%.Since the number (20%) includes all cases of obesity in the United States, we aretalking about prevalence.NotePrevalence is a measurement of allindividuals (new and old) affectedby the disease at a particular time,whereas incidence is a measurementof the number of new individuals whocontract a disease during a particularperiod of time.Point prevalence is useful for comparing disease at different points in time inorder to determine whether an outbreak is occurring. We know that the amountof disease present in a population changes over time, but we may need to knowhow much of a particular disease is present in a population at a single point intime (“snapshot view”).Perhaps we want to know the prevalence of TB in Community A today. To dothat, we need to calculate the point prevalence on a given date. The numeratorwould include all known TB patients who live in Community A that day. Thedenominator would be the population of Community A that day.Period prevalence, on the other hand, is prevalence during a specified period orspan of time. The focus is on chronic conditions.In the “prevalence pot,” incident (or new) cases are monitored over time. Newcases join pre-existing cases to make up total prevalence.Incident CasesGeneralPopulationat RiskRecoveryPrevalentCasesMortalityRecovery with ImmunityFigure 1-4. Prevalence PotPrevalent cases leave the prevalence pot in one of 2 ways: recovery or death.6USMLE Step 1 Behavioral Science.indb 69/18/17 11:43 AM
Chapter 1EpidemiologyTable 1-1. Incidence and PrevalenceWhat happens if:IncidencePrevalenceNew effective treatment is initiatedno changedecreaseNew effective vaccine gains widespread use decreasedecreaseNumber of persons dying from thecondition increasesno changedecreaseAdditional Federal research dollars aretargeted to a specific conditionno changeno changeBehavioral risk factors are reduced inthe population at largedecreasedecreasedecreasedecreaseno changeno changeRecovery from the disease is more rapidthan it was one year agono changedecreaseLong-term survival rates for the diseaseare increasingno changeincreaseContacts between infected persons andnoninfected persons are reducedFor airborne infectious disease?For noninfectious disease?NoteMorbidity rate is the rate of disease ina population at risk (for both incidentand prevalent cases), while mortalityrate is the rate of death in a populationat risk (incident cases only).Lung Cancer Cases in a Cohort of Heavy SmokersDisease course, if any, for 10 onTerminal EventFigure 1-2. Calculating Incidence and PrevalenceFigure 1-5. Calculating Incidence and Prevalence7USMLE Step 1 Behavioral Science.indb 79/18/17 11:43 AM
Medical GeneticsPart IEpidemiology and BiostatisticsBehavioral Science/Social SciencesBased on the graph above, calculate the following: Prevalence of lung cancer from 1/1/2006–1/1/2007– Number of patients who "had" lung cancer in this time period from thegraph: (7)– Number of patients at risk in this time period: (9) [exclude patient #2 whodied before the time period]– Prevalence: (7/9)– Type of prevalence: (period prevalence) Incidence of lung cancer from 1/1/2006–1/1/2007– Number of patients who developed lung cancer in this time period: (4)– Number of
STEP 1. Lecture Notes2018. USMLEBehavioral Science and Social Sciences. USMLE Step 1 Behavioral Science.indb 1 9/18/17 11:43 AM. USMLE is a joint program of the Federation of State Medical Boards (FSMB) and the National Board of Medical Examiners (NBME), neither