Transcription
Statistical Concepts forClinical Research PJ Heagerty Department of Biostatistics University of Washington1ITHS 2012
CTSA Core Competencies: Statistics1. Describe the role that biostatistics serves in biomedicaland public health research.2. Describe the basic principles and practical importanceof random variation, systematic error, samplingerror, measurement error, hypothesis testing, type Iand type II errors, and confidence limits.3. Scrutinize the assumptions behind different statisticalmethods and their corresponding limitations.2ITHS 2012
4. Generate simple descriptive and inferential statisticsthat fit the study design chosen and answer researchquestion.5. Compute sample size, power, and precision forcomparisons of two independent samples with respectto continuous and binary outcomes.6. Describe the uses of meta-analytic methods.7. Defend the significance of data and safety monitoringplans.3ITHS 2012
8. Collaborate with biostatisticians in the design,conduct, and analyses of clinical and translationalresearch.9. Evaluate computer output containing the results ofstatistical procedures and graphics.10. Explain the uses, importance, and limitations of earlystopping rules in clinical trials.4ITHS 2012
Overall Focus Ralph Waldo Emerson “If you learn only methods, you’ll be tied to yourmethods, but if you learn principles you can deviseyour own methods.”5ITHS 2012
A Motivating Example. Carpal Tunnel Surgery:Jarvik et al. (2009) Lancet Surgical trials often evaluate pain and function asco-primary outcomes. Comparison of progression / comparison oflong-term status Key Elements: A research team Grant proposal / Protocol Study monitoring / Publication6ITHS 2012
7ITHS 2012
8ITHS 2012
Outline for ITHS Bootcamp Why you might want to talk to a statistician. How a statistician approaches research aims Key considerations in study design What you need to know to “bridge the gap” What data should arise if there is no association? What data should arise if there is an association?9ITHS 2012
SOURCE: tatistician.jpg10ITHS 2012
Why you might want to talk to astatistician. Academic statisticians (faculty) have co-writtendozens of grants and have seen what works and whatdoes not work. Academic statisticians (faculty) can be really good athelping you to articulate your ideas and to refine yourplans.question hypothesis design analysis Data collection / management and statistics are keycollaborative components for most clinical researchstudies.11ITHS 2012
Research Question What groups do you want to compare? What do you want to measure? When will you measure? What do you need (hope) to control (hold fixed) inorder to compare groups?12ITHS 2012
Research Goals To describe associations / patterns. Moderately easy. Create an analysis plan (“diary”) to document. To make inference or attribute cause to a condition /exposure. Moderately difficult. Require an analysis plan before conduct. To predict what will happen to individual subjects. Moderately easy. Analysis plan to document decisions.13ITHS 2012
Examples: Descriptive Studies14ITHS 2012
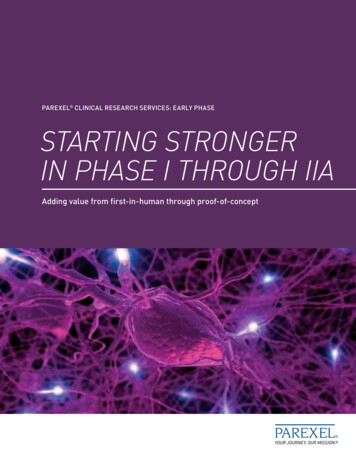
Examples: Descriptive Studies – Martin(2012) Goal: describe variation in reoperation rates. Compare: hospitals, surgeons. Measurement: WA registry to capturetime-until-reoperation. Control: age, gender, insurance, comorbiditymeasures. Additional Comments: Reports estimates, confidence intervals, p-values Required use of multi-level models.15ITHS 2012
Examples: Descriptive Studies16ITHS 2012
17ITHS 2012
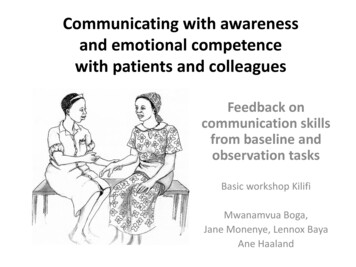
Examples: Inferential Studies – Jarvik(2009) Goal: evaluate impact of surgery Compare: surgery versus standard-of-care Measurement: disease-specific functional measure Control: baseline status Additional Comments: Randomized trial – comparisons are simple Pre-post data analysis (and longitudinal)18ITHS 2012
Example: Inferential Studies19ITHS 2012
20ITHS 2012
Example: Predictive Studies – Fan (2002) Goal: predict hospitalization / death Compare: different sources of information Measurement: time-until-event / comorbidities Control: not key – just measure predictive ability! Additional Comments: Development / validation data Assessment of predictive accuracy21ITHS 2012
22ITHS 2012
Summary of Study Goals One framework organized according to: Descriptive Inferential / Confirmatory Predictive Statisticians can help connect the study goals to achosen study design and appropriate analysis plan Key elements of study design include: Choice of target population Choice of measurements Elements under the control of the research team23ITHS 2012
The Measurements The major categories for variables are: Outcome – variable that reflects the clinicallymeaningful result for the subject (unit) under study. e.g. time-until-death e.g. function (disability) status Predictor of Interest – the variable that you wantto study as possible cause of outcome. e.g. genotype(s) e.g. treatment group24ITHS 2012
The Measurements The major categories for variables are: Potential Confounder – variable that is possibly“confused” with the predictor of interest. e.g. clinical indications for treatment e.g. recruitment site Precision Variable – used to explain some of thevariance of outcome. e.g. baseline (pre-randomization) health status e.g. age of child25ITHS 2012
Variables [1] Surgery CTSAQ function Genotype diabetes26ITHS 2012
Variables [2] [surgery] Pre-treatment pain (observational study) [genes] Continent of origin27ITHS 2012
Variables [3] [surgery] Pre-treatment pain (randomized trial) [genes] Smoking28ITHS 2012
More on Variables. Definition: Confounding refers to the presence of anadditional factor, Z, which when not accounted forleads to an association between treatment, X, andoutcome, Y , that does not reflect a causal effect.Counfounding is ultimately a “confusion” of theeffects of X and Z. For a variable Z to be aconfounder it must: be associated with X in thepopulation; be a predictor of Y in the control (X 0)group; and not be a consequence of either X or Y . a selection bias: van Belle, Fisher, Heagerty &Lumley (2004)29ITHS 2012
A Perfect Situation Suppose that we are interested in the effect of surgeryfor low back pain. Suppose we measure function (or pain) for eachperson Yi (i is individual subject) Suppose somehow we could measure what wouldhappen to each person if they were surgically treated,Yi (1), and if they were non-surgically treated, Yi (0). We would then have the information that we wanted!30ITHS 2012
Subject31PotentialCausalOutcomesEffectiYi (0)Yi (1) 103.62.0-1.6ITHS 2012
7.04.6-2.4206.95.3-1.5Mean5.403.39-2.01ITHS 2012
A Randomized Trial Suppose that we are interested in the effect of surgeryfor low back pain. Suppose we randomly assign surgery or non-surgery.(with all conduct caveats) Now we only “see half” of what we’d like, but thecomparison of surgical to non-surgical subjects isperfectly fair. We have no selection bias.33ITHS 2012
412.250610.8711.5804.9903.81003.6Yi (0)Yi (1)Difference4.53.3ITHS 2012
15.3Mean355.18.35.323.37-1.95ITHS 2012
An Observational Trial Suppose that we are interested in the effect of surgeryfor low back pain. Suppose we have available subjects that have hadsurgery or non-surgical treatment. Q: what leads some subjects to get treatment? Suppose we know that there are “poor” and “good”functioning patients based on their pre-treatmentclinical assessment, and that this status is highlyrelated to moving to surgery. Q: can we control for baseline-status?36ITHS 2012
3.31704.01804.91903.811003.61Mean37ObservationalYi (0)Yi (1)2.72.23.742.45StrataDifference11-1.29ITHS 2012
.622015.325.624.07.722Mean6.654.96-1.69Overall Mean4.324.460.14ITHS 2012
Surgical Study39ITHS 2012
Summary of These Scenarios The design of the study is important. Understanding the variables at play in relation to yourresearch goal is critical. For observational studies confounding (e.g. byindication) is important to consider when planning theresearch. Control of confounding: design, or analysis.40ITHS 2012
41ITHS 2012
Examples: Inferential – Annane (2012) Goal: evaluate the effect of Xigris treatment onmortality, and to compare genotype subgroups. Compare: Treatment effect across genotype groups. Measurement: mortality (28-day), treatment Control: age, gender, APACHE, SAPS, site Additional Comments: Uses matching of treated to non-treated. Complete protocol and analysis plan drafted priorto data collection.42ITHS 2012
Summary: Goals and Variables Orienting your primary and secondary goals: Descriptive Inferential / Confirmatory Prediction Grouping variables according to role: outcomes, exposures (POI) confounders, precision or predictors Preparation /organization can help to maximizesuccessful communication and collaboration.43ITHS 2012
CTSA Core Competencies: Statistics 1. Describe the role that biostatistics serves in biomedical and public health research. 2. Describe the basic principles and practical importance of random variation, systematic error, sampling error, measurement error, hypothesis tes