Transcription
Value Stream Mapping1
Value Stream Mapping Definition Value Stream Mapping (VSM):– Special type of flow chart that uses symbolsknown as "the language of Lean" to depictand improve the flow of inventory andinformation.2
Value Stream Mapping Purpose Provide optimum value to the customerthrough a complete value creation processwith minimum waste in:– Design (concept to customer)– Build (order to delivery)– Sustain (in-use through life cycle to service)3
Why ? Many organizations pursuing “lean” conversionshave realized that improvement events aloneare not enough Improvement events create localizedimprovements, value stream mapping & analysisstrengthens the gains by providing vision andplans that connect all improvement activities Value stream mapping & analysis is a tool thatallows you to see waste, and plan to eliminate it4
What Is Value? A capability provided to a customer– of the highest quality,– at the right time,– at an appropriate price,as defined by the customer. "Value" is what the customer is buying5
What Is ValueStream Analysis?Planning tool to optimizeresults of eliminating wastefuture state VSMcurrent state VSM LeanBasics 6
Value Steam Mapping StepsNext Future StateFuture StateCurrent StateOriginal State7
Apply Five Simple Principles Specify value from the standpoint of endcustomer Identify the value stream for each product family Make the product flow So the customer can pull As you manage toward perfectionVALUEPerfectionPULLVALUESTREAMFLOW8
What is the Value that Flows?Specify value from the standpoint of the endcustomerAsk how your current products and processesdisappoint your customer’s value expectation: price? quality? reliable delivery? rapid response to changing needs? ?9
What Flows?"ITEMS" flow through a value stream– In manufacturing, materials are the items– In design & development, designs are the items– In service, external customer needs are the items– In admin., internal customer needs are the itemsAnalysis begins with part of a total value stream,That part of the value stream has customers too10
Value Stream Mapping ProcessSymbolsCustomer/Supplier Icon: represents the Supplier when in the upperleft, customer when in the upper right, the usual end point formaterialDedicated Process flow Icon: a process, operation, machine ordepartment, through which material flows. It represents onedepartment with a continuous, internal fixed flow.Shared Process Icon: a process, operation, department orworkcenter that other value stream families share.Data Box Icon: it goes under other icons that have significantinformation/data required for analyzing and observing the system.Workcell Icon: indicates that multiple processes are integrated in amanufacturing workcell.11
Value Stream Mapping MaterialSymbolsInventory Icons: show inventory between two processesShipments Icon: represents movement of raw materials fromsuppliers to the Receiving dock/s of the factory. Or, the movement offinished goods from the Shipping dock/s of the factory to thecustomersPush Arrow Icon: represents the “pushing” of material from oneprocess to the next process.Supermarket Icon: an inventory “supermarket” (kanban stockpoint).Material Pull Icon: supermarkets connect to downstream processeswith this "Pull" icon that indicates physical removal.12
Value Stream Mapping MaterialSymbols (Cont.)FIFO Lane Icon: First-In-First-Out inventory. Use this icon whenprocesses are connected with a FIFO system that limits input.Safety Stock Icon: represents an inventory “hedge” (or safety stock)against problems such as downtime, to protect the system againstsudden fluctuations in customer orders or system failures.External Shipment Icon: shipments from suppliers or to customersusing external transport13
Value Stream MappingInformation SymbolsProduction Control Icon: This box represents a central productionscheduling or control department, person or operation.Manual Info Icon : A straight, thin arrow shows general flow ofinformation from memos, reports, or conversation. Frequency andother notes may be relevant.Electronic Info Icon : This wiggle arrow represents electronic flowsuch as electronic data interchange (EDI), the Internet, Intranets,LANs (local area network), WANs (wide area network). You mayindicate the frequency of information/data interchange, the type ofmedia used ex. fax, phone, etc. and the type of data exchanged.Production Kanban Icon : This icon triggers production of a predefined number of parts. It signals a supplying process to provideparts to a downstream process.Withdrawal Kanban Icon : This icon represents a card or device thatinstructs a material handler to transfer parts from a supermarket tothe receiving process. The material handler (or operator) goes to thesupermarket and withdraws the necessary items.14
Value Stream MappingInformation Symbols (Cont.)Signal Kanban Icon : used whenever the on-hand inventory levels inthe supermarket between two processes drops to a trigger orminimum point. It is also referred as “one-per-batch” kanban.Kanban Post Icon : a location where kanban signals reside forpickup. Often used with two-card systems to exchange withdrawaland production kanban.Sequenced Pull Icon: represents a pull system that gives instructionto subassembly processes to produce a predetermined type andquantity of product, typically one unit, without using a supermarket.Load Leveling Icon : a tool to batch kanbans in order to level theproduction volume and mix over a period of time.MRP/ERP Icon : scheduling using MRP/ERP or other centralizedsystems.15
Value Stream MappingInformation Symbols (Cont.)Go See Icon : gathering of information through visual means.Verbal Information Icon: represents verbal or personal informationflow.16
Value Stream MappingGeneral SymbolsKaizen Burst Icon: used to highlight improvement needs and plankaizen workshops at specific processes that are critical to achievingthe Future State Map of the value stream.Operator Icon : represents an operator. It shows the number ofoperators required to process the VSM family at a particularworkstation.Other Icon : other useful or potentially useful information.Timeline Icon : shows value added times (Cycle Times) and nonvalue added (wait) times. Use this to calculate Lead Time and TotalCycle Time.17
TAKT TIMEEffective Working Time per ShiftTakt Time Customer Requirement per ShiftSynchronizes pace, evenly applying customer demand across the work day.Takt Time is "Beat Time"? "Rate Time" or “Heart Beat" Lean Production uses Takt Timeas the rate or time that a completed product is finished. If you have a Takt Time of twominutes that means every two minutes a complete product, assembly or machine isproduced off the line. (http://www.isixsigma.com/dictionary/Takt Time-455.htm)18
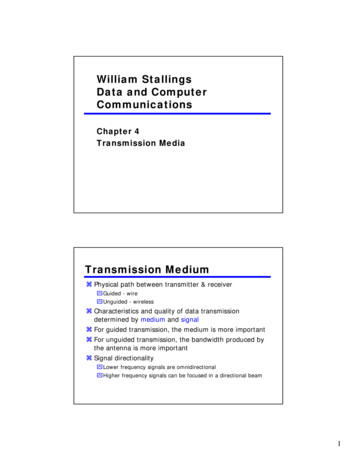
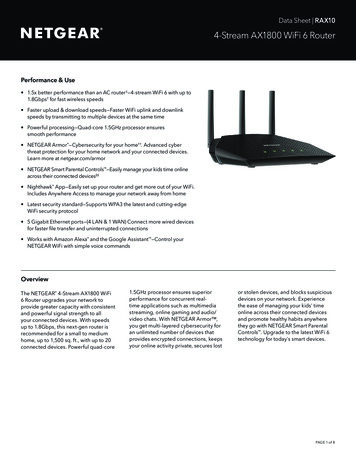
Current State - Manufacturing19
Ideal State - ManufacturingSUPPLIERMACHINE COMPANYASSEMBLY hipCUSTOMERSame Site20
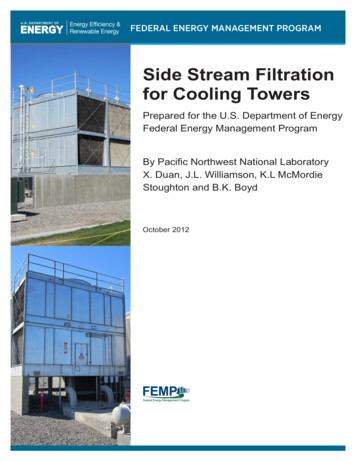
Future State - Manufacturing21
Ideal State - Non-ManufacturingCustomerCommon FormatEng/SCL/TechSoftware Specific Cell22
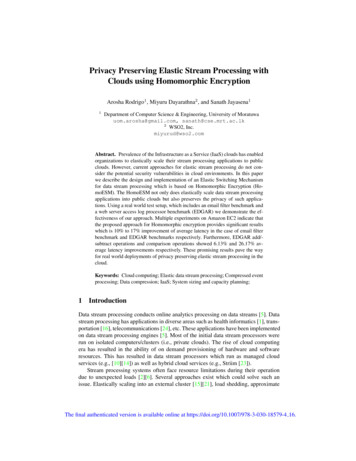
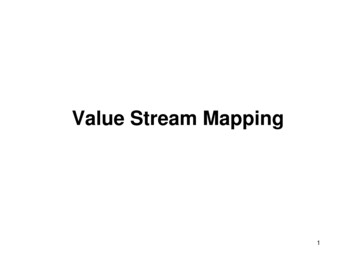
Future State - Non-ManufacturingCustomerCustomerCommon FormatEngineeringCFG MGT/SCLCellTech PubsC/T 45 sec.C/T 45 sec.C/T 45 sec.C/O 30 min.C/O 30 min.C/O 30 min.3 Shifts3 Shifts3 Shifts2%Scrap2%Scrap2%Scrap23
Step by Step Guide: An Example John Smith works for ABC Company in charge ofproduction. ABC company makes widgets and supplythese through several retail outlets. Recently problemshave emerged.– a shortage in supply to the retail outlets– Has high levels and value of inventory in the organizationcurrently– a complaint letter to the company from a customer stating that asa frequent consumer of the products, he’s dissatisfied at thequality of the product and that he often returns faulty widgets tothe retail outlets John’s unsure how to answer to these questions but heintends to get to the bottom of it and if possible improvethe situation.24
Step by Step Guide: An Example Step 1 - Select your sponsor and setexpectations– appoint someone who is responsible to makedecisions, arbitrate solutions, and plan theproject.– The sponsor usually selects the processesthat will be mapped and will usually have afirm grasp of what achievement is beingtargeted.25
Step by Step Guide: An Example Step 2 - Select your team– You should ensure that each area orstakeholder of the process is represented e.g.Sales, Purchasing, Warehouse etc.26
Step by Step Guide: An Example Step 3 -Select process to be mapped– Value Stream Mapping is suitable for mostbusinesses and can be used inManufacturing, Logistics, Supply Chain andsome Service orientated Organizations.27
Step by Step Guide: An Example Step 4 - Collect data and produce currentstate map– process times, inventory or materialsinformation, customer (or demand)requirements.– the future state maps will be developed usinginformation captured here so it’s imperativeyou have a correct understanding of thebusiness.28
Step by Step Guide: An Example Step 5 - Critique Current state– challenge the current thinking, encourageyour team to make suggestions, look forareas of waste.29
Step by Step Guide: An Example Step 6 - Map Future State– compile a future state map based on thecurrent state map and the critiques30
Step by Step Guide: An Example Step 7 - Create Action Plan and deploy– taking the Future State map consider anaction plan that could be implemented tochange the current process to the future state.31
Step by Step Guide: An Example Step 8 - Measure benefits– check to ensure that the benefits expectedhave been obtained – review each changemade and analyze benefits32
Some Mapping Tips (1) Always collect current-state informationwhile walking the actual pathways ofmaterial and information flows yourself Begin with a quick walk along the entiredoor-to-door value stream Begin at the shipping end and workupstreamFrom Rother and Shook (2009)33
Some Mapping Tips (2) Bring your stopwatch and do not rely onstandard times or information that you donot personally obtain Map the whole value stream yourself Always draw by hand in pencilFrom Rother and Shook (2009)34
References New Lean Toolbox : Towards Fast Flexible Flow(2004), Bicheno, John, Picsie Books. Learning to See (2009), Rother, Mike and Shook,John, Lean Enterprise Institute. http://www.valuebasedmanagement.net/methods value stream mapping.html. lue-Stream-Mapping-Howto-Guide-Part-1.asp. htm. http://www.engineering.uiowa.edu/ cam/Documents/ValueStreamMapping.ppt.35
Kaizen Burst Icon: used to highlight improvement needs and plan kaizen workshops at specific processes that are critical to achieving the Future State Map of the value stream. Operator Icon : represents an operator. It shows the number of operators requir