Transcription
Proceedings of the 2010 International Conference on Industrial Engineering and Operations ManagementDhaka, Bangladesh, January 9 – 10, 2010Design and Kaizen of Automated Assembly Production Lines Using3D Computer GraphicsMasatoshi Kitaoka, Toshio Fujita, and Hideki KumagaiDepartment of Industrial EngineeringKanagawa University, Rokakubashi, Yokohama 221-8686 JapanHitoshi TakedaDepartment of Information ManagementBunkyo University, Chigasaki, Kanagawa 253-8550 JapanAbstractThis paper proposed the design method for an automated assembly lines, for carrying out basic design using threedimensional computer graphics (3DCG).It also proposes a method for performing kaizen and evaluation ofautomated systems utilizing hierarchic structure diagrams, state transition diagrams, improved tooling flowdiagrams, a method for creating a Ladder Logic Diagram(LLD).Using a time Petri net, analyze the bottleneckprocess, identify problem points, and propose ideas for kaizen.KeywordsKaizen,three-dimensional computer graphics (3DCG),timed Petri net, hierarchic structure diagrams, ladderdiagrams, and AHP1. IntroductionAt present most production shop floors in Japan, while becoming more technically sophisticated, are beingautomated to boost productivity, reduce labor costs, and so forth. In the area of assembly work, too, there isincreased use of automation utilizing mechatronics or robots. Simulation is an indispensable technique for designingand building optimal automated systems. Building an automated system using actual machinery, in addition torequiring a lot of equipment, necessitates overcoming various technical difficulties, as well as securing the requisiteenergy and physical space. It also takes time and incurs costs. For these reasons, there needs to be a way of buildingan automated production line that affords easy system control, taking such things as line balance and work time intoaccount. In addition, reducing production costs through kaizen of existing automated systems is becomingincreasingly important. Kaizen means continuous improvement, and therefore the philosophy of kaizen is both thestarting point and the driver for all lean manufacturing initiatives. The kaizen program is designed to help companiescreate a solid foundation for change, allowing acceptance and effective integration ,and thereby enabling a companyto sustain the process improvements and realize the positive financial and cultural outcomes[1,2]. The simulator ofArena and AutoMod are not correspond the command of PLC and the cost is expensive. The small enterprise isdifficult to adopt the simulator system. In the area of designing automated assembly lines, the present study proposesa method for carrying out basic design using three-dimensional computer graphics (3DCG) by input the ladderdiagram; it also proposes a method for performing kaizen and evaluation of automated systems utilizing hierarchicstructure diagrams, state transition diagrams, improved tooling flow diagrams, a method for creating a Lower Limitof Detection (LLD), time Petri net, and AHP. The cost is cheap for developed system.2. Procedure for Constructing an Automated System2.1 Procedure for an Automated SystemFor this study, we will construct an automated production system for making music boxes. The method we areproposing for constructing an automated system is as follows.Step 1 :Make an actual production plan, and describe the music box production flow using work process diagrams.
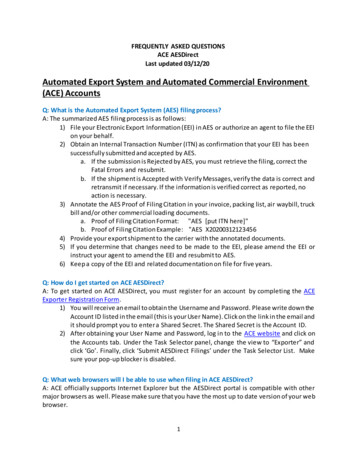
Step 2:Consider the system makeup for each process, based on the work process diagram and individual processdiagram.Step 3:Actually construct the system in a 3DCG space that uses virtual reality modeling language (VRML).Step 4:Describing the operations of each system using hierarchic structure diagrams, create an LLD using statetransition and functional tooling flow diagrams.Step 5 Based on the LLD, create an animation program for VRML and perform simulation in 3DCG space.Step 6:Calculate the line balance from the simulation results.Step 7:Using a time Petri net, analyze the bottleneck processes, identify problem points, and propose ideas forkaizen.Step 8:Break down the proposed kaizen using AHP, and indicate the most suitable kaizen proposal.2.2 Construction of an Assembly ProcessThe main body of a music box is made up of a vibrating plate and two screws; construction is completed once thevibrating plate is attached with screws to the main body. The production equipment is designed based on aproduction plan. It specifies the following: operation time of 420 minutes, production volume of 800 pieces,downtime of 30 minutes, defect rate of 1%. Using work process diagrams to display the production flow, it becomesclear that there are three processes for supplying the parts, there is one assembly process, and there is one processfor product collection, for a total of five processes. For each process, we create a system makeup diagram, determinethe equipment necessary to build the system, and create a system layout. The specific work content is as follows.In Process 1, a robot arm is used to supply the music box main body to a designated location on a pallet. In Proce2, ahandling robot and crank mechanism are used to supply the music box vibrating plate to a designated location on thepallet. In Process 3, a handling robot and twisting mechanism are used to supply two screws from a feeder to adesignated location on the pallet. In Process 4, the music box vibrating plate is moved to a fixed location in the mainbody, a driver unit is used to tighten the screws, and the vibrating plate is secured in place. In Process 5, a robot armis used to collect the finished product. It should be noted that Processes 1 and 5 use the same robot arm; and becausework is conducted in a seamless manner, these two processes are performed at the same work station. For thisreason,the production line is made up of four work stations, identified as Stations 1 through 4[3-5].2.3 Actualization of an automated line in virtual space using 3DCGThe automated system have constructed in virtual space by means of 3DCG employing VRML language. VRML isa computer graphics description language that was developed with the purpose of representing 3DCG with Internetand PC applications in mind. Linking it with programming languages such as Java and Java Script makes it possibleto represent complex movements.2.4 Constructing a system with VRMLTo actually construct a system with 3DCG, each of the different types of modules is first created in separate spaces,and these modules are then placed in a subspace. For example, in the system for automated supply of the vibratingplate in Station 2, each station is realized by creating a module for each piece of equipment, and placing these inSubspace 2 in each station based on the system makeup diagram. An entire production system is created byreproducing each operation system in each subspace, and then placing these in the primary space. Figure 1 showsthe structure of primary space, subspace and modules.Figure 1:Primary space ,subspace and moduleFigure 2 : An automated subsystems by VRML
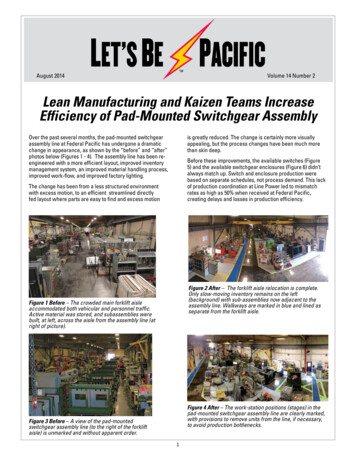
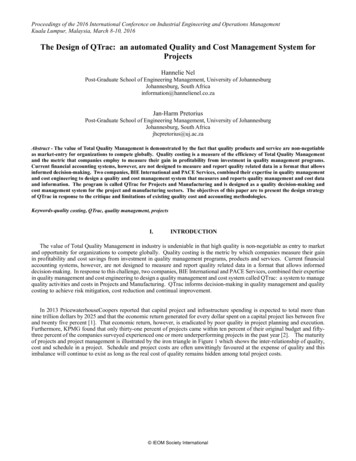
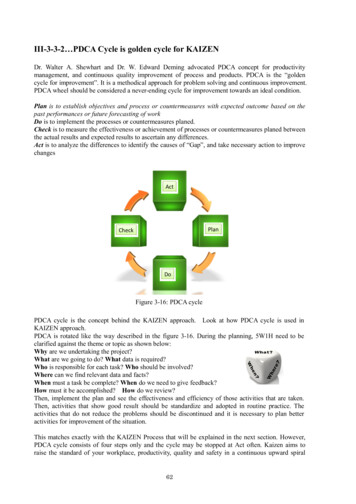
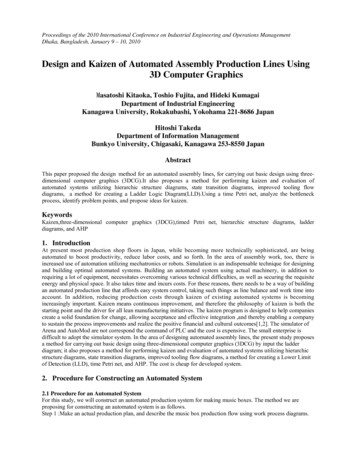
2.5 3DCG control methodsVRML 2.0 comes with animation functions to change location, rotate, and reduce in size. As a means of controlling3DCG animation, we will create programs with timer and location detection functions. By means of these twofunctions, it becomes possible to freely control straight line and rotational movement, which are basic operations ineach. Further, when this is combined with Java/JavaScript, it becomes possible to set such parameters as contactjudgment and priority of movement. By using these functions, we can perform a movement simulation in 3DCGusing the same control methods as are used in an actual PLC. Because it is necessary to make the movement of eachmodule equivalent to that of the actual equipment, we will set the movement range, contact judgment, movementspeed, etc., in advance. In an actual system, the equipment is controlled using LLD. For that reason, we analyze thenecessary movement for each station and create the LLD. We create the LLD by using three diagrams—thehierarchic structure diagram, state transition diagram, functional tooling flow diagram. Next, to control the 3Dsimulation with the LLD, we create a program that converts the LLD into a VRML control program.2.5.1Creation of a hierarchic tool structure diagramTo express the system structure in a hierarchic manner, we create a hierarchic tooling structure diagram as shown inFig. 3. The hierarchic tooling structure diagram has a 4-tiered structure as follows. Level 1 shows the overall systemstructure. Level 2 shows a partial structure of the system. Level 3 shows the operation of a part of the system ingeneral terms. And Level 4 shows machine operation and other system elements in minute detail.2.5.2 Creation of a state transition diagram from the hierarchic tooling structureTo make the state transition of the system easier to understand, and facilitate the creation of the LLD, we create astate transition diagram. The state transition diagram shows how changes in state at a particular step will change theoutput. We utilize Level 4 of the hierarchic tooling structure diagram from Fig.3 to create the state transitiondiagram, as shown in Fig. 4. Fig.4 shows the state transition diagram[4].Figure 3: Hierarchic tool structure diagram2.5.3 Creation of the functional tooling flow diagram from the state transition diagramTo create the LLD efficiently, based on the state transition diagram, a functional tooling flow diagram is createdshown in Fig. 5 based on the state transition diagram. The procedure is as follows.Step:1 Make sure there are five rows: input (X), counter (C), internal relay (M), timer (T), and output (Y).Step :2 Line up STEP relays from M1 to Row M all the way to the final STEP.Step 3:Connect one STEP relay to the next. The beginning STEP from the final STEP to the next loop is connectedusing a red arrow.Step 4:Assign one of the rows X, C, or T as the input symbol to STEP relay M001, and connect. At this time, theOFF symbol will be connected in red.Step 5:Assign a control output to STEP relay M001, and connect. At this time, the OFF symbol will be connected inblue.Step 6:Repeat until the final STEP is reached.
Figure 4 : State transition diagramFigure 5 :Functional tooling flow diagram2.5.4 Converting from functional tooling flow diagram to LLDStep1:Determine the STEP relay output. The STEP relay Mα will take the “OR” for input signal and STEP Mα, and“AND” for input STEP relay. Step 2:Next, set up the output. To the output take “OR” from the ON signal for theSTEP relay, the initial “OFF” signal and “AND.” Treat this as one set, and connect an “OR” to each set. Step3:Lastly, set the timer. To each timer designate an input STEP relay, and set to the desired time.2.5.5Animation programBased on the LLD that has been created, we create a VRML animation program. However, because in the ordinarymethod of creating animation it is necessary to set “time” and “motion” in advance, simulation of motion is verydifficult. However, we made control of the simulation and LLD possible by adding a script that continuously andinstantaneously rewrites the object coordinates, and by using these coordinates as a sensor. Fig6 shows theprocedure of the LLD convert into JAVA script.Figure 6: Procedure of LLD convert into VRML2.6 Simulation resultsWe constructed all stations from Station 1 to Station 4, and also created the animation program. Integrating these inthe primary space completes the virtual music box production system. The results of performing simulations withthis virtual system and measuring operation times are shown in Table 1. It should be noted that the work time forStation 1 is the total of the work times for Process 1 and Process 5.
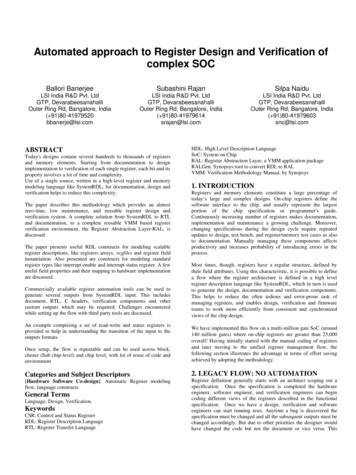
Station NumberWork timeTable 1: Simulation result (Sec)1228.627.2370.9427.72.7 Line balanceFrom the initial production plan, we calculate the pitch time, which is the standard work time per one product unit.Unless the work time of each process is at least lower than this value, it will not be possible to accomplish theproduction plan. Also, in a line production system for performing flow work of the kind in this system, it is vital thatthe work time of each process be equalized and stabilized insofar as possible. However, because the work time ofeach process differs depending on the content of that work, there will be some variation. For that reason, the worktime of the bottleneck process becomes the standard for the work time of the entire system; in systems withprocesses that are performed more quickly, some wait time will result. The more wait time there is, the more thework efficiency declines. For this reason, to ensure that the difference in work time between different processes is assmall as possible, it is necessary to design the line so that the work time of each process is below but close to thepitch time. The line composition efficiency expressing balance of work times for all processes is found by Formula(1). The line composition efficiency of this system is 54.4%. Normally, a line balance efficiency rate of 90% orhigher is considered ideal, and a rate of at least 75% is required. Also, in the designed system, the work times ofStations 1, 2 and 4 are below the pitch time, and are also very close to the work time. However, the work time ofStation 3 is far higher than the pitch time. As a result, system kaizen is required.2.8Producing kaizen proposals using a time Petri netThe work kaizen of Station 3, which is the bottleneck process. First of all, we express the work ofStation 3 in a time Petri net, as shown in Fig. 7, and perform analysis. Also, we identify any problem points that canbe visually gleaned from the VRML simulation. The result is that the following problems are found to exist:(1) Most operations are performed serially, and this is not efficient. (2)Because a single feeder supplies 2 parts,time is wasted going back and forth. (3)Because a feed screw mechanism is used for the back-and-forth movement,it is extremely slow. To resolve these problems, the following kaizen are proposed:Figure 7: Time Petri net for station 3(1) Change the LLD based on the Petri net results so that operations can be conducted in parallel in areas whereparallel operation is possible. (2)Make the feeder a double track, so that 2 parts can be supplied at the same time.(3)Increase the speed of the feed screw mechanism by putting in a more powerful motor. As a result ofimplementing the above kaizen, the Station 3 work time and the system line balance efficiency shown in Table 2was achieved.Table 2: Result of kaizen.Content of kaizenLine balance efficiency (%)Present production process54a)Improvement on the program60b)Change the speed of motor72c)Parts feeder route is increased at 2line.91d) b c(Motor feeder95Work time (Sec)70.959.344.831.425.3
2.9 AHP analysis of kaizen resultsKaizen of the system work time naturally had the positive effects of shortening work time and improving linebalance efficiency. But these kaizen may also result in the negative effects of increased costs and reduced reliability.So each kaizen proposal is analyzed with AHP using the pair comparison method, and the question of whether eachkaizen should be adopted is studied.2.9.1 Analysis of kaizen resultsThe kaizen results actually obtained are then broken down as follows into a hierarchic structure. Note: in this study,line balance efficiency, cost, defect rate, and downtime rate were used as the judgment items.1)Final target: Optimum kaizen proposal.2)Judgment target: Line balance efficiency, cost, defect rate, downtime rate3)Alternative proposals: c perform kaizen by rewriting LLD, d replace motor, e replace part supply device, andf replace both motor and part supply device. Next, perform a pair comparison of each judgment item. Since in thisinstance the objective is to kaizen the line balance efficiency, priority was placed on this item. Finally, compare thealternative proposals in terms of each judgment standard. From the standpoint of line balance efficiency, replacingthe motor and replacing the part supply device, which had the largest impact, were emphasized. Whereas from thestandpoint of cost, downtime rate, and defect rate, the emphasis was on kaizen that entailed smaller changes.2.9.2 AHP Result Analysis and simulationCarrying out the pair comparison according to the above rules yielded the evaluation values shown in Table 3.According to Table 3, replacing the motor and the part feeder are the optimum kaizen.AlternativeproposalsEvaluation valueTable 3 : Overall Evaluation ValuesKaizen byReplace motorReplace partrewriting thesupply mechanismLLD21.713.124.5Replace bothmotor and partsupply mechanism40.7Using the virtual music box production system, the kaizen items are verified by computer. The kaizen of replacing the motor andthe part feeder mechanism that were identified by AHP are implemented on Station 3. The results of these kaizen are reproducedusing the animation program. The results of performing operation simulation and measuring work times are shown in Table 3.3. ConclusionWe proposed a method for reproducing product assembly order and assembly process in 3DCG space usingVRML, and for controlling this using LLD. Using hierarchic structure diagrams, state transition diagrams, andimproved tooling flow diagrams, we established a method for supporting LLD creation. This has made it possible toeasily and reliably create an LLD. To improve the overall efficiency of the automated system, we used a time Petrinet to propose kaizen, made a comparison of these kaizen using AHP, and decided on the kaizen proposals that metour stated objectives. The following are some of the merits of running simulations in 3DCG space using VRML:(1)Because the system can actually be viewed, one can easily get a sense of how it will look upon completion.(2)Problem points can be grasped on an intuitive level. (3) Using LLD in combination with time Petri net makes iteasy to prepare many alternative modules, and to propose kaizen. The cost is cheap for developed system. Therefore,it can apply even in the small-scale enterprise.References1.2.3.4.5.Chris A.O., 2006,Kaizen Assembly,Taylor and FrancisJohn M.G., and Kenneth R.M.,2003,KANBAN made Simple,AMACOMUsuki,J.,Kumagai,H., and Kitaoka.,M,2006,”An Automated System Design Deriving Timed AND/ORNets and Petri Nets from a Scenario for Taask Sequence Planning”,Jpornal Logistics Systems,6.(2),53-62Kumagai,H.,,2008,”Sequence Program “,Nitsukan Kogyou Pub.,(Japan)Nagata,K.,Tange,S., andKitaoka,M.,2006,”Integrated Cellular Manufacturing,Cell Formation,ProcessPlanning,Layout Planning and Workcell,”Proc.European Conference on Management of Technology,527534,England
kaizen. Step 8:Break down the proposed kaizen using AHP, and indicate the most suitable kaizen proposal. 2.2 Construction of an Assembly Process The main body of a music box is made up of a vibrating plate and two screws; construction is completed once the vibrating plate is attached with screws to the main body.