Transcription
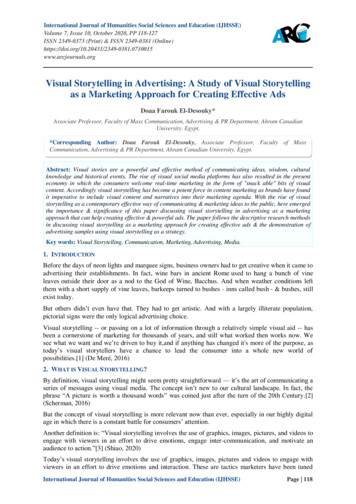
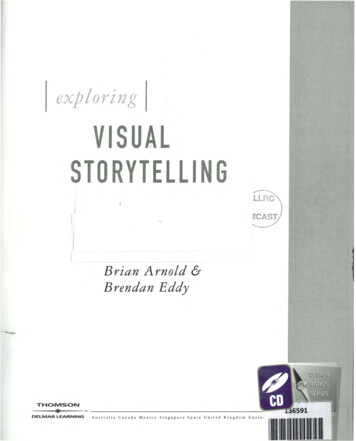
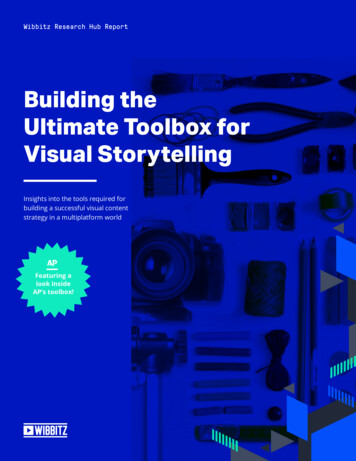
Eurographics Conference on Visualization (EuroVis) 2016K.-L. Ma, G. Santucci, and J. van Wijk(Guest Editors)Volume 35 (2016), Number 3From Visual Exploration to Storytelling and Back AgainS. Gratzl1 , A. Lex2 , N. Gehlenborg3 , N. Cosgrove1 , and M. Streit11 JohannesKepler University Linz, Austriaof Utah, United States of America3 Harvard Medical School, United States of America2 UniversityFigure 1: Screenshot of CLUE applied to the StratomeX technique (a) in authoring mode. An annotation (b) highlights relevant aspects. Theprovenance graph view (c) and story view (d) show the history of the analysis and a Vistory being created.Vistory: http://vistories.org/v/stratomex.AbstractThe primary goal of visual data exploration tools is to enable the discovery of new insights. To justify and reproduce insights, thediscovery process needs to be documented and communicated. A common approach to documenting and presenting findings isto capture visualizations as images or videos. Images, however, are insufficient for telling the story of a visual discovery, as theylack full provenance information and context. Videos are difficult to produce and edit, particularly due to the non-linear natureof the exploratory process. Most importantly, however, neither approach provides the opportunity to return to any point in theexploration in order to review the state of the visualization in detail or to conduct additional analyses. In this paper we presentCLUE (Capture, Label, Understand, Explain), a model that tightly integrates data exploration and presentation of discoveries.Based on provenance data captured during the exploration process, users can extract key steps, add annotations, and author“Vistories”, visual stories based on the history of the exploration. These Vistories can be shared for others to view, but alsoto retrace and extend the original analysis. We discuss how the CLUE approach can be integrated into visualization tools andprovide a prototype implementation. Finally, we demonstrate the general applicability of the model in two usage scenarios:a Gapminder-inspired visualization to explore public health data and an example from molecular biology that illustrates howVistories could be used in scientific journals.Categories and Subject Descriptors (according to ACM CCS):H.5.2 [Information Systems]: Information Interfaces and Presentation—User Interfaces–Graphical user interfacesc 2016 The Author(s)Computer Graphics Forum c 2016 The Eurographics Association and JohnWiley & Sons Ltd. Published by John Wiley & Sons Ltd.
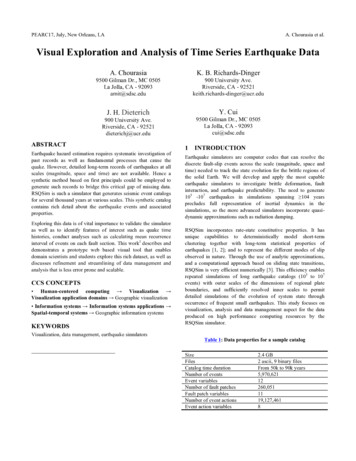
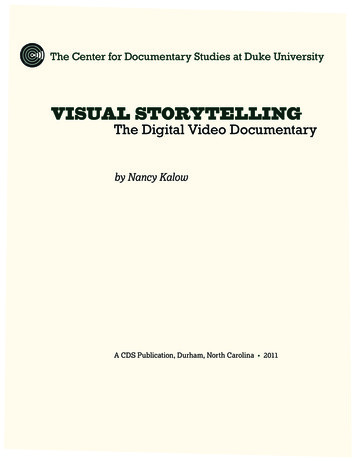
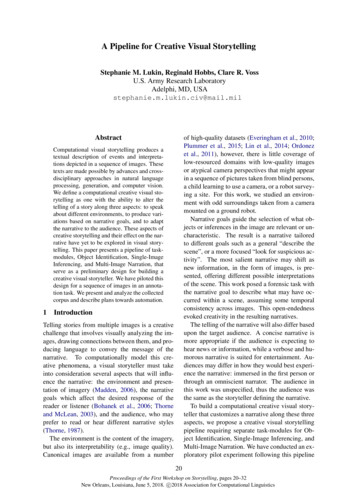
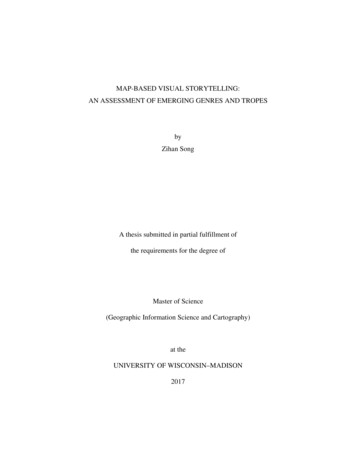
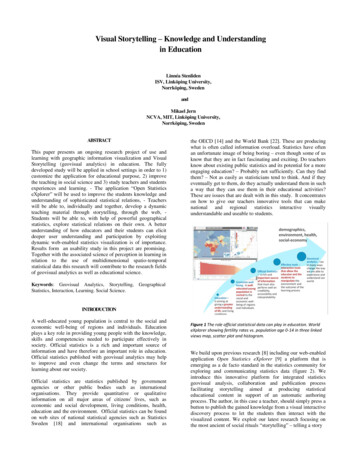
S. Gratzl et al. / From Visual Exploration to Storytelling and Back Again1. IntroductionScientific progress is driven by discoveries based on observations.Accurate and efficient documentation and presentation of how discoveries were made is essential, since the scientific method requiresthat findings are reproducible. The process from making a discovery in a visualization tool to communicating it to an audience istypically a process that does not allow users to switch back frompresentation to exploration, as illustrated in Figure 2.Figure 2: Traditional workflow and information flow for visualdata exploration and presentation of discoveries. Dashed edgesindicate information flow, solid edges show transitions betweenstages. The information flow is sequential and different tools areused in each stage.In the exploration stage of a data-driven research project, analysts apply interactive visualization and analysis tools to gainnew insights. Then they document the discovery process for reproducibility and presentation. Presentation can be in the form oftext or figures in a paper or slide-deck, or in the form of interactive visual data stories. Visual data stories are increasingly popularas they are engaging and can communicate complex subject mattersefficiently [LRIC15]. Only in rare cases, however, can static figuresor visual data stories be created straight out of the exploratory tool.Instead, an authoring stage, in which artifacts, such as screenshots,are sorted, edited, and annotated is necessary. In the case of interactive data stories, this process often consists of custom developmentof software. The final product is subsequently used to present afinding to a consumer. A consumer in this context can be, for instance, a reader of a news article, a reviewer or editor of a scientificpublication, or a colleague of the analyst, trying to understand afinding and the process of its discovery. This workflow correspondsto the storytelling process introduced by Lee et al. [LRIC15]. Theauthoring stage described here includes their “make a story” and“build presentation” stages, since the story being told is a scientificdiscovery not requiring a distinction between scripter (author) andeditor.In a visual exploration process, findings are often captured bytaking one or multiple screenshots of the visualizations, or by creating a screen recording that shows the steps that led to the discovery. Static images, however, cannot tell the story of the visualdiscovery, as they cannot convey information about the explorationprocess. Videos are difficult to create, edit and update, and also donot capture the full analysis process. Furthermore, the tools used forexploration are in many cases not suitable for authoring and presen-tation. Neither images nor videos allow an exploration to be continued, and both prohibit users from asking additional questions.Given the sequential information flow and the separation of tools,it is inefficient for the analyst and creator of the story – and evenimpossible for the consumer – to work back from an artifact usedfor presentation to the exploration stage. The lack of a back-linkfrom the curated story to the exploration stage and the underlyingdata makes it impossible (1) to reproduce and verify the findingsexplained in a figure or video and (2) to extend an exploration tomake new discoveries. In this work, we propose a comprehensiveset of solutions to these problems.Figure 3: Information flow and stage transitions using the CLUEmodel. The provenance graph of an exploratory session and Vistories (interactive visual stories) are in the center. Solid edges indicate possible stage transitions, dashed lines indicate informationflow. In the exploration stage, provenance data is generated; in theauthoring stage a Vistory is created by curating provenance data,which is then used in the presentation stage. Note that consumersof a Vistory can also switch to any other stage.Our primary contribution is CLUE, a model for reproducing,annotating, and presenting visualization-driven data explorationbased on automatically captured provenance data. We also introduce Vistories– interactive visual data stories that are based on thehistory of an exploratory analysis that can be used as an entry pointto reproducing the original analysis and to launching new explorations. Figure 3 shows our proposed CLUE model. All information flow is routed through a central component, and all stages usethe same universal tool. This allows the seamless stage transitionindicated by the solid edges.As a secondary contribution we present a prototype implementation and a discussion of how to integrate CLUE with other visualexploration tools. To demonstrate the overall CLUE model, we describe a Gapminder-inspired usage scenario based on public healthdata. In a second usage scenario, we apply CLUE to a more complex multi-step visual exploration of cancer genomics data.2. Related WorkCLUE closes the gap between exploration and presentation usingprovenance data. Since our model is independent of the exploratoryvisualization techniques employed, we limit our discussion of related work capturing and use of provenance data, presentation andcommunication in visualization, and visual storytelling techniques.c 2016 The Author(s)Computer Graphics Forum c 2016 The Eurographics Association and John Wiley & Sons Ltd.
S. Gratzl et al. / From Visual Exploration to Storytelling and Back Again2.1. ProvenanceIn the context of our work, provenance of the state of a visual exploration process refers to all information and actions that lead toit. The provenance of the visual analysis as a whole is comprised ofthe provenance of all states that were visited during the exploration.Ragan et al. [RESC16] have recently characterized provenancein visualization and data analysis according to the type and purpose of the collected provenance information. The type of provenance information includes data (i.e., the history of changes to thedata), visualization (i.e., the history of changes to views), interaction (i.e., the interaction history), insight (i.e., the history of outcomes and findings), and rationale, the history of reasoning. Ourprototype implementation currently captures all of this information. Data and interaction provenance are captured automatically,while insight and rationale are captured through the externalizationof a thought process by the user. CLUE enables this, for instancevia annotations and bookmarks.Provenance information is used for several purposes [RESC16]:for recalling the current state during the analysis, for recoveringactions (undo and redo), for replicating (reproducing) steps ofthe analysis, for collaborative communication (i.e., for sharing theanalysis process with others), for presenting the analysis, and formeta-analysis (i.e., for reviewing the analysis process).VisTrails [BCS 05], for example, collects and visualizes provenance data for computational and visualization workflows for largescale scientific data analysis. Users of VisTrails interactively modela workflow that produces, for instance, a visualization; the processof creating this workflow is tracked as provenance data. In CLUEthe focus is not on modelling a specific artifact with a goal in mindbut rather automatically capture the provenance of an interactive visual exploration process that may lead to discoveries that are laterbeing told using integrated storytelling approaches.The works by Heer et al. [HMSA08] and Kreuseler etal. [KNS04] discuss a concept for visual histories (i.e., provenanceof a visual exploration) including types, operations, management,and aggregation and provide a prototypical implementation. However, in both cases, provenance data is used for exploration onlyand not to address storytelling aspects. Heer et al. pointed to storytelling based on provenance as future work.Action recovery (undo, redo) is commonly integrated into software applications. Most tools, however, do not visualize thehistory of actions and rely on a linear undo-redo path, whichmakes recovery from analysis branches impossible. Exceptionsto this implicit approach are integrated in Small Multiples,Large Singles [vdEvW13], Stack’n’Flip [SSL 12], and GraphTrail [DHRL 12]. In the former two, the history of the current artifact is explicitly shown at the bottom and implicitly through thestrict left-to-right workflow. GraphTrail also supports branches inthe history: It explicitly visualizes how a plot is derived from previous ones using basic data operations. However, only a fractionof the provenance of the visual exploration is being captured byfocusing on the data operations leaving out the parameters of thevisualizations, etc.c 2016 The Author(s)Computer Graphics Forum c 2016 The Eurographics Association and John Wiley & Sons Ltd.In regard to provenance, the paper by Shrinivasan and vanWijk [SW08] is most closely related to CLUE. The authors proposed a technique that integrates three views: Data, Navigation, andKnowledge. The data view contains the actual visualization of thedata. The navigation view shows the exploration process in a tree(i.e., the provenance). Using the knowledge view, users can capture and relate annotations to document findings, assumptions, andhypotheses, and link them to specific states in their exploration forjustification. The knowledge view in combination with the navigation view is then used to communicate findings. In contrast to theirwork, the CLUE model also covers aspects of storytelling: by enabling authoring, we allow users to produce concise and effectivestories based on the original exploration. This linear narrative approach is closely related to the traditional workflow of publishingresults with the additional benefit of having a back-link to the realexploration at all time.2.2. StorytellingKosara and MacKinlay [KM13] highlighted the importance of visual data stories for visualization research. They defined a story as“an ordered sequence of steps, each of which can contain words,images, visualizations, video, or any combination thereof”. Theyfurther stated that “stories can thus serve as part of a finding’sprovenance, similar to an event’s narrated history”. Different approaches can be used for telling a story. Stories are mostly toldindividually and linearly, but management of multiple stories andbranching have also been proposed [LHV12]. The degree to whichusers can influence how the story is being told may vary from automated replay to crafting their own story.In CLUE, we apply a narrative approach storytelling inspired bythe work of Figueiras [Fig14a, Fig14b]. Figueiras discussed howto include narrative storytelling elements such as annotations andtemporal structure in existing visualizations to enrich user involvement and understanding through story flow. Similarly, the authorsof VisJockey [KSJ 14] noted that when integrating interactive visualizations into data-driven stories, user guidance how to interpretthe visualizations are lacking by default. Therefore, the authors proposed the VisJockey technique that enables readers to easily accessthe author’s intended view through supplementing the visualizationwith highlights, annotation and animation. In Tableau [Tab16], storytelling features are integrated using an annotated stepper interface. This enables users to navigate through a series of interactivedashboards. These works have in common that they are dealingwith existing visualizations and insights, purely focusing on theauthoring and presentation state, yet neglecting the underlying process of how the insights were discovered.Ellipsis [SH14] is a domain-specific language for creating visualdata stories based on existing visualizations. Journalists can combine visualizations, define triggers, states, annotations, and transitions via a programming interface or a visual editor. This allowsthem to define a wide range of story types, including linear, nonlinear, interactive, automatic, and stepped stories. However, Ellipsisis only concerned with creating scripted stories, and does not utilizethe visual data exploration process that leads to an insight.
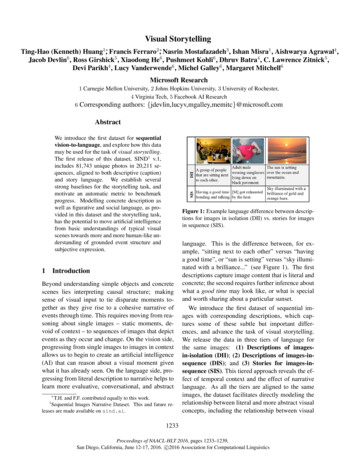
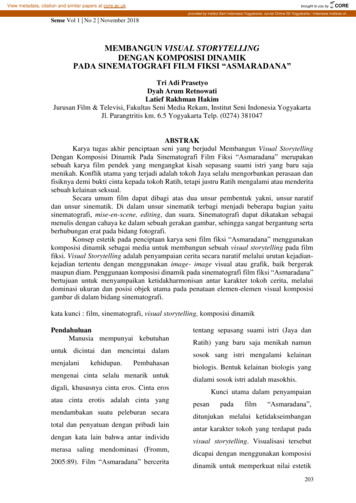
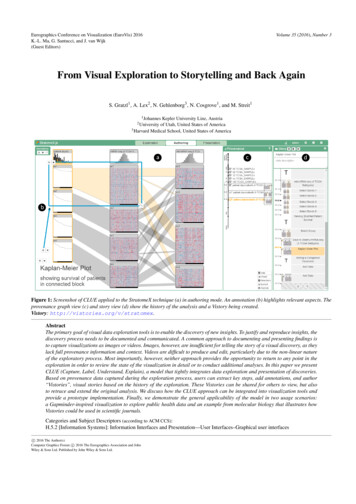
S. Gratzl et al. / From Visual Exploration to Storytelling and Back AgainWith regards to storytelling, the work most closely related toCLUE is by Wohlfart and Hauser [WH07]. Their technique allowsusers to record interactions with a volume visualization, modifythis recording, and annotate it in order to tell a story. In their work,however, the recording or capturing has to be actively triggered,and only a linear story can be captured. When users press a recordbutton, they typically already know what they want to show. CLUE,in contrast, captures all actions and exploration paths, allowing theuser to extract or base their story on the provenance of the analysis.Storytelling approaches prompting user involvement throughplay and pause techniques were explored by Pongnumkul etal. [PDL 11] to support navigation in step-by-step tutorials. AdobeLabs [Ado16] provides a Photoshop plugin to create such tutorials:users can first record actions and then author them.In summary, existing storytelling tools focus on how to tell astory, but rarely base the story on provenance data. The CLUEmodel solves this by providing links between points in the storyto corresponding states in the exploration. This allows users switchfreely and easily between exploration and presentation.3. CLUE ModelThe CLUE model bridges the gap between exploration and presentation. Its backbone is a rich provenance graph that containsall actions performed during the exploration. This includes exploration paths that led to findings, but also the dead ends encounteredby the analyst. By putting the provenance graph at the center ofour model, we are able to break the strict sequential order of theexploration, authoring, and presentation stages (see Figure 2) thatdominates traditional workflows. CLUE allows users to seamlesslyswitch between Exploration Mode, Authoring Mode, and Presentation Mode. This integrated and flexible process is illustratedin Figure 3, where solid lines indicate the possible transitions between stages, and dashed lines represent information flow.Provenance data makes scientific findings more reproducible andcan also provide the basis for authoring stories. In CLUE, userscreate stories by defining a path through the provenance graph. Wecall such a provenance-based story a Vistory. States in the storycan then be enriched with highlights, textual annotations, and, ifdesired, timed for automatic playback. Hence, the resulting story isnot an artificial composition of visualizations, but a curated versionof the actual exploration. Most importantly, this deep integration ofthe provenance graph introduces the back-link from presentationto exploration. Vistories can be shared and encourage collaborative visual data analysis. Consumers can step through a story, butalso switch to the exploration mode and interactively build uponthe previous analysis to gain new insights. Vistories also make theexploration process more efficient, as a user can revisit states andapply changes, without redoing all steps to reach a particular state.Therefore, Vistories are more than visual data stories as defined byLee et al. [LRIC15], since they allow consumers to continue thevisual exploration in-place and build new stories themselves.Figure 4 illustrates three scenarios that show how users canswitch between modes. In the first example (Figure 4a), the process starts by investigating the data in exploration mode. After several iterations, the analyst discovers a finding worth presenting and(a)(b)(c)Figure 4: Three examples of transitions within the CLUE model,highlighting different entry points. Numbers indicate the order inwhich the stages are visited by the user.switches to authoring mode to create a Vistory. Finally, the analystpreviews the Vistory in presentation mode and makes it available toothers. In the second example (Figure 4b), an editor creates a Vistory in the authoring mode, starting with an existing analysis session. After previewing the story in presentation mode and continued editing in authoring mode, the editor notices that the content ofthe story could be improved, and switches back to exploration modein order to refine the visualization. Subsequently, the user returns toauthoring mode and finishes the Vistory. In the last example (Figure 4c), a consumer starts by watching an existing Vistory. In thatprocess, the consumer becomes curious about the consequences ofadding another dataset to the analysis. The consumer switches toexploration mode and picks the relevant state, from where she canstart her own analysis. Based on this new analysis, she creates anew Vistory that can be shared with collaborators.These simple workflow examples illustrate that users can enterthe process in any mode and switch freely between modes. Notethat, from a conceptual point of view, switching from explorationdirectly to presentation is possible without going through an authoring step. While this can be useful when the only goal is to reproduce an analysis, authoring is required as a transition betweenexploration and presentation in practice to create an informativeand concise story.4. Realizing the CLUE ModelIn this section we demonstrate the practical use of the CLUEmodel. We discuss how visual exploration tools can be extendedby adding provenance capturing, authoring, and presentation capabilities. We also describe a prototype library for capturing andmanaging provenance and story data as well as a prototype thatdemonstrates the flexibility and efficacy of our model.The library is used by a Visual Exploration Application. It is important to note that the Visual Exploration Application is not restricted to a specific visual exploration tool, but only has to complywith a set of basic requirements (see Section 5) and make appropriate calls to the library. The application is shown in all CLUE modes,although it is set to read-only during authoring and presentation.The CLUE library consists of several building blocks. At its coreis the provenance graph data model that forms the back end ofCLUE that is used to store the captured exploration process. Theother important components of the library are the provenance viewand the story view.c 2016 The Author(s)Computer Graphics Forum c 2016 The Eurographics Association and John Wiley & Sons Ltd.
S. Gratzl et al. / From Visual Exploration to Storytelling and Back AgainThe Provenance View provides a scalable visualization of theprovenance graph. In exploration mode, a simplified version of thegraph gives the analyst an overview of the provenance, by showing,for example, the states leading to the current one. When the systemis in authoring mode, the provenance view is used for navigatingand selecting the states of the exploration process that should bepart of the story.The Story View visualizes the elements of the story. Dependingon the selected mode, the view shows different features. In presentation mode, it is essentially a stepper interface for the curated story.When the system is in authoring mode, it enables users to create,manage, and edit stories.The visual components can be active in more than one mode andshow different levels of detail depending on the mode. A switch between modes results in the addition, adaption, or removal of certainparts of the user interface. We apply animated transitions to supportusers in maintaining their mental model during mode changes. Inaddition, the current exploration state along with the mode used areencoded in the URL of the visual web application. This allows usersto conveniently share states and Vistories by exchanging links.4.1. Provenance Graph Data ModelThe provenance graph data structure used in CLUE consists of fournode types: state, action, object, and slide. Figure 5 illustrates therelationships between the different node types. An action transforms one state into another by creating, updating, or removingone or multiple objects. A state consists of all objects that are active at this point of the exploration. A slide points to a state alongwith annotations and descriptions explaining the state. A Vistory ismade up of a sequence of slides. Switching between slides triggersactions that transition to the state associated with the target slide.Figure 5: The provenance graph data model consists of four different node types that are connected with each other by one or moreedges.Object and action nodes are generic, and refer to the applicationdependent implementation. In order to improve the visualization,additional metadata about objects and actions is stored. For objectswe also store a type. We distinguish five types: data, visual, layout,logic, and selection. For actions we also store an operation: create,update, and remove.Data actions deal with the addition, removal, or subsetting ofdatasets within the application. An example of a data action in ourGapminder usage scenario is the assignment of an attribute to anaxis of the plot. Visual actions (e.g., switching an axis to logarithmic scale) manipulate the way datasets are shown to the user.Layout actions manipulate the layout of a visualization (e.g., manipulating the axes order in parallel coordinates or hiding the categorical color legend in a Gapminder plot). Logic operations, suchc 2016 The Author(s)Computer Graphics Forum c 2016 The Eurographics Association and John Wiley & Sons Ltd.as triggering a clustering algorithm, are concerned with the analytical aspect of the applications, Finally, selection actions encompassuser-triggered selections of data in the visualization.A state is characterized by the sequence of actions leading to it.Therefore, restoring a state is achieved by executing its corresponding actions. Jumping from one state to another is implemented byreverting the actions from one state to a common ancestor and executing the actions necessary to reach the target state.In addition, for the purpose of transitions, the action sequence iscompressed before being executed by removing redundant actions.A sequence of five selections, for example, will be replaced by thelast one, since all the others are just intermediate states that do notinfluence the final selection. Similarly, when a create-and-removeaction is associated with the same object, we remove both actions,as they neutralize each other. This compression avoids the execution of superfluous actions.4.2. Provenance VisualizationAs provenance graphs grow quickly during the exploration process,it is challenging to develop an effective visualization for it. Ourprovenance visualization is based on a node-link tree layout thatwe combine with a Degree-of-Interest (DoI) function to adapt thedetail level of nodes [Fur86]. An example of the provenance visualization for one of our usage scenarios can be seen in Figure 1(c),and a close-up in Figure 6.Layout We use a vertical node-link layout as the basis for theprovenance graph visualization. Nodes represent states, whileedges represent actions transforming one state into another. However, instead of using a plain balanced tree, we reorder and skewit such that the currently selected node and all its ancestor nodesin the path to the root are aligned vertically on the right side. Theremaining nodes and branches are then lined up on the left side.This strategy leaves space for details of the selected nodes and theirancestors, including labels describing the state and thumbnails previewing the state of the visualization. However, the layout needs tobe updated when the user selects a different state. We use animatedtransitions to convey such changes.Detail Level We assign each node a DoI value that is influencedby several factors, including the current state selection, whether thestate is an ancestor of the selected state (the distance term of theDoI function), and several filtering options that can be defined bythe user (the a priori interest term of the DoI function). The DoIcomputed for each node is then used to adapt its representation witha combination of semantic and geometric zooming. We distinguishbetween four levels of increasing node detail.Level 1:Level 2:Level 3:Level 4:the state represented as a bulleticon describing the action associated with this statelabel describing the action associated with this statethumbnail of the application at the given stateNodes of all detail levels are shown in Figure 6.
S. Gratzl et al. / From Visual Exploration to Storytelling and Back Againand captions, and state slides, which are associated with a specificstate in the provenance graph. Both slide types can be annotatedusing multiple methods, such as styled text, scalable arrows, andfreely adjustable boxes.Layout We use a vertical layout to present the slides, where weuse the y-axis as a pseudo-timeline. The higher a slide, the longerit will be shown when automatically playing the story. Similarly,the more space between two slides, the longer the transition between them. Both transition and slide duration can be manipulatedby dragging the top and bottom border lines of the slide, respectively. We chose a vertical layout because of (1) the alignment ofthe story with the provenance graph, and (2) the better readabilityof horizontal labels.Figure 6: Close-ups of the provenance and story views. Based onthe DoI, exploration states are represented at different levels of detail in the provenance view. The structure of the Vistory, shown onthe right, corresponds to a path through the provenance graph,which is shown as a thick black line in the provenance visualization. Both the active slide in the story view and the associated exploration state in the provenance graph are highlighted in orange.Interaction Users can interact with the provenance graph visualization in several ways. Selecting a node will show the corresponding state in the application. At the same time the selection of a nodetriggers a re-layout of the provenance graph visualization, since theDoI values of the nodes change according to the selection.The user can bookmark a state for later use, add tags, or addnotes. Additional metadata can then be used to filter the states inauthoring mode, which enables a more efficient story editing process.To ensure reproducibility, it is important to be able to prevent auser from modifying the provenance graph. However, when authoring, the editor might want to improve a previous state, for example,by changing an axis scale from linear to logarithmic. Rather thanallow the user to change existing states, we create a new branch.However, when starting a new branch, a user would need to redoall other actions that came after that was previously updated. Weaddress this problem by allowing the user to apply a subbranch ofa provenance graph to any other state. By dragging one node ontoanother, the actions are replayed automatically if possible. An example where this is not possible is when the user seeks to manipulate an object that has already been removed in one of the earlierstates.The consequence of preventing users from modifying the provenance information is that the graph grows rapidly. Although ourprovenance visualization supports multiple detail levels, the designand implementation of a truly scalable provenance visualizationwas not the main focus of CLUE and is therefore open for futureresearch.4.3.
S. Gratzl et al. / From Visual Exploration to Storytelling and Back Again 2.1. Provenance In the context of our work, provenance of the state of a visual ex-ploration process refers to all inf