Transcription
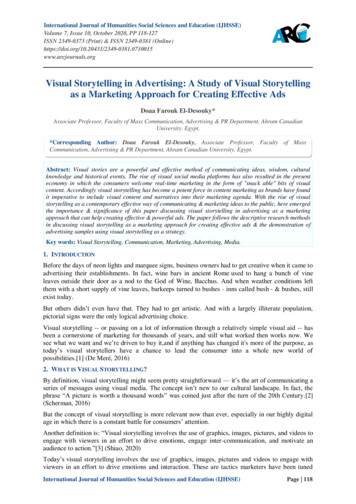
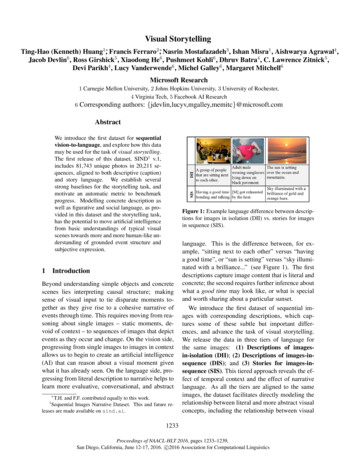
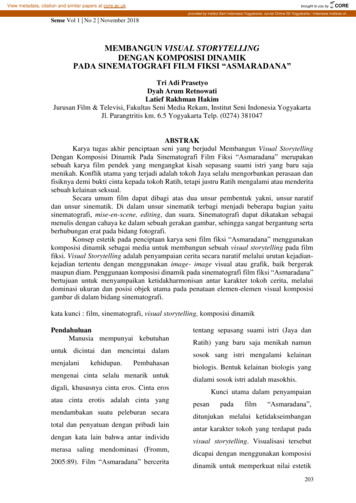
Visual Storytelling – Knowledge and Understandingin EducationLinnéa StenlidenISV, Linköping University,Norrköping, SwedenandMikael JernNCVA, MIT, Linköping University,Norrköping, SwedenABSTRACTThis paper presents an ongoing research project of use andlearning with geographic information visualization and VisualStorytelling (geovisual analytics) in education. The fullydeveloped study will be applied in school settings in order to 1)customize the application for educational purpose, 2) improvethe teaching in social science and 3) study teachers and studentsexperiences and learning. - The application “Open StatisticseXplorer” will be used to improve the students knowledge andunderstanding of sophisticated statistical relations, - Teacherswill be able to, individually and together, develop a dynamicteaching material through storytelling, through the web, Students will be able to, with help of powerful geographicalstatistics, explore statistical relations on their own. A betterunderstanding of how educators and their students can elicitdeeper user understanding and participation by exploitingdynamic web-enabled statistics visualization is of importance.Results form an usability study in this project are promising.Together with the associated science of perception in learning inrelation to the use of multidimensional spatio-temporalstatistical data this research will contribute to the research fieldsof geovisual analytics as well as educational science.Keywords: Geovisual Analytics, Storytelling,Statistics, Interaction, Learning. Social Science.the OECD [14] and the World Bank [22]. These are producingwhat is often called information overload. Statistics have oftenan unfortunate image of being boring – even though some of usknow that they are in fact fascinating and exciting. Do teachersknow about existing public statistics and its potential for a moreengaging education? – Probably not sufficiently. Can they findthem? – Not as easily as statisticians tend to think. And if theyeventually get to them, do they actually understand them in sucha way that they can use them in their educational activities?These are issues that are dealt with in this study. It concentrateson how to give our teachers innovative tools that can makenational and regional statistics interactive visuallyunderstandable and useable to students.GeographicalINTRODUCTIONA well-educated young population is central to the social andeconomic well-being of regions and individuals. Educationplays a key role in providing young people with the knowledge,skills and competencies needed to participate effectively insociety. Official statistics is a rich and important source ofinformation and have therefore an important role in education.Official statistics published with geovisual analytics may helpto improve and even change the terms and structures forlearning about our society.Official statistics are statistics published by governmentagencies or other public bodies such as internationalorganisations. They provide quantitative or qualitativeinformation on all major areas of citizens' lives, such aseconomic and social development, living conditions, health,education and the environment. Official statistics can be foundon web sites of national statistical agencies such as StatisticsSweden [18] and international organisations such asFigure 1 The role official statistical data can play in education. WorldeXplorer showing fertility rates vs. population age 0-14 in three linkedviews map, scatter plot and histogram.We build upon previous research [8] including our web-enabledapplication Open Statistics eXplorer [9] a platform that isemerging as a de facto standard in the statistics community forexploring and communicating statistics data (figure 2). Weintroduce this innovative platform for integrated statisticsgeovisual analysis, collaboration and publication processfacilitating storytelling aimed at producing statisticaleducational content in support of an automatic authoringprocess. The author, in this case a teacher, should simply press abutton to publish the gained knowledge from a visual interactivediscovery process to let the students then interact with thevisualized content. We exploit our latest research focusing onthe most ancient of social rituals “storytelling” – telling a story
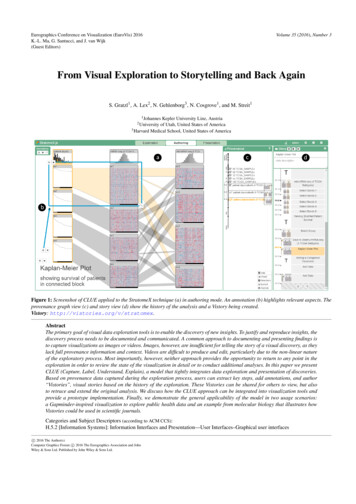
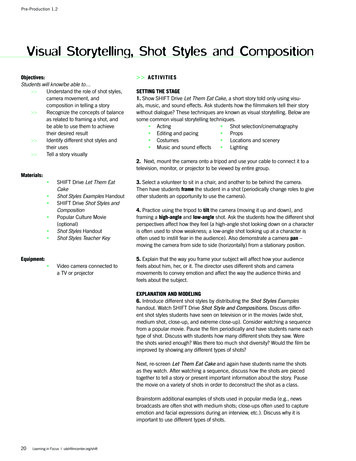
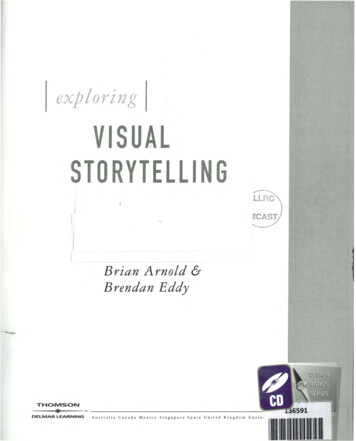
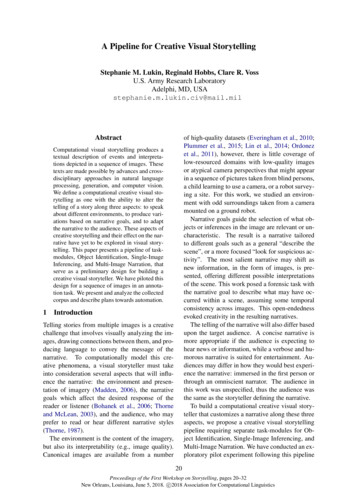
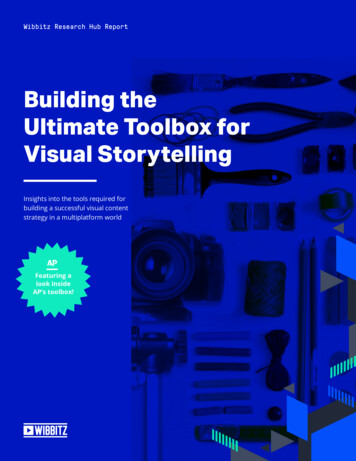
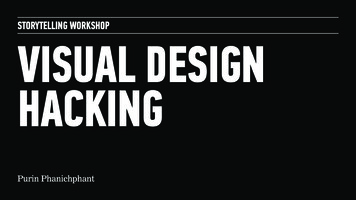
Figure 2 World eXplorer with 3 time-linked views showing the world “fertility rates” during 1960-2008; map, scatter plot (fertility rate vs. age 0-14) andtime chart; comparing 4 countries Nigeria, South Africa, China and Italy. The story is published to the right side. Students learn that central Africa maintainsa high fertility rate (Nigeria), while South Africa starts in 1960 at the same level but then has a reduced trend. The students can interact and changeindicators to discover reasons behind this trend and knowledge.about a region’s development over time and shape the measureof economic growth and well-being. The storytelling givesopportunities to find discoveries that more engagingly draw usinto reflections about the knowledge on how life is lived - andcan be improved – compare nations and local regions and inaddition let the student dynamically participate in this process.The effectiveness of educations rests in many ways uponeducators to empower their students to become effective learnersand knowledge creators.metadata and hyperlinks in relation to the analytics reasoning.The teacher can get feedback from colleagues then adopts thestory and 5) finally publishes “tell-a-story” using a “Vislet” thatis embedded in educational blogs or HTML pages providingstudents with an interactive learning experience.With the ubiquitous availability of geovisual analytics the timehas come to explore the possibilities for educators to incorporatethese tools into a variety of subject courses and teachingpractices [12]. The potential for educators to harvest thesespowerful tools, to present and explore scientific data sets, oughtto be offered and in focus for further investigation.AIMFigure 3 The teacher is the author in this storytelling loop.A storytelling mechanism is initiated (figure 3) for the teacherto: 1) import statistical data; 2) explore and make discoveriesthrough trends and patterns and derive insight - gainedknowledge is the foundation for 3) create a story that can be 4)shared with colleagues and reach consensus and trust. Visualdiscoveries are captured into snapshots together with descriptiveWe think that interactive tools for teaching such as GIS,visualization, computer models and animations that allow theeducator and the student to manipulate the environment and theoutcome of the learning process are effective for learning [17].There are research and usability testing of geovisualizationtools, but there is a lack of studies of young students learningprocesses. A better understanding of how educators and theirstudents can learn by and elicit better user understanding andparticipation by exploiting these tools is of importance. We areimplementing these tools – geovisual analytics – applied insocial science – to help and engage educators to communicateprogress initiatives, measuring economic, social, educational,health and environmental developments to young students to: Examine the students’ development of knowledge andunderstanding by using visual analytic storytelling methods inan educational setting Investigate teachers experiences when using those methods Contribute to further development of geovisual analytics foreducational purposes according to the pedagogical findings.
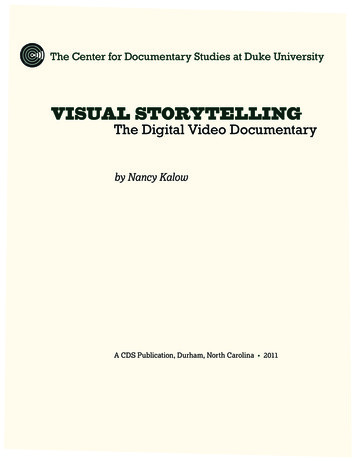
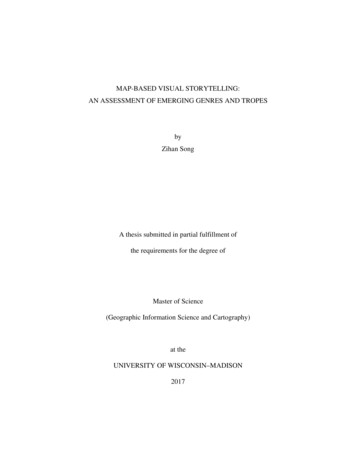
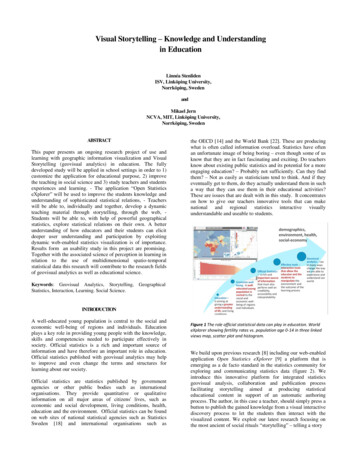
RELATED WORKVolumes of official national and regional statistical data aretoday generated by statistics offices all over the world and storedin public databases such as the OECD Regional database [13]but not used as effectively as one would wish. Research has, upto now, focused on tools that explore statistical data whilemethods that communicate and educate understanding andknowledge with clarity, precision, and efficiency has notachieved the same attention. Publishing official statisticsthrough assisted content creation with emphasis on visualizationand metadata represents a key advantage of our storytelling andprobably has a potential to transform conditions and structuresfor learning.Little focus has been given to make geovisual analyticstechnologies useful and accessible to educators and advancevisual presentation to students. Nor has research in any greaterextension yet, tried to uncover and specify factors thatencourage or discourage deeper understanding or learning withmulti external representational tools (MERs) like the geovisualanalytics offer [1].There is research on learning with MERs which has shown thatwhen learners can interact with an appropriate representationtheir performance is enhanced. The issue is not anymore if amultiple external representation is effective or not, but about thecircumstances that influence the effectiveness of MERs [6].There are a number of design factors that should be consideredwhen addressing aspects of learning with MERs, not onlyincluding the focus on the form of the representational system.A deeper understanding of learning environments with multipleexternal representations can best be reached by also consideringthe functions, the cognitive tasks as well as the learner itself [2].Geovisual analytics may promote the educator in the task totranslate information to be learned into a format appropriate tothe learner's current state of understanding. As far as instructionis concerned, the tool will support the educator to encourage thestudents to discover principles and consistency by themselves.The educator and students then might be supported by the tool toengage in an active dialog (i.e., Socratic learning). The contentshould be organized in a spiral manner so that the studentcontinually builds upon what they have already learned [3]. Thisbuilds upon the idea of learning as an active process in whichlearners communicate and construct new ideas or concepts basedupon their current/past knowledge [21]. The learner selects andtransforms information, constructs hypotheses, and makesdecisions, relying on a cognitive structure to do so. A cognitivestructure (i.e., schema, mental models) provides meaning andorganization to experiences and allows the individual to "gobeyond the information given" [4]. In order to accomplish this,geovisual analytics must try to make connections betweenknowledge the learner has and the knowledge being taught. Aninterdisciplinary research in cognition and geovisual analyticsincludes therefore pressing research questions and theoreticalperspectives.Figure 4 The teacher (author) uses Statistics eXplorer to first import statistical data, explore and make discoveries through trends and patterns and deriveinsight. A teachers understanding is then the foundation for creating a story where visual discoveries are captured into snapshots together with descriptivetext and finally publishes “tell-a-story” to the students using a “Vislet” that is embedded in a web documents that now becomes an interactive learningexperience.
THE OPEN STATISICS EXPLORER PLATFORMThe use of geovisual analytics have in many waysrevolutionized the way we are able to experience and exploreour world. A primary target group for our storytelling is theeducators and their students. By introducing the use of this toolin their process of learning and knowledge construction theywill have the opportunity to discover and take advantage ofwhat this technology offer. Our geovisual analytics suppliespossibilities for the educator to orchestrate the educationalplanning and teaching. The Open Statistics eXplorer platform[10] is customized from our Web-enabled GAV Flash classlibrary, programmed in Adobe’s object-oriented languageActionScript and includes a collection of innovative geographicand information visualizations adapted to statistics datahandling.Figure 4 shows a seamless integration of a teacher authoringtool, storytelling and publishing interactive education documentsfor official statistics and it is based on: Authoring: data provider (spreadsheet and database); data manager;visualization methods (choropleth map, scatter plot, table lens,histogram, parallel axes plot, time graph, data table); coordinatedand linked views; map layers; analytic tools (dynamic query, filteroperation); regional categorization; profile plot; highlight regions;motion charts; dynamic colour scale and legend.Storytelling: snapshots capture mechanism; story editor; metadatawith hyperlinks for analytical reasoning; import and export story. Publisher: Vislet (widget); select visualizations used in a Vislet(map, scatter plot histogram etc), create HTML code; embed HTMLcode in web pages, wikis or blogs.The methodological concept offers the educator to: Choose educational content: According to what content theteaching deals with statistical indicators and related geographicalregions (countries, counties, municipalities etc) are uploaded to theplatform. Use the multiple linked views to simultaneously explore thecontent and highlight trends and knowledge through:oAn interactive map: possibilities to different interactivefeatures that support a spatial analytical reasoning processsuch as tooltips, brushing, highlight visual inquiry andconditioned statistics filter mechanisms.oA motion chart: also offer the interactive possibilities to findpatterns, connection and discover outliers among theindicators as well as show time series.oTime series: give opportunity to dynamically show indicatorsdevelopment over time. Produce an educational text: the educator can express (in her ownlanguage) a descriptive text and point out important spotlights of thecontent/indicators or even provide questions for students. Create snapshots: in the educational text the educator is able tohighlight different content and a link is created to the interactivemap or motion chart.Figure 5 Example of an interactive educational document based on public OECD data with educational text, map, motion chart, snapshots and time series –the methodological concept. For an interactive example of the educational tool or teaching material click on the 1.htm
METHODThis research project is interdiciplinary and includes severaldifferent studies. There are two different main research areascontributing, the technological development of the tool and theresearch of using the tool in an educational context.Theoretical starting pointsWith a major interest in studying human understanding andlearning within complex technology mediated learningenvironments the research builds on a number of analyticalconcerns and assumptions. The research has a socio-culturalperspective on learning [21] together with perspectives on thesignificance of visual aspects on learning [5]. To study alearning process in a socio cultural perspective three concurrentfactors ought to be considered; how do intellectual toolsdevelop, how do the use of physical artefacts develop and whatdoes communication and cooperation look like in humancollective contexts [19], [20]. The methodological position ofthe study is connected to the growing body of video basedstudies of social interaction in a context where technologies areused [7].DesignThe studies within the educational research context are allapplied in school settings. The research methods are mainlyqualitative. The projects status: 1) a pilot- and a usability studyof the tool have been accomplished and were carried out in onesingle class in an elementary school. 2) an empirical study ofstudents learning with geographic information visualization andVisual Storytelling has been conducted in three differentschools, this study is in its analytical phase. 3) a major study atall public junior high schools in a municipality in Sweden willbe carried out in order to 1) customize the application foreducational purpose, 2) improve the teaching in social scienceand 3) study teachers and students experiences and learning.ProcedureTo address the aims and issues outlined above, the latest and themajor empirical study will be carried out at all public junior highschools in a municipality in Sweden. All teachers working inthese schools, educating students at the age 13 – 15 (grade 6 – 9)in social science will be invited to take part in this study togetherwith their students. The study will be divided in different phases.In phase one the teachers will be introduced to the tool andproduce educational Vislets to be published on their owneducational blogs on the internet. In phase two the students willwork with the interactive Vislets. At this stage a group of 4 – 6teachers and their students will be selected for participation in adetailed oriented research phase. In this group 1) Questionnaireswill be used to measure the student’s performance 2) Videoobservations will be done to follow the students work 3) Speakaloud interviews will be carried out to investigate the student’sunderstanding and learning. The teachers in the group will beinterviewed both individually and in group and they will beasked to do notes in a log.Ethical considerationsIn all studies, the ethical issues are taken into account by askingfor consent to realize the data collection by the participatingteachers, the students and their parents. They are all informedabout the study, the voluntariness of the participation and thatthe involvement could at any time be terminated.Implementation and lingering effectsTo control and implement the study initial seminars andworkshops will be held. Development of education, training-courses and support will be arranged. Support forimplementation in the educational setting as well as technicalsupport will be offered to all teachers using the tool. The study’spurpose in itself is to function as a catalyst for developing theuse of interactive information communication technology inschools. The object is also to develop and customize thegeovisual analytics in order to the demands of the educationalsettings and the students learning process. NCVA, LinköpingUniversity will after the study give The Educational Departmentof the participating municipality free authorization and licencewithout charge for teacher’s continuing use of the eXplorerStatistics. In turn the Educational Department is committed tothe responsibility of running the eXplorer Statistics forsupplying the maintenance of the teachers use. In this way themission of long term conducting will be guaranteed.RESULTSThe usability study was carried out to examine the effectiveness,efficiency and user satisfaction of the geovisual analytics. Thecase-study was carried thorough in the school setting and theparticipants were 12 years old. Altogether 28 students wereparticipating. Three methods for evaluation were used; 1)Questionnaires to measure the student’s performance 2)Observations to follow the student’s efficiency when working 3)Interviews to investigate the student’s satisfaction of using theVislet. The results show that the storytelling methods are usablewithin the school. The tool seems to be understandable anduseful even for young students. It is for the students easy tounderstand and adjust the interactive functions and indicators.As many as 96 % percent of the students were able tounderstand and control the interactive tools correctly, aszooming, opacity and different kinds of transparency of the map.All of the students were able to understand the possibilities offinding, choosing and adjust the indicators at different places. 93% of them were also able to at all times exact control theindicators. 85 % of the students were able to fully understand theconcept of the linked views. The results also show that the toolis efficient to students in supporting their searching andapprehension of connections between different kinds ofstatistical data. Here meaning that they understood connectionbetween a region/country at the map and the correspondingbubble in the scatter-plot and correct read and analyze theinformation. The user satisfaction among the students wasextensive, at least used as brand new tool – the long lastingeffects are however unknown [16].The empirical study of students learning has been carried out inthree Swedish elementary schools, in grade four up to grade six.The aim is to investigate: How do conceptual and perceptual factors interact inlearning with different representations?How does learning differ with presented or constructedrepresentations?What are the costs and benefits of learning with interactiveor dynamic representations?What are the conditions under which learning is enhancedby combining textual and graphical representations?Altogether 100 students have been involved. The teachers of theparticipating students’ have been introduced to the tool; theyhave made educational plans according to the curricula,organized the content and the tasks by involving use of “theeXplorer platform”. The students work has been followed byqualitative methods. Right now interaction analysis [11] and the
DeFT framework [1] are used for the analytical concerns, toclarify the pedagogical functions that multi externalrepresentations (MERs) serve, in this case the geovisualanalytics and in so doing, consider the ways that a multirepresentational system has in impact upon the process oflearning and comprehension.[5] J. Gibson. The Ecological Approach ToVisual Perception, Psychology Press.1986.The next step is to carry through the major empirical study injunior high schools, here presented in the method chapter.[7] C. Heath, & P. Luff, “Technology in action”, MA:Cambridge University Press, 2000.CONCLUSIONSWithin an international perspective our research builds oncollaborating work with OECD since 2008 and we havesupplied advanced statistics visualization technology to thisorganization [13]. We have also been involved in thedevelopment of the PISA2009 profiles [15]. Another partner isthe European Commission that have used Statistics eXplorer forinternal analysis of data from Eurostat. The research concerningthe learning perspective as presented in this study is highlyrequested from the international research field of learning andinstruction (for example European Association Research ofLearning and Instruction). The special interest group (SIG2) ofcomprehension of text and graphics in this research field,focuses on how learning is influenced by the form ofrepresentation that learners study. The field considers all formsof representations including but not limited to, text, pictures,graphs, diagrams, concept maps, animations, equations, virtualreality, information and scientific visualization, haptics,multimedia, hypermedia, and simulations. Research on learning,when using these aids, is essential. There is research of learningwith multimedia environments in different experimental studiesbut there is hardly any research done of this in real schoolcontexts i.e. in a socio cultural perspective.All together the results of this study will give valuablecontributions to the development of these research fields. Thegeovisual analytics technique introduced in this paper allows theteacher to communicate with student through interesting andimportant discoveries captured into snapshots together withdescriptive text. Selected indicators and visual representationscan be published together with their metadata, thus facilitatingthe comprehension of statistical information for educationalpurpose. We believe that this innovative storytelling technologycan be useful for a next-generation of educational dynamicbooks for learning about different phenomena in the world, asexamples demonstrated in this paper. At the same time, theVislet technique help developing agile on-line educationalpublications, which draw the attention on recent trends andinequalities.REFERENCES[6] S. R. Goldman, D. L Mertz, & J. W. Pellegrino,”Individual differences in extended practice functions andsolution strategies for basic addition facts”. Journal ofEducational Psychology, 81(4), pp. 481-496, 1989.[8] M. Jern, “Collaborative Educational GeoAnalytics appliedto large statistics temporal data”, Reviewed proceedings,CSEDU 2010c, Conference on computer supportededucation, Valencia, April 2010a.[9] M. Jern, “Educating students in official statistics usingembedded geovisual analytics storytelling methods”,Reviewed Proceedings in Eurographics 2010,Norrköping, May 2010b.[10] Jern, M, “Explore, Collaborate and Publish OfficialStatistics for Measuring Regional Progress”, CooperativeDesign, Visualization, and Engineering 7thInternational Conference, CDVE 2010, Mallorca, Spain,September 19-22, 2010. Lecture Notes in ComputerScience, pp 189-198, ISBN-10 3-642-16065-4 SpringerBerlin Heidelberg New York, 2010c.[11] B. Jordan, & A. Henderson, “Interaction alaysis:Foundation and practice”. The Journal of the LearningSciences, 4 (I), 1995, pp. 39 – 103.[12] M. Kinzel, D. Wright, “Using Geovisualizations in theCurriculum: Do Multimedia Tools Enhance GeographyEducation?” Paper Number 1290, EnvironmentalSystems Research Institute Education User’sConference, 2008.[13] OECD regional stics/.[14] OECD statsportal. www.oecd.org/statsportal.[15] PISA 2009 [16] L. Stenliden, M. Jern, “Educating official statistics usinggeovisual analytics storytelling methods”, Reviewedproceedings, International Technology, Education andDevelopment Conference INTED, Valencia, 2010.[17] M. Solem, K. Foote, J. Monk, Aspiring Academics: AResource Book for Graduate Students an Early CareerFaculty, Prentice Hall. 2009.[18] Sweden Statistics. www.scb.se.[1] S. Ainsworth, “DeFT: A Conceptual Framework ForConsidering Learning with Multiple Representations”,Learning and Instruction, 16(3), 2006, pp. 183-198.[19] R. Säljö, “Learning as the use of tools: a socioculturalperspective on the human- technology link”. Ed by K.Littelton, & Light, P Learning with computers –analysing productive interaction, 1999.[2] S. Ainsworth, "How Should We Evaluate MultimediaLearning Environments?", Understanding MultimediaDocuments, eds. J. Rouet, R. Lowe & W. Schnotz,Springer US, 2008, pp. 249-265.[20] R. Säljö, & H.C. Arnseth, Making sense of epistemiccategories. Analysing students' use of categories ofprogressive inquiry in computer mediated collaborativeactivities, Blackwell Publishing Ltd. 2007.[3] J. Bruner, Towards a Theory of Instruction, Cambridge,MA: Harvard University Press, 1966.[21] L. Vygotsky, Thougt and language. Edited by Kozulin,Alex. MIT Press, Cambridge, 1986.[4] J. Bruner, Going Beyond the Information Given, NewYork: Norton, 1973.[22] The Worldbank. www.worldbank.com.
A storytelling mechanism is initiated (figure 3) for the teacher to: 1) import statistical data; 2) explore and make discoveries through trends and patterns and derive insight - gained knowledge is the foundation for 3) create a story that can be 4) shared with colleagu