Transcription
The Physics of Sound1The Physics of SoundSound lies at the very center of speech communication. A sound wave is both the end product of the speechproduction mechanism and the primary source of raw material used by the listener to recover the speaker's message.Because of the central role played by sound in speech communication, it is important to have a good understandingof how sound is produced, modified, and measured. The purpose of this chapter will be to review some basicprinciples underlying the physics of sound, with a particular focus on two ideas that play an especially importantrole in both speech and hearing: the concept of the spectrum and acoustic filtering. The speech productionmechanism is a kind of assembly line that operates by generating some relatively simple sounds consisting ofvarious combinations of buzzes, hisses, and pops, and then filtering those sounds by making a number of fineadjustments to the tongue, lips, jaw, soft palate, and other articulators. We will also see that a crucial step at thereceiving end occurs when the ear breaks this complex sound into its individual frequency components in much thesame way that a prism breaks white light into components of different optical frequencies. Before getting into theseideas it is first necessary to cover the basic principles of vibration and sound propagation.Sound and VibrationA sound wave is an air pressure disturbance that results from vibration. The vibration can come from a tuningfork, a guitar string, the column of air in an organ pipe, the head (or rim) of a snare drum, steam escaping from aradiator, the reed on a clarinet, the diaphragm of a loudspeaker, the vocal cords, or virtually anything that vibrates ina frequency range that is audible to a listener (roughly 20 to 20,000 cycles per second for humans). The twoconditions that are required for the generation of a sound wave are a vibratory disturbance and an elastic medium,the most familiar of which is air. We will begin by describing the characteristics of vibrating objects, and then seewhat happens when vibratory motion occurs in an elastic medium such as air. We can begin by examining a simplevibrating object such as the one shown in Figure 3-1. If we set this object into vibration by tapping it from thebottom, the bar will begin an upward and downward oscillation until the internal resistance of the bar causes thevibration to cease.The graph to the right of Figure 3-1 is a visual representation of the upward and downward motion of the bar.To see how this graph is created, imagine that we use a strobe light to take a series of snapshots of the bar as itvibrates up and down. For each snapshot, we measure the instantaneous displacement of the bar, which is thedifference between the position of the bar at the split second that the snapshot is taken and the position of the bar atrest. The rest position of the bar is arbitrarily given a displacement of zero; positive numbers are used fordisplacements above the rest position, and negative numbers are used for displacements below the rest position. So,the first snapshot, taken just as the bar is struck, will show an instantaneous displacement of zero; the next snapshotwill show a small positive displacement, the next will show a somewhat larger positive displacement, and so on. Thepattern that is traced out has a very specific shape to it. The type of vibratory motion that is produced by a simplevibratory system of this kind is called simple harmonic motion or uniform circular motion, and the pattern that istraced out in the graph is called a sine wave or a sinusoid.Figure 3-1. A bar is fixed at one and is set into vibration by tapping it from the bottom. Imagine thata strobe light is used to take a series of snapshots of the bar as it vibrates up and down. At eachsnapshot the instantaneous displacement of the bar is measured. Instantaneous displacement is thedistance between the rest position of the bar (defined as zero displacement) and its position at anyparticular instant in time. Positive numbers signify displacements that are above the rest position,while negative numbers signify displacements that are below the rest position. The vibratory patternthat is traced out when the sequence of displacements is graphed is called a sinusoid.
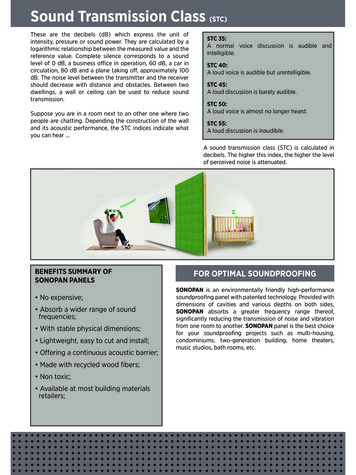
The Physics of Sound2Basic TerminologyWe are now in a position to define some of the basic terminology that applies to sinusoidal vibration.periodic: The vibratory pattern in Figure 3-1, and the waveform that is shown in the graph, are examples ofperiodic vibration, which simply means that there is a pattern that repeats itself over time.cycle: Cycle refers to one repetition of the pattern. The instantaneous displacement waveform in Figure 3-1 showsfour cycles, or four repetitions of the pattern.period: Period is the time required to complete one cycle of vibration. For example, if 20 cycles are completed in 1second, the period is 1/20th of a second (s), or 0.05 s. For speech applications, the most commonly used unit ofmeasurement for period is the millisecond (ms):1 ms 1/1,000 s 0.001 s 10-3 sA somewhat less commonly used unit is the microsecond (µs):1 µs 1/1,000,000 s 0.000001 s 10-6 sfrequency: Frequency is defined as the number of cycles completed in one second. The unit of measurement forfrequency is hertz (Hz), and it is fully synonymous the older and more straightforward term cycles per second(cps). Conceptually, frequency is simply the rate of vibration. The most crucial function of the auditory system is toserve as a frequency analyzer – a system that determines how much energy is present at different signal frequencies.Consequently, frequency is the single most important concept in hearing science. The formula for frequency is:f 1/t, where:f frequency in Hzt period in secondsSo, for a period 0.05 s:f 1/t 1/0.05 20 HzIt is important to note that period must be represented in seconds in order to get the answer to come out in cycles persecond, or Hz. If the period is represented in milliseconds, which is very often the case, the period first has to beconverted from milliseconds into seconds by shifting the decimal point three places to the left. For example, for aperiod of 10 ms:f 1/10 ms 1/0.01 s 100 HzSimilarly, for a period of 100 µs:f 1/100 µs 1/0.0001 s 10,000 HzThe period can also be calculated if the frequency is known. Since period and frequency are inversely related, t 1/f. So, for a 200 Hz frequency, t 1/200 0.005 s 5 ms.Characteristics of Simple Vibratory SystemsSimple vibratory systems of this kind can differ from one another in just three dimensions: frequency,amplitude, and phase. Figure 3-2 shows examples of signals that differ in frequency. The term amplitude is a bitdifferent from the other terms that have been discussed thus far, such as force and pressure. As we saw in the lastchapter, terms such as force and pressure have quite specific definitions as various combinations of the basicdimensions of mass, time, and distance. Amplitude, on the other hand, will be used in this text as a generic termmeaning "how much." How much what? The term amplitude can be used to refer to the magnitude of displacement,the magnitude of an air pressure disturbance, the magnitude of a force, the magnitude of power, and so on. In the
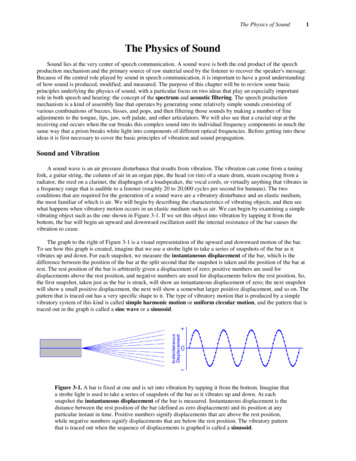
The Physics of Sound3Instantaneous Amp.Instantaneous Amp.present context, the term amplitude refers to the magnitude of the displacement pattern. Figure 3-3 shows twodisplacement waveforms that differ in amplitude. Although the concept of amplitude is as straightforward as the twowaveforms shown in the figure suggest, measuring amplitude is not as simple as it might seem. The reason is thatthe instantaneous amplitude of the waveform (in this case, the displacement of the object at a particular splitsecond in time) is constantly changing. There are many ways to measure amplitude, but a very simple method calledpeak-to-peak amplitude will serve our purposes well enough. Peak-to-peak amplitude is simply the difference inamplitude between the maximum positive and maximum negative peaks in the signal. For example, the bottompanel in Figure 3-3 has a peak-to-peak amplitude of 10 cm, and the top panel has a peak-to-peak amplitude of 20cm. Figure 3-4 shows several signals that are identical in frequency and amplitude, but differ from one another inphase. The waveform labeled 0o phase would be produced if the bar were set into vibration by tapping it from thebottom. The waveform labeled 180o phase would be produced if the bar were set into vibration by tapping it fromthe top, so that the initial movement of the bar was downward rather than upward. The waveforms labeled 90o phaseand 270o phase would be produced if the bar were set into vibration by pulling the bar to maximum displacementand letting go -- beginning at maximum positive displacement for 90o phase, and beginning at maximum negativedisplacement for 270o phase. So, the various vibratory patterns shown in Figure 3-4 are identical except with respectto phase; that is, they begin at different points in the vibratory cycle. As can be seen in Figure 3-5, the system forrepresenting phase in degrees treats one cycle of the waveform as a circle; that is, one cycle equals 360o. Forexample, a waveform that begins at zero displacement and shows its initial movement upward has a phase of 0o, awaveform that begins at maximum positive displacement and shows its initial movement downward has a phase of90o, and so on.1050-5-101050-5-1005101520253035404550Time (ms)Figure 3-2. Two vibratory patterns that differ in frequency. The panel on top is higher in frequencythan the panel on bottom.
Instantaneous Amp.Instantaneous Amp.The Physics of Sound1050-5-101050-5-1005101520253035404550Time (ms)Figure 3-3. Two vibratory patterns that differ in amplitude. The panel on top is higher in amplitude than thepanel on bottom.Phase: 0Phase: 90Phase: 180Phase: 270Figure 3-4. Four vibratory patterns that differ in phase. Shown above are vibratory patterns with phases of 00, 900,1800, and 2700.4
The Physics of SoundInstantaneous Amplitude900180Time - 0/360270Figure 3-5. The system for representing phase treats one cycle of the vibratory pattern as a circle,consisting of 3600. A pattern that begins at zero amplitude heading toward positive values (i.e., headingupward) is designated 00 phase; a waveform that begins at maximum positive displacement and showsits initial movement downward has a phase of 90o; a waveform that begins at zero and headsdownward has a phase of 180o; and a waveform that begins at maximum negative displacement andshows its initial movement upward has a phase of 270o. . The four phase angles that are shown aboveare just examples. An infinite variety of phase angles are possible.Figure 3-6. A spring and mass system whose natural vibrating frequency is controlled by twoparameters: (1) the stiffness of the spring (the stiffer the spring the higher the natural vibratingfrequency), and (2) the mass of the material that is suspended from the spring (the greater the mass, thelower the natural vibrating frequency).Springs and MassesWe have noted that objects can vibrate at different frequencies, but so far have not discussed the physicalcharacteristics that are responsible for variations in frequency. There are many factors that affect the naturalvibrating frequency of an object, but among the most important are the mass and stiffness of the object. The effectsof mass and stiffness on natural vibrating frequency can be illustrated with the simple spring-and-mass systemsshown in Figure 3-6. In the pair of spring-and-mass systems to the left, the masses are identical but one spring isstiffer than the other. If these two spring-and-mass systems are set into vibration, the system with the stiffer springwill vibrate at a higher frequency than the system with the looser spring. This effect is similar to the changes in5
The Physics of Sound6frequency that occur when a guitarist turns the tuning key clockwise or counterclockwise to tune a guitar string byaltering its stiffness. 1The spring-and-mass systems to the right have identical springs but different masses. When these systems areset into vibration, the system with the greater mass will show a lower natural vibrating frequency. The reason is thatthe larger mass shows greater inertia and, consequently, shows greater opposition to changes in direction. Anyonewho has tried to push a car out of mud or snow by rocking it back and forth knows that this is much easier with alight car than a heavy car. The reason is that the more massive car shows greater opposition to changes in direction.In summary, the natural vibrating frequency of a spring-and-mass system is controlled by mass and stiffness.Frequency is directly proportional to stiffness (S F ) and inversely proportional to mass (M F ). It is important torecognize that these rules apply to all objects, and not just simple spring-and-mass systems. For example, we willsee that the frequency of vibration of the vocal folds is controlled to a very large extent by muscular forces that actto alter the mass and stiffness of the folds. We will also see that the frequency analysis that is carried out by theinner ear depends to a large extent on a tuned membrane whose stiffness varies systematically from one end of thecochlea to the other.Sound IMEAs was mentioned at the beginning of this chapter, the generation of a sound wave requires not only vibration,but also an elastic medium in which the disturbance created by that vibration can be transmitted (see Box 3-1 [belljar experiment described in Patrick's science book - not yet written]). To say that air is an elastic medium means thatair, like all other matter, tends to return to its original shape after it is deformed through the application of a force.The prototypical example of an object that exhibits this kind of restoring force is a spring. To understand themechanism underlying sound propagation, it is useful to think of air as consisting of collection of particles that areconnected to one another by springs, with the springs representing the restoring forces associated with the elasticityof the medium. Air pressure is related to particle density. When a volume of air is undisturbed, the individualparticles of air distribute themselves more-or-less evenly, and the elastic forces are at their resting state. A volume ofair that is in this undisturbed state it is said to be at atmospheric pressure. For our purposes, atmospheric pressurecan be defined in terms of two interrelated conditions: (1) the air molecules are approximately evenly spaced, and(2) the elastic forces, represented by the interconnecting springs, are neither compressed nor stretched beyond theirresting state. When a vibratory disturbance causes the air particles to crowd together (i.e., producing an increase inparticle density), air pressure is higher than atmospheric, and the elastic forces are in a compressed state.Conversely, when particle spacing is relatively large, air pressure is lower than atmospheric.iiFigure 3-7. Shown above is a highly schematic illustration of the chain reaction thatresults in the propagation of a sound wave (modeled after Denes and Pinson, 1963).1The example of tuning a guitar string is imperfect since the mass of the vibrating portion of the string decreases slightly as the string istightened. This occurs because a portion of the string is wound onto the tuning key as it is tightened.
The Physics of Sound7When a vibrating object is placed in an elastic medium, an air pressure disturbance is created through a chainreaction similar to that illustrated in Figure 3-7. As the vibrating object (a tuning fork in this case) moves to theright, particle a, which is immediately adjacent to the tuning fork, is displaced to the right. The elastic forcegenerated between particles a and b (not shown in the figure) has the effect a split second later of displacing particleb to the right. This disturbance will eventually reach particles c, d, e, and so on, and in each case the particles will bemomentarily crowded together. This crowding effect is called compression or condensation, and it is characterizedby dense particle spacing and, consequently, air pressure that is slightly higher than atmospheric pressure. Thepropagation of the disturbance is analogous to the chain reaction that occurs when an arrangement of dominos istoppled over. Figure 3-7 also shows that at some close distance to the left of a point of compression, particle spacingwill be greater than average, and the elastic forces will be in a stretched state. This effect is called rarefaction, andit is characterized by relatively wide particle spacing and, consequently, air pressure that is slightly lower thanatmospheric pressure.The compression wave, along with the rarefaction wave that immediately follows it, will be propagated outwardat the speed of sound. The speed of sound varies depending on the average elasticity and density of the medium inwhich the sound is propagated, but a good working figure for air is about 35,000 centimeters per second, orapproximately 783 miles per hour. Although Figure 3-7 gives a reasonably good idea of how sound propagationworks, it is misleading in two respects. First, the scale is inaccurate to an absurd degree: a single cubic inch of aircontains approximately 400 billion molecules, and not the handful of particles shown in the figure. Consequently,the compression and rarefaction effects are statistical rather than strictly deterministic as shown in Figure 3-7.Second, although Figure 3-7 makes it appear that the air pressure disturbance is propagated in a simple straight linefrom the vibrating object, it actually travels in all directions from the source. This idea is captured somewhat betterin Figure 3-8, which shows sound propagation in two of the three dimensions in which the disturbance will betransmitted. The figure shows rod and piston connected to a wheel spinning at a constant speed. Connected to thepiston is a balloon that expands and contracts as the piston moves in and out of the cylinder. As the balloon expandsthe air particles are compressed; i.e., air pressure is momentarily higher than atmospheric. Conversely, when theballoon contracts the air particles are sucked inward, resulting in rarefaction. The alternating compression andrarefaction waves are propagated outward in all directions form the source. Only two of the three dimensions areshown here; that is, the shape of the pressure disturbance is actually spherical rather than the circular pattern that isshown here. Superimposed on the figure, in the graph labeled “one line of propagation,” is the resulting air pressurewaveform. Note that the pressure waveform takes on a high value during instants of compression and a low valueduring instants of rarefaction. The figure also gives some idea of where the term uniform circular motion comesfrom. If one were to make a graph plotting the height of the connecting rod on the rotating wheel as a function oftime it would trace out a perfect sinusoid; i.e., with exactly the shape of the pressure waveform that is superimposedon the figure.The Sound Pressure WaveformReturning to Figure 3-7 for a moment, imagine that we chose some specific distance from the tuning fork toobserve how the movement and density of air particles varied with time. We would see individual air particlesoscillating small distances back and forth, and if we monitored particle density we would find that high particledensity (high air pressure) would be followed a moment later by relatively even particle spacing (atmosphericpressure), which would be followed by a moment later by wide particle spacing (low air pressure), and so on.Therefore, for an object that is vibrating sinusoidally, a graph showing variations in instantaneous air pressureover time would also be sinusoidal. This is illustrated in Figure 3-9.The vibratory patterns that have been discussed so far have all been sinusoidal. The concept of a sinusoid hasnot been formally defined, but for our purposes it is enough to know that a sinusoid has precisely the smooth shapethat is shown in Figures such as 3-4 and 3-5. While sinusoids, also known as pure tones, have a very special placein acoustic theory, they are rarely encountered in nature. The sound produced by a tuning fork comes quite close to asinusoidal shape, as do the simple tones that are used in hearing tests. Much more common in both speech and musicare more complex, nonsinusoidal patterns, to be discussed below. As will be seen in later chapters, these complexvibratory patterns play a very important role in speech.
The Physics of Sound8Figure 3-8 Illustration of the propagation of a sound wave in two dimensions.The Frequency DomainWe now arrive at what is probably the single most important concept for understanding both hearing and speechacoustics. The graphs that we have used up to this point for representing either vibratory motion or the air pressuredisturbance created by this motion are called time domain representations. These graphs show how instantaneousdisplacement (or instantaneous air pressure) varies over time. Another method for representing either sound orvibration is called a frequency domain representation, also known as a spectrum. There are, in fact, two kinds offrequency domain representations that are used to characterize sound. One is called an amplitude spectrum (alsoknown as a magnitude spectrum or a power spectrum, depending on how the level of the signal is represented)and the other is called a phase spectrum. For reasons that will become clear soon, the amplitude spectrum is by farthe more important of the two. An amplitude spectrum is simply a graph showing what frequencies are present withwhat amplitudes. Frequency is given along the x axis and some measure of amplitude is given on the y axis. A phasespectrum is a graph showing what frequencies are present with what phases.Figure 3-10 shows examples of the amplitude and phase spectra for several sinusoidal signals. The top panelshows a time-domain representation of a sinusoid with a period of 10 ms and, consequently, a frequency of 100 Hz(f 1/t 1/0.01 sec 100 Hz). The peak-to-peak amplitude for this signal is 400 µPa, and the signal has a phase of90o. Since the amplitude spectrum is a graph showing what frequencies are present with what amplitudes, theamplitude spectrum for this signal will show a single line at 100 Hz with a height of 400 µPa. The phase spectrum isa graph showing what frequencies are present with what phases, so the phase spectrum for this signal will show asingle line at 100 Hz with a height of 90o. The second panel in Figure 3-10 shows a 200 Hz sinusoid with a peak-topeak amplitude of 200 µPa and a phase of 180o. Consequently, the amplitude spectrum will show a single line at 200Hz with a height of 100 µPa, while the phase spectrum will show a line at 200 Hz with a height of 180o.Complex Periodic SoundsSinusoids are sometimes referred to as simple periodic signals. The term "periodic" means that there is apattern that repeats itself, and the term "simple" means that there is only one frequency component present. This isconfirmed in the frequency domain representations in Figure 3-10, which all show a single frequency component inboth the amplitude and phase spectra. Complex periodic signals involve the repetition of a nonsinusoidal pattern,and in all cases, complex periodic signals consist of more than a single frequency component. All nonsinusoidalperiodic signals are considered complex periodic.
The Physics of SoundAmplitude SpectrumPhase Spectrum4003601003002700-100Phase200AmplitudeInst. Air PressurePeriod: 10 ms, Freq: 100 Hz, Amp: 400, Phase: 90200100-20000510152025309180900100200 300 400Frequency (Hz)50000100200 300 400Frequency (Hz)5000100200 300 400Frequency (Hz)5000100200 300 400Frequency (Hz)5003601003002700-100Phase400AmplitudeInst. Air PressurePeriod: 5 ms, Freq: 200 Hz, Amp: 200, Phase: 180200200100-2000051015202530180900100200 300 400Frequency (Hz)50003601003002700-100Phase400AmplitudeInst. Air PressurePeriod: 2.5 ms, Freq: 400 Hz, Amp: 200, Phase: 270200200100-200005101520Time (msec)TIME DOMAIN2530180900100200 300 400Frequency (Hz)5000FREQUENCY DOMAINFigure 3-10. Time and frequency domain representations of three sinusoids. The frequency domainconsists of two graphs: an amplitude spectrum and a phase spectrum. An amplitude spectrum is agraph showing what frequencies are present with what amplitudes, and a phase spectrum is a graphshowing the phases of each frequency component.Figure 3-11 shows several examples of complex periodic signals, along with the amplitude spectra for these signals.The time required to complete one cycle of the complex pattern is called the fundamental period. This is preciselythe same concept as the term period that was introduced earlier. The only reason for using the term "fundamentalperiod" instead of the simpler term "period" for complex periodic signals is to differentiate the fundamental period(the time required to complete one cycle of the pattern as a whole) from other periods that may be present in thesignal (e.g., more rapid oscillations that might be observed within each cycle). The symbol for fundamental period isto. Fundamental frequency (fo) is calculated from fundamental period using the same kind of formula that we usedearlier for sinusoids:fo 1/toThe signal in the top panel of Figure 3-11 has a fundamental period of 5 ms, so fo 1/0.005 200 Hz.Examination of the amplitude spectra of the signals in Figure 3-11 confirms that they do, in fact, consist ofmore than a single frequency. In fact, complex periodic signals show a very particular kind of amplitude spectrumcalled a harmonic spectrum. A harmonic spectrum shows energy at the fundamental frequency and at wholenumber multiples of the fundamental frequency. For example, the signal in the top panel of Figure 3-11 has energypresent at 200 Hz, 400 Hz, 600 Hz, 800 Hz, 1,000 Hz, 1200 Hz, and so on. Each frequency component in the
The Physics of Sound120200100100AmplitudeInst. Air Pres. (UPa)t0: 5 ms, f0: 200 Hz0-10005101520256040030t0: 10 ms, f0: 100 Hz0200400600 800 1000 1200 1400 1600Frequency (Hz)0200400600 800 1000 1200 1400 1600Frequency (Hz)0200400600 800 1000 1200 1400 1600Frequency (Hz)120200100100AmplitudeInst. Air Pres. (UPa)8020-2000-10080604020-2000510152025030t0: 2.5 ms, f0: 400 Hz120200100100AmplitudeInst. Air Pres. (UPa)100-10080604020-20005101520Time (msec)TIME DOMAIN25300FREQUENCY DOMAINFigure 3-11. Time and frequency domain representations of three complex periodic signals.Complex periodic signals have harmonic spectra, with energy at the fundamental frequency (f0) andat whole number multiples of f0 (f0. 2, f0. 3, f0. 4, etc.) For example, the signal in the upper left, with afundamental frequency of 200 Hz, shows energy at 200 Hz, 400 Hz, 600 Hz, etc. In the spectra onthe right, amplitude is measured in arbitrary units. The main point being made in this figure is thedistribution of harmonic frequencies at whole number multiples of f0 for complex periodic signals.amplitude spectrum of a complex periodic signal is called a harmonic (also known as a partial). The fundamentalfrequency, in this case 200 Hz, is also called the first harmonic, the 400 Hz component (2 fo) is called the secondharmonic, the 600 Hz component (3 fo) is called the third harmonic, and so on.The second panel in Figure 3-11 shows a complex periodic signal with a fundamental period of 10 ms and,consequently, a fundamental frequency of 100 Hz. The harmonic spectrum that is associated with this signal willtherefore show energy at 100 Hz, 200 Hz, 300 Hz, 400 Hz, 500 Hz, and so on. The bottom panel of Figure 3-11shows a complex periodic signal with a fundamental period of 2.5 ms, a fundamental frequency of 400 Hz, andharmonics at 400, 800, 1200, 1600, and so on. Notice that there two completely interchangeable ways to define theterm fundamental frequency. In the time domain, the fundamental frequency is the number of cycles of the complexpattern that are completed in one second. In the frequency domain, except in the case of certain special signals, thefundamental frequency is the lowest harmonic in the harmonic spectrum. Also, the fundamental frequency definesthe harmonic spacing; that is, when the fundamental frequency is 100 Hz, harmonics will be spaced at 100 Hz
The Physics of Sound11intervals (i.e., 100, 200, 300 .), when the fundamental frequency is 125 Hz, harmonics will be spaced at 125 Hzintervals (i.e., 125, 250, 375.), and when the fundamental frequency is 200 Hz, harmonics will be spaced at 200 Hzintervals (i.e., 200, 400, 600 .). (For some special signals this will not be the case. 2) So, when fo is low, harmonicswill be closely spaced, and when fo is high, harmonics will be widely spaced. This is clearly seen in Figure 3-11: thesignal with the lowest f0 (100 Hz, the middle signal) shows the narrowest harmonic spacing, while the signal withthe highest f0 (400 Hz, the bottom signal) shows the widest harmonic spacing.10080100AmplitudeInst. Air Pres. (UPa)White 50/f/10020080100AmplitudeInst. Air Pres. (UPa)0100AmplitudeInst. Air Pres. (UPa)05006040-10020-2000102030TIME (msec)TIME DOMAIN40500456Frequency (kHz)FREQUENCY DOMAINFigure 3-12. Time and frequency domain representations of three non-transient complex aperiodicsignals. Unlike complex periodic signals, complex aperiodic signals show energy that is spreadacross the spectrum. This type of spectrum is called dense or continuous. These spectra have a verydifferent appearance from th
The Physics of Sound 1. The Physics of Sound . Sound lies at the very center of speech communication. A sound wave is both the end product of the speech production mechanism and the primary source of raw materi