Transcription
Freescale SemiconductorApplication NoteDocument Number:AN4327Rev. 2, 11/2012Pulse Oximeter Fundamentals andDesignby:Santiago LopezContents1 Introduction1Introduction.1This application note demonstrates implementation of a basicpulse oximeter using Freescale products. The pulse oximeter isimplemented using the Freescale medical-oriented,microcontroller Kinetis K53. This MCU embeds a 32-bitARM Cortex -M4 processor, Ethernet, USB connectivity,and an analog measurement engine, ideal for medicalapplications.2Pulse oximetry fundamentals.13Pulse oximeter implementation.54Software model.135Running MED-SPO2 demo.226References.307Conclusions.30ASoftware timer.30BCommunication protocol.32This document is intended to be used by biomedical engineers,medical equipment developers, or any person related to themedical practice and interested in understanding the operationof a pulse oximeter.2 Pulse oximetryfundamentalsThis section contains information on the pulse oximeterfunction principle and basic physiology information aboutblood oxygenation. 2011 Freescale Semiconductor, Inc.
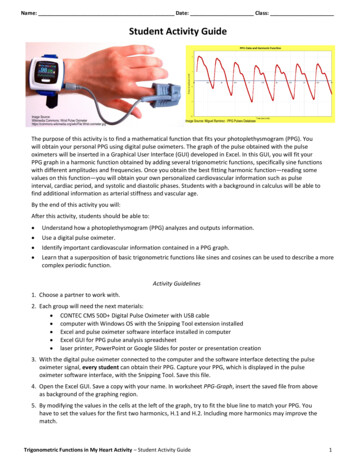
Pulse oximetry fundamentals2.1 Blood oxygenationBody cells need oxygen to perform aerobic respiration. Respiration is one of the key ways a cell gains useful energy. Theenergy released in respiration is used to synthesize the adenosine triphosphate (ATP) to be stored. The energy stored in ATPcan then be used to drive processes requiring energy, including biosynthesis, locomotion, or transportation of moleculesacross cell membranes.Oxygen transportation is performed through the circulatory system. Deoxygenated blood enters the heart where it is pumpedto the lungs to be oxygenated. In the oxygenation process, blood passes through the pulmonary alveoli where gas exchange(diffusion) occurs (Figure 1). Carbon dioxide (CO2) is released and the blood is oxygenated, afterwards the blood is pumpedback to the aorta.Figure 1. Pulmonary alveoliBlood red cells contain a protein called hemoglobin. When oxygen reacts with this protein, it gets attached to it and generatesOxyhemoglobin (HbO2). Red cells with oxygenated hemoglobin circulate in the blood through the whole body, irrigatingtissues. When blood gets in contact with a cell, the red cell's hemoglobin releases oxygen and becomes Deoxyhemoglobin(Hb) (deoxygenated hemoglobin). At this point, blood without oxygen returns to the heart’s right atrium to repeat the process.The diagram below demonstrates the whole process (Figure 2).Pulse Oximeter Fundamentals and Design, Rev. 2, 11/20122Freescale Semiconductor, Inc.
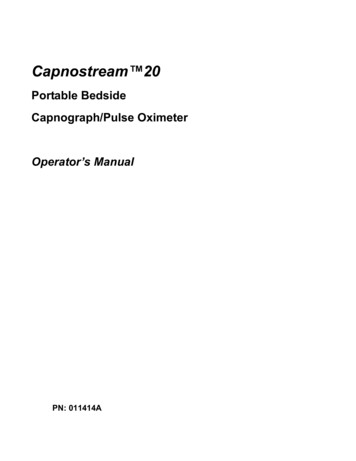
Pulse oximetry fundamentalsFigure 2. Blood circulation diagram2.2 Pulse oximetryPulse oximetry is the non-invasive measurement of the oxygen saturation (SpO2). Oxygen saturation is defined as themeasurement of the amount of oxygen dissolved in blood, based on the detection of Hemoglobin and Deoxyhemoglobin.Two different light wavelengths are used to measure the actual difference in the absorption spectra of HbO2 and Hb. Thebloodstream is affected by the concentration of HbO2 and Hb, and their absorption coefficients are measured using twowavelengths 660 nm (red light spectra) and 940 nm (infrared light spectra). Deoxygenated and oxygenated hemoglobinabsorb different wavelengths. Deoxygenated hemoglobin (Hb) has a higher absorption at 660 nm and oxygenatedhemoglobin (HbO2) has a higher absorption at 940 nm (Figure 3).Pulse Oximeter Fundamentals and Design, Rev. 2, 11/2012Freescale Semiconductor, Inc.3
Pulse oximetry fundamentalsFigure 3. Hemoglobin light absorption graphA photodetector in the sensor perceives the non-absorbed light from the LEDs. This signal is inverted using an invertingoperational amplifier (OpAmp) and the result is a signal like the one in Figure 4. This signal represents the light that has beenabsorbed by the finger and is divided in a DC component and an AC component. The DC component represents the lightabsorption of the tissue, venous blood, and non-pulsatile arterial blood. The AC component represents the pulsatile arterialblood.Figure 4. Light absorption diagramThe pulse oximeter analyzes the light absorption of two wavelengths from the pulsatile-added volume of oxygenated arterialblood (AC/DC) and calculates the absorption ratio using the following equation.Equation 1:Pulse Oximeter Fundamentals and Design, Rev. 2, 11/20124Freescale Semiconductor, Inc.
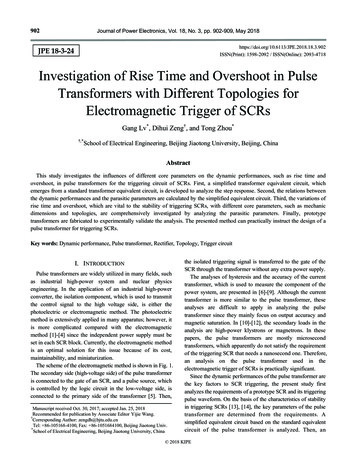
Pulse oximeter implementationSpO2 is taken out from a table stored on the memory calculated with empirical formulas. A ratio of 1 represents a SpO2 of 85%, a ratio of 0.4 represents SpO2 of 100 %, and a ratio of 3.4 represents SpO2 of 0 %. For more reliability, the table must bebased on experimental measurements of healthy patients.Another way for calculating SpO2 is taking the AC component of only the signal and determinate ratio by using followingequation. SpO2 is the value of RX100.Equation 2:Iac Light intensity at 1 (660 nm) or 2 (940 nm), where only the AC level is present.A typical pulse oximetry signal is represented in Figure 5. The signal represents the pulsatile arterial blood absorption. Thebeats per minute can be calculated using this signal.Figure 5. Typical pulse oximetry signal3 Pulse oximeter implementationThe pulse oximeter is implemented using the Freescale MCU Kinetis K53 which embeds the following key features for thepulse oximetry signal treatment, among other medical oriented applications: 32-bit ARM Cortex -M4 core up to 100 MHz, bus speed up to 50 MHzDSP instructions for signal filteringTwo Operational Amplifiers (OpAmp)Two Transimpedance Amplifiers (TRIAMP)USB connectivity as host, device or On-The-Go (OTG)Up to four pairs of differential and 24 single-ended 16-bit ADC channels3 x 16-bit Flex Timer Modules (FTM) with PWM capabilityThe Kinetis K53 integrates most of the peripherals needed for pulse oximeter implementation, although some externalcomponents are required. These components are integrated in an external Analog Front End, described below.Pulse Oximeter Fundamentals and Design, Rev. 2, 11/2012Freescale Semiconductor, Inc.5
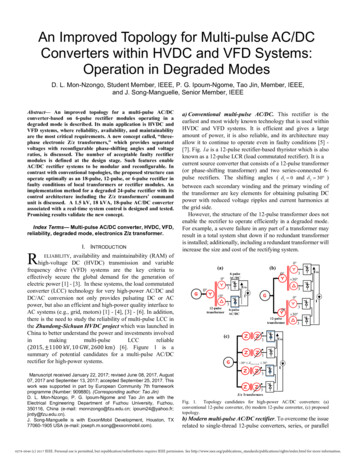
Pulse oximeter implementation3.1 MED-SPO2 analog front endFreescale Analog Front Ends (AFEs) provide fast prototyping capabilities enabling medical equipment developers to reducetime to market. MED-SPO2 AFE includes all the necessary external components (except sensor) to implement a pulseoximeter together with the Kinetis K53 MCU. The AFE functional block diagram is shown and described below (Figure 6).Figure 6. MED-SPO2 functional block diagram3.1.1 Medical connectorThe medical connector is a standard connector in Freescale medical-oriented boards (TWR-9S08MM, TWR-MCF51MM andTWR-K53). This connector includes the most important analog peripherals for medical applications and an I2C channel forcommunication. The following table describes medical connector signals.Table 1. Medical connector signals1VCC (3.3V)VSS (GND)23I2C SDAI2C SCL / PWM45ADC Differential CH ADC Differential CH -67ADC Single Ended CHDAC Out89Op-Amp 1 OutOp-Amp 2 Out1011Op-Amp 1 Input -Op-Amp 2 Input -12Table continues on the next page.Pulse Oximeter Fundamentals and Design, Rev. 2, 11/20126Freescale Semiconductor, Inc.
Pulse oximeter implementationTable 1. Medical connector signals (continued)13Op-Amp 1 Input Op-Amp 2 Input 1415TRIAMP 1 Input TRIAMP 2 Input 1617TRIAMP 1 Input -TRIAMP 2 Input -1819TRIAMP 1 OutTRIAMP 2 Out203.1.2 Multiplexer circuit and LED driver circuitThe pulse oximeter needs two different wavelengths to perform measurements. These wavelengths are generated using twoLight Emitter Diodes (LEDs), a Red LED (660 nm,) and an Infra Red LED (940 nm). Samples cannot be taken at the sametime because there is only one photodetector for two signals, therefore signals must be multiplexed. MED-SPO2 includes aGPIO-controlled analog multiplexer that allows selecting the wavelength to be sampled.LED intensity is controlled using a PWM signal. However, MCU PWM pins do not provide enough strength to drive LEDsin a proper manner. A LED driver circuit provides the LED with sufficient energy to work. Figure 7 shows a basic LEDdriving circuit.Figure 7. LED drive circuit3.1.3 Pulse oximeter sensorThe MED-SPO2 was designed for working with Nelcor-DS100 series sensors or any other that are compatible. The sensor isconnected to the board through a simple DB9 connector, similar to the one used in the RS232 communications standard. Thefollowing image (Figure 8) shows connections with the sensor using a DB9 connector.Pulse Oximeter Fundamentals and Design, Rev. 2, 11/2012Freescale Semiconductor, Inc.7
Pulse oximeter implementationFigure 8. DB9 Board connections to sensorThe pulse oximeter sensor already contains both LEDs, Red, IRed, and the photodetector needed for light absorptiondetection.3.1.4 Current to voltage converterThe output generated by the photodetector is a current that represents the light absorption. This current needs to be convertedinto a voltage in order to be properly filtered and treated. Conversion is performed using a current to voltage converter whichconsists in a single supply, low input offset voltage, low input offset and bias current TRIAMP embedded on K53 togetherwith a feedback resistance and a capacitor for filtering purposes. Figure 9 shows the implemented circuit.Pulse Oximeter Fundamentals and Design, Rev. 2, 11/20128Freescale Semiconductor, Inc.
Pulse oximeter implementationFigure 9. Current to voltage converterThis circuit combines a current to voltage converter and a low-pass filter to improve the signal treatment. The output voltageand cut frequency are given by the following formulas:Equation 3:Equation 4:A 125 Hz low-pass filter is to remove high frequency noise from the received signal.3.1.5 Filtered and amplificationThis block is divided in five filters, four of them are passive filters and one of them is an active filter. Both 660 nm and 940nm signals are processed using these filters for noise elimination and amplification. Figure 10 shows the filter circuit.Pulse Oximeter Fundamentals and Design, Rev. 2, 11/2012Freescale Semiconductor, Inc.9
Pulse oximeter implementationFigure 10. Filter circuitThe first filter is a low-pass filter with a cutoff frequency of 6 Hz designed to eliminate high frequency noise. The followingequation obtains the filter cut frequency:Equation 5:The second filter is a 60 Hz notch filter. The purpose of this filter is to eliminate the 60 Hz line interference. Figure 11represents the connections for a notch filter.Figure 11. Notch filterThe notch filter is referenced to VCC/2 to add an offset voltage. The notch filter cutoff frequency and design parameters arerepresented by the following equations.Equation 6:Equation 7:Equation 8:Pulse Oximeter Fundamentals and Design, Rev. 2, 11/201210Freescale Semiconductor, Inc.
Pulse oximeter implementationThe third filter is a 0.8 Hz high pass filter. The cutoff frequency of this filter is calculated using Equation 5. This filterremoves the DC component of the signal.The fourth filter is a first order active 6 Hz low-pass filter that also provides a gain of 31. Figure 12 shows an active low passfilter.Figure 12. Active low-pass filterThis filter uses a K53 internal OpAmp to be developed. Vref on positive input allows using an inverter amplifier. Thefollowing equations determine the filter cutoff frequency and gain.Equation 9:Equation 10:The last one is a 4.8 Hz low pass filter similar to the first one (Equation 5), and the equation that represents this filter is thesame that represents the first one.3.1.6 Vref generatorBecause a negative voltage source implies extra costs and components, analog signals are handled in a positive voltage range.Nevertheless some analog signals like some biopotentials have negative voltages that need to be considered. This is solvedmounting the AC signal on a positive DC level, typically VCC/ 2. Vref generator produces this signal using a simple voltagedivisor and a K53 embedded OpAmp. Figure 13 shows a Vref generator circuit.Pulse Oximeter Fundamentals and Design, Rev. 2, 11/2012Freescale Semiconductor, Inc.11
Pulse oximeter implementationFigure 13. Vref generator circuit3.2 Functional descriptionThe measurement starts when the MCU generates a PWM signal that varies the LED intensity. Because every person has adifferent finger size and skin color, the LED needs to be calibrated to acquire an accurate signal. LED calibration isperformed by taking the LED filtered baseline (see Figure 10) and using an algorithm described in the Software model whichchanges the PWM duty cycle value to adjust the LED intensity for every kind of user.The LED driver circuit helps to drive LEDs so that power is not provided directly by the MCU. Using transistors, the LEDsare powered directly by the VCC line and controlled by the MCU. The switch control pin on the MCU selects which LED isturned on at that time. Light from Red and IRed LEDs on the sensor travels through the finger and the non-absorbed light isreceived in the photodetector (Figure 14).Pulse Oximeter Fundamentals and Design, Rev. 2, 11/201212Freescale Semiconductor, Inc.
Software modelFigure 14. Pulse oximeter sensorThe signal passes through a current to the voltage converter (Figure 9) where it is filtered, amplified, and converted into avoltage. The signal is now multiplexed to its respective filter and amplification stage, depending on whether it is Red or IRedLED. At this stage, the signal is treated and most of the noise is removed. The signal is also amplified in order to be detectedeasily by the MCU ADC. The filtered signal is then sent to an ADC channel on the MCU.One sample of the Red filtered signal, Red baseline, IRed filtered signal, and IRed baseline are taken every 1 ms. Samples arecaptured using the embedded 16-bit ADCs and filtered using a 0.5 Hz to 150 Hz FIR (Finite Impulse Response) softwarefilter on the Kinetis K53 MCU for high frequency and DC component removal, taking advantage of the MAC (Multiply andAccumulate) DSP instruction. Samples are stored on a software buffer and averaged. A peak detection algorithm is used todeterminate the AC component of the signal that is generated by the pulsatile arterial blood absorption. This is the part of thesignal which is used for SpO2 and beats per minute (bpm) calculation. The samples taken and the calculated data (SpO2 andbpm) are sent to a GUI on a computer. More information about the software process can be found in Software model.4 Software modelThe pulse oximeter demo is based on the Freescale USB stack and behaves as a USB CDC (Communication Device Class).The demo works using state machines that execute one state per cycle avoiding CPU kidnapping and emulating parallelism.Figure 15 shows the general software model.Pulse Oximeter Fundamentals and Design, Rev. 2, 11/2012Freescale Semiconductor, Inc.13
Software modelFigure 15. General software modelEvery state machine is a task that has to be performed by the MCU. The system can perform several tasks completing one attime and running the next one until the first one is accomplished in a FIFO (First In First Out) organization. Some statemachines contain sub-state machines allowing the MCU to distribute the CPU load equally. As mentioned before, software isbased on the Freescale USB Stack with PHDC. More information about this software can be found in USBAPIRM: FreescaleUSB Stack with PHDC Device API Reference Manual, available at freescale.com.MED-SPO2 software is basically divided in three main parts: Initialization Communication with PC Measurement Execution4.1 InitializationThe file main kinetis.c contains the microcontroller initialization routines and calls the main application routine. The mainapplication routine (Figure 15) contains all the other state machines and calls them in a FIFO order. Initialization is integratedby several functions described below. The most relevant ones are Init Sys which initializes all the peripherals required by theMCU for USB initialization and TestApp Init which initializes functions required by the application itself.Pulse Oximeter Fundamentals and Design, Rev. 2, 11/201214Freescale Semiconductor, Inc.
Software model4.1.1 Init Sys()Init Sys() initializes the basic functions of the microcontroller, like clock initialization. First, this function copies the vectortable to RAM and clears any pending interrupts on USB and then, it enables interrupts from the USB module.At this point, pll init() is called. This function configures the microcontroller for running in PLL mode at 96 MHz of the corespeed with a 50 MHz clock generating a system bus frequency of 48 MHz. This is important because the USB module needs48 MHz to run properly. More information about changing among clock modes can be found in K53P144M100SF2RM: K53Sub-Family Reference Manual for 100 MHz devices in 144 pin packages, availabe on freescale.com.After PLL initialization, the MPU CESR is cleared and clock gating for USB is configured to get 48 MHz from the systembus.4.1.2 TestApp Init();The TestApp Init()—Contains all the initializations needed by the MED-SPO2 application and for USB configuration as aCDC device. This function is contained in the file Main App.c and is called only once at the beginning of the program.GPIOS CLOCK INIT—Is a macro that enables all the GPIO clocks for future use. Kinetis disables all its peripheral clocksto save power, and the peripherals must be activated enabling its respective bit on the respective SIM SCGCx register.vfnEnable AFE()—Initializes GPIO settings for the pin used as an AFE enabler which polarizes a field effect transistor(FET) which is used as a switch for power on and off in the AFE on the medical connector.SwTimer Init()—Initializes the software timer. The software timer is a function that allows executing a function when aprogrammed period of time has elapsed. More information about these routines can be found in Software timer.After SwTimer Init is executed, the Kinetis K53 USB module is initialized as a CDC device calling the functionUSB Class CDC Init. At this point, USB is now functional and can be recognized by a PC. Information aboutUSB Class CDC Init and other USB Stack related questions can be found in USBAPIRM: Freescale USB Stack withPHDC Device API Reference Manual, available at freescale.com.4.2 Communication with PCAfter the MCU has been initialized, TestApp Task is executed in an infinite loop. This function contains the main statemachine and executes the communication and measurements state machines (Figure 16).Pulse Oximeter Fundamentals and Design, Rev. 2, 11/2012Freescale Semiconductor, Inc.15
Software modelFigure 16. TestApp Task diagramSpO2 PeriodicTask executes all the sub-states related to the pulse oximetry measurement. This function is later explained indetail in the following sections. SWTimer PeriodicTask checks if the programmed times for running programs has elapsed.For more information about this routine, see Software timer.4.2.1 SerialComm PeriodicTaskThis function checks if there is new data from the PC. When data exists in the USB buffer this function analyzes it andexecutes a routine when it is a valid command. Figure 17 represents the SerialComm PeriodicTask function.Pulse Oximeter Fundamentals and Design, Rev. 2, 11/201216Freescale Semiconductor, Inc.
Software modelFigure 17. SerialComm PeriodicTask flow diagramCommunication routines are based on the Freescale USB with PHDC USB Stack Communication Device Class functions.The SerialComm PeriodicTask function is constantly checking the g recv size flag. When this flag has a value other than 0,this means that there is some data received from a computer on the USB buffer. This information is copied to the mainapplication InBuffer and the received data quantity is copied to InSize. After that, g recv size is set to 0 indicating that datahas been read.When InSize has a value other than 0, it is understood that data has been received, and it is checked to be compatible with thecommunication protocol data frame (Figure 18).Pulse Oximeter Fundamentals and Design, Rev. 2, 11/2012Freescale Semiconductor, Inc.17
Software modelFigure 18. Protocol data frameThe first data byte checked is the Packet Type, this byte defines the kind of packet that has been received. The applicationonly recognizes Request (REQ) packets. Confirmation Packets (CFM) and Indication Packets (IND) are recognized only bythe PC GUI. For more information, see Communication protocol.If the first byte received is a Request command, the second byte is checked to determine which command wants the PC to beexecuted. There are several kinds of Command Opcodes.MED-SPO2 responds to only four: SpO2StartMeasurementReq SpO2AbortMeasurementReq SpO2DiagnosticModeStartMeasurementReq SpO2DiagnosticModeStopMeasurementReqOne of these commands is specified on the Command Opcode byte. The selected function is executed using the pointer tofunction ExecuteCommandReq[InBuffer[COMMAND OPCODE]].4.2.2 SpO2StartMeasurementReq andSpO2DiagnosticModeStartMeasurementReqThese functions are very similar; both of them send a confirmation packet and start pulse oximetry measurements. The onlydifference is that SpO2StartMeasurementReq initializes MED-SPO2 for a single measurement andSpO2DiagnosticModeStartMeasurementReq initializes MED-SPO2 for a continuous measurement. More details about thiscan be found in Measurement execution.At the beginning, the function vfnStartSpO2MeasurementEngine initializes the OPAMPs and TRIAMPs for working ingeneral-purpose mode.SpO2 Init is called into the subroutine and initializes all the timers needed by the application. FTM1 is needed by themeasurement routine to control the ON/OFF times of the sensor LEDs. FTM2 is needed for PWM generation.SpO2 INIT SWITCH CONTROL PIN is also called to initialize the GPIO pin for multiplexing control.After vfnStartSpO2MeasurementEngine is executed, the measurement start request function generates a confirmation packetindicating to the PC that a command has been received. Depending on the measurement start request function called, therespective start measurement function is called. In this example, because SpO2DiagnosticModeStartMeasurementReq hasbeen called, the function calls SpO2 DiagnosticModeStartMeasurements as the start measurement function. This functionreturns TRUE or FALSE depending if the initialization was completed successfully or not. Depending on this, the functioncompletes the confirmation packet with the last byte indicating if the request was executed correctly or not. The packet isthen sent using the function SerialComm SendData.This function checks OutSize to be greater than zero. If this condition is true, it is assumed that there is information in theOutBuffer. This information is copied to the USB send buffer called g curr send buf. Information in this buffer is sent to thePC and the OutSize variable is cleared.Pulse Oximeter Fundamentals and Design, Rev. 2, 11/201218Freescale Semiconductor, Inc.
Software model4.2.3 SpO2AbortMeasurementReq andSpO2DiagnosticModeStopMeasurementReqWhen a stop or abort measurement is requested by the PC (depending on the Command Opcode), one of these functions isexecuted.Confirmation packets for stop/abort measurement requests do not require the last byte containing error information. It isalways assumed that a stop/abort request has been executed when the confirmation packet is received. The function firstsends a confirmation packet indicating to the PC that the request command has been received. After that, a commanddepending on the stop/abort request called, is executed. In this example because SpO2DiagnosticModeStopMeasurementReqhas been called, the function SpO2 DiagnosticModeStopMeasurement is executed. After the measurements have stopped, theconfirmation packet is sent using the function SerialComm SendData. The function vfnTurnOffMeasurementEngine is nowcalled; this function disables all the OPAMPs and TRIAMPs.4.3 Measurement executionThere are three basic parts on measurement execution: Measurements Start Measurements Execution Measurements Stop4.3.1 Measurements startWhen a host has sent a SpO2 Start Measurements request to the appropriate function, according to the Command Opcodereceived, it is executed. Each of these functions calls a start measurement routine.SpO2 DiagnosticModeStartMeasurement first checks if the SpO2 state machine is in an idle state, otherwise it means that thestate machine has been previously initialized. If it is in an idle state, the function initializes ADCs needed for both, the mainsignal and baseline measurements. Then, depending on the function called, SpO2IsDiagnosticMode is set to true or false. IfSpO2IsDiagnosticMode is true, the device will send continuous SPO2 measurements and graph data. If it is false, the devicewill take 10 samples and if those samples are valid the device averages those samples and sends a single SpO2 measurement.The SpO2 state machine’s actual state is set to SPO2 STATE MEASURING to indicate to the device that pulse oximetrymeasurements are being performed. The ResetVariables() function resets all the SPO2 variables to its original state and clearsall the buffers. The SwTimer StartTimer(TimerSendGraphData, SPO2 UPDATE GRAPH PERIOD) starts a software timerfor a graph update. More information about this routine see Software timer.4.3.2 Measurements executionWhen a measurement start function has been called, the SPO2 state machine is set to SPO2 STATE MEASURINGindicating to the device that measurements are going to be performed. The SPO2 state machine calls the StateMeasuringfunction which is a sub-state machine containing the necessary steps to perform measurements. Figure 19 shows the SubState Machine flow diagram.Pulse Oximeter Fundamentals and Design, Rev. 2, 11/2012Freescale Semiconductor, Inc.19
Software modelFigure 19. StateMeasuring flow diagramStateMeasuring is a sub-state machine, this means that sub-states are called one by one every time the StateMeasuringfunction is called.To take a sample, follow the steps below:1. Turn on Infra Red (IR) LED2. Wait signal to stabilize3. Read IR signal and baseline4. Turn off IR LED5. Wait signal to stabilize6. Turn on Red LED7. Wait signal to stabilize8. Read Red signal and baseline9. Turn off Red LEDThe first step is to turn on the IR LED. The function SPO2 SET SWITCH CONTROL changes the value of the pin thatcontrols the board multiplexor and controls which signal is going to be read. The Pwm Start(PwmValue) starts generatingthe PWM signal which turns on the selected LED and controls light intensity by changing the PWM duty cycle. ThePwmValue determinates the duty cycle and therefore LED intensity. This value is modified in the LED calibration routine toadjust the LED intensity for working with different skin colors and finger widths.Pulse Oximeter Fundamentals and Design, Rev. 2, 11/201220Freescale Semiconductor, Inc.
Software modelThe START TIMER us function starts the microseconds counter which is constantly being checked to determine when thepredefined wait time has elapsed. This is performed to generate the signal stabilization times. Then the next sub-state iscalled.When the wait time has elapsed, the time counter is set to 0 to generate a new wait time for the Red LED. The SpO2 signaland baseline are read from their respective ADC channels. The SPO2 FIR is a macro that determines if a FIR (Finite ImpulseResponse) filter is used or not. When defined, the samples taken are filtered using the functions in Kinetis FIR.c which usesthe MCU embedded DSP instructions to perform the filter function. Samples are then averaged and stored into a buffer usingthe function MovingAverage PushNewValue16b to make calculations. This process is executed again, but this time takingsamples from the Red LED signal.After the samples have been taken, calculations are performed and LEDs are recalibrated. Case 4 on the state measuringfunction performs these actions.If Diagnostic Mode was initialized when the IsTimeToUpdateGraphData flag onTimerSendGraphData function is set, the data on the IR signal buffer is stored using the function SaveGraphData sent later tothe PC, then the TimerSendGraphData starts again.The LED intensity is recalibrated when TimeToRecalibrate is equal to zero, on the calibration routine the baseline signalaverage results are compared with baseline thresholds to determine if calibration is needed. If it is necessary to recalibrate,the respective Calibrate function is called.For example, if IR baseline signal is out of limits, the CalibrateIRLedIntensity function is called. This function compares thebaseline signal against several threshold values and changes the LED PWM duty cycle until the baseline signal is in thelimits.After calibration has been checked, function FindMaxAndMin is called. This function determines the maximum (Max) andminimum (Min) peaks of the signal in a window interval, that is, the function determines the biggest and the smallest samplein a determined period of time. Once the Max peak and Min peak have been determined, the DoCalculations function iscalled.The DoCalculations function calculates the SpO2 percentage and the heart rate. The function first determines the peak to peakvoltage subtracting the Min peak to the Max peak to remove the DC component of the signal. The Vrms voltage is thencalculated by using the formula:SpO2 percentage is calculated in relation with the current re
1 VCC (3.3V) VSS (GND) 2 3 I2C SDA I2C SCL / PWM 4 5 ADC Differential CH ADC Differential CH - 6 7 ADC Single Ended CH DAC Out 8 9 Op-Amp 1 Out Op-Amp 2 Out 10 11 Op-Amp 1 Input - Op-Amp 2 Input - 12 Table continues on the next page. Pulse oximeter implementation Pulse Oximeter Fundamentals and Design, Rev. 2, 11/2012 6 Freescale .