Transcription
White PaperEQ PET: Achieving NEMAreferenced SUV AcrossTechnologiesMatthew Kelly, PhD, Siemens Healthcare SectorAnswers for life.
Table of ContentsIntroduction1Case Study 1 – Cross-Scanner Response Assessment2Clinical ExampleCase Study 2 – Multi-Center Clinical TrialsClinical ExampleCase Study 3 – Inter-Site SUV Thresholds2446Conclusions6Appendix A: EQ PET Parameter Determination7Test Protocol7Target Protocol7Recovery Coefficient Measurement7EQ PET Parameter Optimization8Appendix B: Computing EQ PET Parameters in syngo.via9Example Dataset9EQ PET Parameter Optimization9Appendix C: Gaussian Smoothing MethodologyKernel Construction1111About the Author12References12
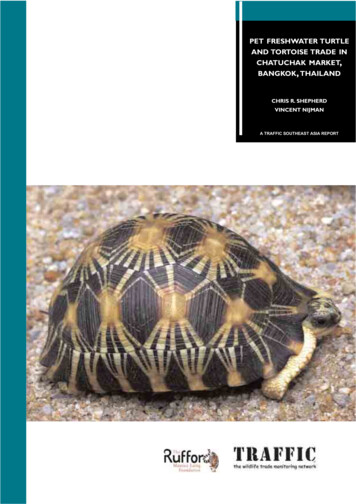
IntroductionPET is a valuable tool for helping diagnose, stage and monitorcancer, as well as enabling clinicians to quantify active disease andmeasure response to therapy. Accurate quantification aids clinicians in benchmarking disease and identifying effective therapiesearlier in the treatment cycle, thus improving the efficiency andefficacy of patient care.The Standardized Uptake Value (SUV) is the most widely-usedmetric for quantifying radiotracer uptake in tumors, providingnormalization for differences in patient size, body compositionand injected dose; however, differences in scanner hardware andreconstruction protocol can introduce clinically significant variationin PET quantification that are not addressed by SUV alone1.EQ PET is a new reference-based quantification technology withinsyngo .via that provides clinicians with harmonized SUVs acrosspatient scans, even if acquired on different scanners or reconstructed with different protocols2.EQ PET achieves this without requiring the clinical site to modifytheir reconstruction protocol or reconstruct additional datasets.With EQ PET, the clinician reads from the original patient image,reconstructed with their preferred protocol to maximize imagequality and detectability. SUV is harmonized using an EQ PETparameter selected to align contrast recovery between scannersand reconstructions (Figure 1), relative to a reference such as theEANM specification3.This white paper presents three clinical use cases for SUVharmonization along with an approach for determining the EQ PETparameter for the scanner model and reconstruction protocol. Theclinical use cases presented are: C ross-scanner response assessment for patients imagedwith different PET/CT systems; Multi-center clinical trials that require strict alignment ofacquisition protocol and quantitative performance of scanners; Inter-site SUV thresholds to facilitate the exchange andadoption of SUV-based protocols between clinical sitesFigure 1. EQ PET harmonizes SUVs across different scanners and reconstructions by applying a phantom-derived reference-based EQ PET parameteroptimized to align contrast recovery coefficients.1
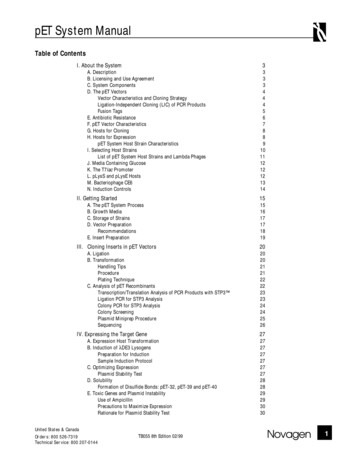
Case Study 1 – Cross-Scanner Response AssessmentChallenge: Assess treatment response inpatients quantitatively, even if imaged ondifferent PET/CT systems.PET/CT imaging is used clinically to assess a cancer patient’sresponse to treatment. While dramatic disease progression or treatment response can often be reliably determined from a qualitativereview of the images, more subtle changes require quantitativeassessment4. Furthermore, quantitative assessment enables objective evaluation of change, with standardized response criteria suchas PERCIST4, improving inter-reader agreement.Quantitative response assessment is typically performed usingSUV, which normalizes for differences in dose injected and patientweight to facilitate inter-scan comparison. Despite this normalization, differences in scanner model and reconstruction can still havea clinically significant impact on SUV1.This improved comparability across reconstructions with EQ PET isalso seen with SUVpeak (Table 2). While the PERCIST-based responseclassification is not affected in this example, a difference in SUVpeakof 24% versus -3% has the potential to impact a clinician’s assessment of treatment effect.A prospective evaluation of the impact of applying a phantomderived parameter to align quantification found that it allowed fora reliable pre- and post-therapy evaluation when using differentgeneration PET systems1.Change in SUVmax (%)Pre-RT scanPost-RT scanIterativeHD PETHD PET.eqIterative 10% (SMD) 92% (PMD) 9% (SMD)HD PET-28% (PMR) 25% (PMD)n/aHD PET.eq 4% (SMD)n/a 4% (SMD)Table 1. Percentage change in SUVmax between pre- and post-RT scans forEQ PET quantification, in combination with a standardizedimaging protocol, allows a physician to assess treatment responsein patients quantitatively, even if the patient’s scans were acquiredon different systems or reconstructed differently.Clinical Exampledifferent reconstruction protocols. EORTC response classification is denotedby (PMD) progressive metabolic disease, (SMD) stable metabolic diseaseand (PMR) partial metabolic response.n/a not applicableEQ PET is mitigating the impact of the reconstructionprotocol which could impact patient management.The following lung cancer patient (Figure 2) received 2 cyclesof chemotherapy, including granulocyte stimulating factors, priorto radiotherapy. The first PET/CT scan was performed prior to radiotherapy with the second 8 weeks later.The pre-RT scan was reconstructed using Iterative (OSEM) with 4iterations, 8 subsets and a 5 mm FWHM Gaussian post filter. Thepost-RT scan was reconstructed using HD PET (PSF) with 3 iterations, 21 subsets and no post filter (Figure 2).Change in SUVpeak (%)Pre-RT scanPost-RT scanIterativeHD PETHD PET.eqIterative-3% (SMD) 24% (SMD) 1% (SMD)HD PET-23% (SMD)-2% (SMD)n/aHD PET.eq-7% (SMD)n/a-3% (SMD)Table 2. Percentage change in SUVpeak between pre- and post-RT scansUsing the EORTC criteria5, the change in SUVmax between thetwo scans (3.74 to 7.17; 92%) indicates disease progression(Table 1). However, due to the difference in reconstruction, aconfident assessment cannot be made. In fact, in an additionalreconstruction of the post-RT scan with the pre-RT protocol, theSUVmax measured for the lesion is 4.13 ( 10%), indicating stabledisease according to the EORTC criteria.Using the appropriate EQ PET parameter to align the HD PETreconstruction with Iterative (7.0 mm FWHM), the SUVmax.eqmeasured for the same lesion on the post-RT HD PET scan is 4.06( 9%). EQ PET, therefore, enables quantitatively comparableresponse assessment, despite the use of a more advanced reconstruction protocol with improved image quality in the post-RT scan.2for different reconstruction protocols. PERCIST response classification isdenoted by PMD, SMD and PMR.n/a not applicableEQ PET is mitigating the impact of the reconstructionprotocol which could impact patient management.
PRE-RT (Iterative)Figure 2. Pre- and post-RT PET/CT scans for lung cancer patient.A single lesion in the right lungis identified and the quantitativeassessment is dependent on thereconstruction method used. Thisdependency is minimized withEQ PET.Data courtesy of François BaclesseCancer Centre, Caen, France.POST-RT (HD PET)3
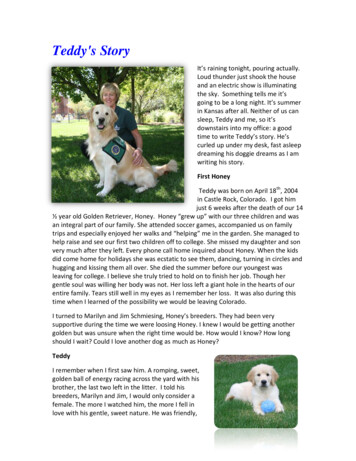
Case Study 2 – Multi-Center Clinical TrialsChallenge: Participate in multi-center clinicaltrials, without needing to modify establishedreconstruction protocols.Multi-center clinical trials facilitate the recruitment of a largernumber of subjects in a shorter time period. Medical imagingtechniques, including PET/CT, are frequently used in clinical trialsfor patient stratification or as surrogate endpoints.The need for quantitative comparability in clinical trialimaging typically requires a form of site accreditation priorto participation, such as that provided by the Society ofNuclear Medicine and Molecular Imaging’s Clinical TrialsNetwork (CTN) or EANM Research Limited (EARL). As partof this accreditation, each site must conform to a commonlyachievable standard for quantification.In each reconstruction, the SUVmax was measured for a smalllesion in the left lung. When compared with the basic Iterativereconstruction, both HD PET and ultraHD PET produce a clinicallysignificant increase in SUVmax5 (Table 3). However, by applying theEQ PET parameters necessary to align with the EANM specification2, this variability is reduced to within the reported test-retestvariability for 18F-FDG uptake in tumors6.SUVmaxSUVmax.eqEQ PETparameterIterative4.043.803.3 mmHD PET6.37 ( 58%)3.45 (-9%)6.5 mmUltraHD PET7.51 ( 86%)3.21 (-16%)7.1 mmTable 3. Effect of reconstruction on SUVmax and SUVmax.eq for the lunglesion shown in Figure 3. Percentage change relative to Iterative is shownin parentheses. EQ PET parameters FWHMs required to align with theTypically, this will require the modification of a site’s reconstructionprotocol to conform with the trial protocol (usually leading to aloss of resolution) or, if this is undesirable, the reconstruction ofan additional PET dataset for quantification.EQ PET, in combination with a standardized imaging protocol,allows a site to adhere to the quantitative requirements for amulti-center clinical trial without having to reduce image qualityor reconstruct and manage a second dataset.Clinical ExampleTo demonstrate the quantitative impact of reconstruction, a lungcancer patient scan (Figure 3) has been reconstructed with threedifferent protocols: I terative (OSEM) with 2 iterations, 24 subsets and a 5 mmFWHM Gaussian post filter HD PET (PSF) with 3 iterations, 24 subsets and a 4 mmFWHM Gaussian post filter ultraHD PET (PSF TOF) with 3 iterations, 21 subsetsand no post filter4EANM specification are shown in the final column.EQ PET is mitigating the impact of the reconstruction protocol which couldimpact patient management.
IterativeFigure 3. Lung cancer patientreconstructed with Iterative,HD PET, and UltraHD PET. TheSUVmax for a small lesion in theposterior left lung increaseswith the addition of advancedreconstruction techniques.Data courtesy of University ofTennessee Medical Center,Knoxville, TN, USA.HD PETUltraHD PET5
Case Study 3 –Inter-Site SUV ThresholdsChallenge: Use SUV-based thresholds to guidepatient management decisions, even if theywere defined on an older PET/CT system.PET/CT is an integral part of staging many cancer types and guidessubsequent patient management decisions. Initial assessment of asuspicious lesion’s malignancy is commonly performed based on18F-FDG uptake, with some sites using SUV-based thresholds tocategorize lesions in terms of likelihood of malignancy. Furthermore, SUV-based thresholds of change for classifying treatmentresponse are also widely used (e.g., EORTC, PERCIST).SUV-based thresholds determined at one site may not be applicable to patient data acquired at other sites or using other scannermodels or reconstruction protocols.EQ PET, in combination with a standardized imaging protocol,facilitates the inter-site application of SUV-based thresholds forstaging or response assessment.Consider the clinical example in Case Study 1. Based on a 25%SUVmax change threshold (EORTC), there is considerable variationin response classification with the different reconstruction combinations, even when the pre- and post-RT protocols are matched.This variation is reduced with EQ PET.Given the clinical example in Case Study 2, it is clear that usinga fixed SUV threshold to estimate likelihood of malignancy couldresult in different clinical decisions being made for a same patientdepending on how it was reconstructed. This dependency onreconstruction can be reduced with reference-based EQ PET.The results shown in the examples in this whitepaper are characteristic of a more comprehensive study2, which demonstrateda significant reduction in reconstruction-dependent variation forboth SUVmax and SUVpeak.6ConclusionsEQ PET provides clinicians with harmonized SUVs, allowing them to: Quantitatively assess treatment response in patients,even if imaged on different PET/CT systems Participate in multi-center clinical trials, without modifyingtheir reconstruction protocols Use SUV-based thresholds to inform patient managementdecisions, even if they were defined on an older PET/CT system
Appendix A: EQ PET ParameterDeterminationEQ PET parameters can be selected to align PET quantification withlower recovery protocols. These include specifications publishedby international societies (e.g., EANM procedure guidelines), orexisting PET protocols used within imaging centres.The following illustrates one approach for selecting an appropriate harmonization parameter. This approach requires a NEMAIQ phantom acquired and reconstructed using the same protocolused for clinical PET/CT studies.Test ProtocolIn this example, we used a NEMA IQ phantom filled with an 8:1sphere to background activity concentration ratio, acquired for3 minutes on a Biograph mCT 64 with TrueV and reconstructedwith ultraHD PET (Table 4). The acquisition was repeated 3 times.PropertyValuePhantom activity5.2 kBq.ml-1 (background)41.6 kBq.ml-1 (spheres, 8:1)Acquisition duration180 s (30x106 net trues)Scanner modelBiograph mCT 64 with TrueVReconstruction methodUltraHD (PSF TOF) 2i21sConvolution kernel5 mm FWHM GaussianRows x columns256x256Pixel spacing3.182x3.182 mmSlice thickness2.027 mmTarget ProtocolThe target protocol used in this example is that specified in theEANM procedure guidelines3 for the maximum voxel value (Table 5).EANM Sphere diameter (mm)Expected RC for max voxel100.38130.63170.84220.89280.95370.98Table 5. Target recovery coefficient (RC) specifications for maximum voxel valueused in this example.3Recovery Coefficient MeasurementFor each phantom acquisition, the recovery coefficient (R) for themaximum voxel in each sphere was computed as follows:whereis the maximum activity concentration (Bq.ml-1)measured in an image voxel for a VOI corresponding to the sphereinsert, andis the true activity concentration (Bq.ml-1) inthe sphere.3Table 4. Phantom, acquisition and reconstruction properties usedin this example.7
EQ PET Parameter OptimizationAConventional Recovery CoefficientsBRecovery Coefficients with EQ PET HarmonizationThe RCs measured for each phantom acquisition were comparedto those specified in the EANM procedure guidelines (Figure 4A).The RCs were then recomputed following the application of anadditional Gaussian smoothing filter (see Appendix C for details).The size of this additional filter was increased in steps of 0.1 mmFWHM until the mean absolute percentage difference betweenthe measured RCs and those specified in the EANM guidelinewas minimized (Figure 4B). The filter sizes required to minimizethe percentage difference for the acquisitions used in this exampleare shown in Table 6. Based on these acquisitions, the recommended EQ PET parameter to align the UltraHD reconstructionprotocol used in this example with the EANM guideline wouldbe 6.8 mm FWHM.Phantom acquisitionEQ PET parameterFWHM (mm)Acquisition 16.7Acquisition 27.1Acquisition 36.6Mean6.8Table 6. EQ PET normalization parameters computed for the 3 phantomacquisitions used in this example.Figure 4. (A) RCs measured for the 3 acquisitions of the NEMA phantomrelative to those specified in the EANM guidelines.3 (B) RCs measuredfor the same 3 acquisitions following application of the EANM-matchingEQ PET harmonization parameter.8
Appendix B: Computing EQ PETParameters in syngo.viaThis section describes how syngo.via can be used to computethe optimal EQ parameter size for a given scanner model andreconstruction protocol.Example DatasetIn this example, a NEMA IQ phantom was prepared and reconstructed as described in Table 7.PropertyValue-1True AC in sphere18.70 kBq.mlScanner modelBiograph 6 with TrueVReconstruction methodHD PET (PSF) 3i21sConvolution kernelAll pass (0 mm)Rows x columns168x168Pixel spacing4.073x4.073 mmSlice thickness5.0 mmTable 7. Phantom preparation and reconstruction protocol used inthis example.EQ PET Parameter OptimizationThe steps used to compute the optimal EQ parameter for thephantom dataset described above are as follows:1. The target activity concentration for each of the phantom hotspheres (column ‘EANM target AC’ in Table 8) was computedby multiplying the true decay-corrected activity concentration(column ‘True AC’ in Table 8) by the corresponding EANM targetrecovery coefficient (column ‘EANM target recovery’ in Table 8).2. Create a spreadsheet (e.g., in Microsoft Excel ) to compute themean absolute percentage difference in activity concentrationsfor the Max.eq values with a given EQ parameter versus thetarget values computed in Step 1 (Table 8).3. T he NEMA IQ phantom dataset is loaded into syngo.viaMMOncology.4. The units are set to Bq.ml-1 from the units entry in the bottomright corner menu.5. Each of the hot spheres is segmented using one of the availablePET segmentation tools accessed via the top right corner menu(e.g., VOI Isocontour) (Figure 5).6. Ensure Max.eq is displayed in the findings evaluation text. This isset in the Segmentation Properties dialogue (Figure 6) accessedby right-clicking on the chosen segmentation tool item in thetop right corner menu.7. Find the EQ parameter that minimizes the mean absolutepercentage difference in activity concentrations for the Max.eq values versus the target values computed. This could be doneby entering EQ parameter sizes in 0.1 mm increments until theminimum is found.8. For the dataset used in this example, the optimal EQ parametersize was 6.5 mm with a mean absolute percentage differenceof 4.43 % (Table 8).Figure 5. Segmentation of the hotspheres in the NEMA IQ phantomwith syngo.via MMOncology.9
Figure 6. Turning on display ofMax.eq via the SegmentationProperties dialogue (left) and settingthe EQ parameter via the Quantification Parameters blind (right).SpherediameterEANM targetrecoveryTrue AC(kBq.ml-1)EQ Parameter 0 mmEQ Parameter 6.5 mmEANM targetAC (kBq.ml-1)Measured AC(kBq.ml-1)Measured AC(kBq.ml-1)% diff. vs.EANM AC% diff. vs.EANM AC10 mm0.3818.707.1110.7350.9 %6.43-9.6 %13 mm0.6318.7011.7819.5065.6 %11.76-0.2 %17 mm0.8418.7015.7123.1347.2 %16.736.5 %22 mm0.8918.7016.6423.8943.6 %18.018.2 %28 mm0.9518.7017.7722.0424.0 %17.65-0.7 %37 mm0.9818.7018.3322.8624.7 %18.59Mean absolute % difference vs. EANM target:42.7 %1.4 %4.4 %Table 8. Target and measured activity concentrations (AC) for the phantom dataset used in this example. An EQ parameter of 6.5 mm provided the bestalignment (smallest mean absolute percentage diffence) with the EANM target recovery coefficients.10
Appendix C: Gaussian SmoothingMethodologyGaussian smoothing for EQ PET in syngo.via is performed usinga direct convolution operation with the kernel constructed asdescribed below.Kernel ConstructionThe function for calculating each element’s value in the GaussianKernel matrix can be defined as:1ef@f dx , dy , dz ,# N12@dσ2x2xd y2 σ2ydz2 σz2#Where dx, dy and dz are the distances (in units of number of voxels)of the center of the kernel voxel from the center of the kernel. N isthe sum of all voxel values in the kernel to ensure the final valuessum to 1. σx, σy and σz specify the sigma of the Gaussian kernelin each dimension (in units of number of voxels).The size or extent, g, of the kernel (in units of number of voxels) iscomputed from the Gaussian FWHM (in units of number of voxels)in each dimension as follows:TYgxgygz round up to the next odd number T2FWHMxFWHMyFWHMzY 1The kernel extent in each dimension must be an odd number ofvoxels to ensure it is symmetric around the central voxel.Figure 7. Relationship between FWHM, sigma (σ) and kernel size or extent (g) for a Gaussian kernel. The intensity profile (blue) is shown for a singledimension of the kernel (grey grid). During the convolution, any image voxels outside the extent of the kernel are ignored.11
About the AuthorReferencesDr. Matthew Kelly received a B.Sc. (hons) in Applied Neurosciencefrom the University of Manchester in 2001, and then completeda Ph.D. in Pharmacology at the University of Cambridge in 2005.He has worked in medical imaging since 2006 at the University ofOxford and joined the Science and Technology Team of SiemensMolecular Imaging in 2007.1 Lasnon C, Desmonts C, Quak E, et al. Harmonizing SUVsin multi-center trials when using different generation PETsystems: prospective validation in non-small cell lung cancerpatients. Eur J Nucl Med Mol Imaging. 2013;40:985.2 Kelly M, Declerck J. SUVref: reducing reconstructiondependent variation in PET SUV. Eur J Nucl Med Mol ImagingRes. 2011;1:16.3 Boellaard R, O’Doherty MJ, Weber WA, et al. FDG PET andPET/CT: EANM procedure guidelines for tumor PET imaging:version 1.0. Eur J Nucl Med Mol Imaging. 2010;37:181.4 Wahl R, Jacene H, Kasamon Y, Lodge M. From RECIST toPERCIST: Evolving Considerations for PET Response Criteriain Solid Tumors. J Nucl Med. 2009;50:122S.5 Young H, Baum R, Cremerius U, et al. Measurement ofClinical and Subclinical Tumor Response Usinf [18F]-fluorodeoxyglucose and Positron Emission Tomography: Review and1999 EORTC Recommendations. Eur J Cancer. 1999;35:1773.6 de Langen A, Vincent A, Velasquez L, et al. Repeatabilityof 18F-FDG Uptake Measurements in Tumors: A Metaanalysis.J Nucl Med. 2012;53:701.7 National Electrical Manufacturer’s Association. NEMAStandards Publication NU 2-2007. Performance Measurementsof Positron Emission Tomographs. NEMA; 2007.12
Trademarks and service marks used in thismaterial are property of Siemens MedicalSolutions USA or Siemens AG.Siemens Medical Solutions USA, Inc. Siemens Medical Solutions USA, Inc.All rights reserved.All photographs Siemens MedicalSolutions, USA, Inc. All rights reserved.Note: Original images always lose a certainamount of detail when reproduced.Global Business UnitSiemens Medical Solutions USA, Inc.Molecular Imaging2501 N. Barrington RoadHoffman Estates, IL 60192-2061USATelephone: 1 847 304 7700www.siemens.com/miGlobal Siemens HeadquartersSiemens AGWittelsbacherplatz 280333 MunichGermanyGlobal Siemens HeadquartersHealthcare HeadquartersSiemens AGHealthcare SectorHenkestrasse 12791052 ErlangenGermanyTelephone: 49 9131 84-0www.siemens.com/healthcareAddress of legal manufacturerSiemens Medical Solutions USA, Inc.Molecular Imaging2501 N. Barrington RoadHoffman Estates, IL 60192-2061USATelephone: 1 847 304 7700www.usa.siemens.com/miOrder No. A91MI-10410-1T-7600 All rights reserved MI-1345.TM.JV.TW.1500 05.2014, Siemens AGwww.siemens.com/mi
EQ PET parameters necessary to align with the EANM specifica- tion 2 , this variability is reduced to within the reported test