Transcription
Date19 March 2018ThemeFundsReportListed Investment CompaniesMonthly update – February 2018Michael Rong 61 3 9640 3863 michael.rong@wilsonsadvisory.com.au; William Liu 61 2 8247 3187 william.liu@wilsonsadvisory.com.auDomestic marketThe S&P/ASX 200 Accumulation Index rose 0.4% in February, with losses during the start of themonth fully regained on a total return basis. In price terms, the index hit a high of 6,121 points earlyin February, bottoming at 5,821 points (a fall of 4.9%), and then recovering to end the month at6,016 points (90% recovered from the start of the month). February’s gains were driven by thehealth care sector ( 7.0%), with CSL ( 11.4%) the top performer on the back of record HY profitand a lift in its full-year guidance.Consumer staples ( 2.1%) shares were also higher, with strong gains from market darling A2 Milk( 47.5%) following a big earnings beat, while Woolworths ( 2.5%) enjoyed a solid earningsperformance, including a 3.8% rise in sales. The telecom sector (-6.2%) was the worst performingfor the month, with Telstra (-4.4%) still out of favour since reducing its dividend, and Vocus Group(-18.1%) hit hard following a downgrade to its FY18 guidance and the departure of CEO GeoffHorth. The energy sector (-3.8%) also came under pressure, with Whitehaven Coal (-8.9%) battlinghigher-than-expected operating costs, albeit with the offset of a buoyant coal price.Market wrapIndexTable of contentsDecemberreturnS&P 500 Index(3.7%)MSCI World Index(3.5%)MSCI Emerging Markets (AUD)(0.9%)FTSE 100 Index(3.4%)DAX (Germany)(1.6%)CSI 300 Index(5.9%)Nikkei 225 Index(4.5%)Global marketsThe MSCI World ex-Australia Index returned -0.6% in Australian dollar terms and -3.6% in localcurrency terms as global equity markets were rocked by volatility and a sharp correction early inthe month. The US S&P 500 Index was down 3.9% over the month, hitting a low of 2,581 points toend at 2,714. The VIX, a measure of implied volatility, spiked to a high of 37.3 to end the month at19.9 – still elevated compared to recent historic lows. IT was the only sector to gain ( 0.1%),boosted by Apple ( 6.8%) and Hewlett Packard ( 13.4%). Energy (-10.8%) was the biggest losingsector, with oil giant Marathon falling 19.9%, with consumer staples (-7.8%) not far behind, withdefensive stocks like Walmart (-15.6%) and Kraft Heinz (-14.5%) failing to recover from the broadermarket correction. The US Dow Jones Index fell 4.3% but was still higher than at the end of 2017.In Europe, the STOXX Euro 600 Index fell 4.0%, with falls in telecom (-5.1%) and utilities (-4.8%).The German federal court paved the way for cities to ban or tax diesel cars, with the price of majorauto shares reacting negatively, including Volkswagen (-9.0%) and Daimler (-4.4). In Asia, theChinese CSI 300 Index was down 5.9%, Japan’s Nikkei 225 Index fell 4.5%, and Hong Kong’sHang Seng dropped 6.2%. Global developed market shares fell 3.5% and emerging market sharesfell 3.9% in local currency terms.STOXX Europe 600(3.8%)S&P/ASX 200 Index0.4%S&P/ASX All Ordinaries0.2%S&P/ASX Small Ordinaries0.0%Month in review – markets1Our LIC key preferences3LIC key metrics13Charts: Monthly change inpremium/discount to NTA16Performance metrics18Charts: NTA premium/discountand total return vs benchmark21Charts: 12-month historicaldividend yield22Charts: Pre-tax NTA premiumdiscount vs long-term average24Charts: Pre-tax NTA growthvs NTA premium/discount26Charts: Historical premium/discountto pre-tax NTA28Source: Capital IQ. All returns in local currency.Wilsons Investment StrategyIssued by Wilsons Advisory and Stockbroking Limited (“Wilsons”) ABN 68 010 529 665 - AFSL No. 238375, a participant of ASX Group. Past performance is not a reliable indicator of future performance. This document should be read in conjunction withthe disclosures and disclaimer at the end of this document.
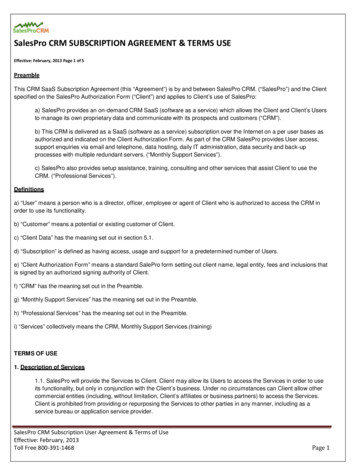
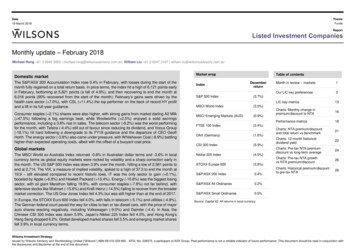
19 March 2018FundsListed Investment CompaniesCurrenciesThe AUD was flat in trade-weighted terms over the three months to the end of February, with cooling commodity prices and reduced export volumes offsetting rises in the start of the year. The AUDrose 3.0% against the USD, hitting high of 0.8110 in late January to end February at 0.7792. The AUD was down against the JPY (-2.3%) and the NZD (-2.3%) and up against the EUR ( 0.4%) andGBP ( 1.0%).The US Dollar Index fell 2.4% over the three months to February. The USD hit a high of 0.8634 against the EUR in November and a low of 0.8006 in January to end February at 0.8190 and flat overthree months. The USD was down against the JPY (-5.8%) and flat against the EUR, GBP and CHF.AUD weakness in February in part reflected a vanishing yield premium, with the US Fed expected to hike rates, possibly as early as March. The US Dollar Index rose 1.7% in February but stillappears to be in a downward trend. Concerns over the rising US budget and current account deficits may have contributed to US dollar falls over recent months.CommoditiesThe commodities rally paused for breath in February, with metals flat or falling and a dip in oil putting pressure on what has become a crowded futures trade. Most base metals fell through themonth, including lead (-4.2%), aluminium (-3.9%), zinc (-2.6%), copper (-2.6%) and tin (-0.7%), while nickel ( 1.4%) managed to gain. Gold fell 2.0% to finish at US 1,318.31/oz in what proved avolatile month. The spot price of iron ore delivered to China (62% Fe) rose 5.6% from US 71.61/t to 75.59, pushing towards its August 2017 high of 78.91. In oil markets, the Brent spot price fell2.5% from US 67.78/b to 66.08, while WTI fell 5.2% from 64.82 to 61.43.World equity indices’ price performance (rebased 01 Jan 2016)1.501.401.301.201.101.000.900.800.70Jan 16Apr 16MSCI WorldJul 16Oct 16Jan 17S&P/ASX 200Small OrdsSource: Wilsons, Lonsec, S&P Capital IQWilsons Investment StrategyPage 2Apr 17S&P 500Jul 17Oct 17STOXX Europe 600Jan 18Nikkei 225
19 March 2018FundsListed Investment CompaniesLIC key preferencesWe provide an overview of our preferred LICs within each category:1.Domestic equities – large/medium cap and medium/small cap2.Absolute return funds3.International equities4.Specialist fundsWhen selecting these funds we examined their performance against the following key metrics: NTA and total return (share price and dividends paid) performance – has the LIC delivered on its investment objective of outperforming its underlying benchmark? Dividends paid and stability of dividends paid – has the LIC paid a dividend to shareholders and has there been a stable and continuous dividend paid profile? Premium/discount to NTA – what is the current premium/discount to NTA? How has the share price traded relative to its NTA through time? Liquidity – is there sufficient liquidity to enter and exit the fund? Underlying management team – is the manager well regarded in the market? Is there transparency in the underlying portfolio and the team’s investment process?CompanyASX codeInvestment focusAMHLarge/Medium CapQV EquitiesQVEMedium CapSpheria Emerging CompaniesSECSmall CapAcorn Capital InvestmentACQSmall CapWMKMarket NeutralAntipodes Global Investment CompanyAPLGlobalVGI Investment PartnersVGIGlobalAbsolute Return FundsWatermark Market Neutral FundInternational EquitiesWilsons Investment StrategyPage 3ASX codeInvestment focusMXTAustralian Corporate LoansBAFAlternative AssetsFixed IncomeAustralian EquitiesAMCILCompanyMetrics Credit PartnersSpecialist SharesBlue Sky Alternatives Access Fund
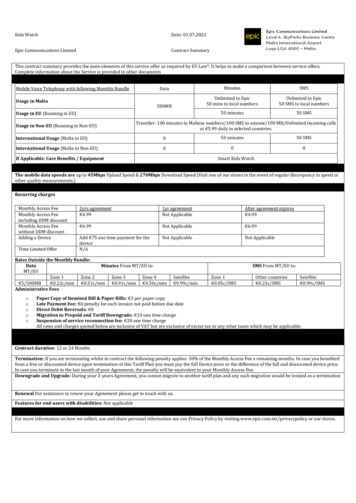
19 March 2018FundsListed Investment CompaniesDomestic equities large cap: AMCIL (AMH)Key dataInvestment styleAll cap, valueBenchmarkS&P/ASX 200Accumulation IndexManagement fee0.77%Performance feeNoMarket capListing dateFund descriptionAMCIL manages a concentrated investment portfolio comprising 40 to 50 stocks covering large and small companies in the Australianequity market.As a result, small companies by market size can have an equally important impact on portfolio returns as larger companies in the Australianmarket. The number of holdings in the portfolio will depend on market conditions and investment opportunities. The selection of stocks inthe portfolio is based on attractive valuations as well as the outlook for growth and the competitive structure of the industry.Given the concentrated investment focus of AMCIL, holdings will be sold from time to time to fund additional investments to the portfolio.Portfolio performance* 234.0m10 February 2000Share price and NTA profileTotalreturnTotal 48%-6%-30%-35%Disc/prem15%10%1.005%0.80Share priceAs at 15/03/2018CPS1.20Pre-taxNTA performance 0.90NTA at 28/02/2018Pre-tax NTA 0.97Post-tax NTA 0.89Pre-tax r5yr0.407%2%5%0%0%-13%0.20-8%Post-tax1%3-year average-2%12-month historicalDividend yield3.9%Gross dividend yield5.6%Source: Wilsons, company data, IRESS*NTA performance is exclusive of dividends paid. Total return isshare price and dividends paid.Wilsons Investment StrategyPage 4-15%-20%-25%0.00Nov-07Share price premium/discount to NTAPre-tax NTA0%-30%Nov-09Nov-11Prem/disc (RHS)Nov-13NTA (LHS)Sector allocationNot disclosedNov-15Nov-17Share price (LHS)Avg prem/disc (RHS)Top holdings as at 28 February 2018BHP Billiton7.48%Westpac Banking Corporation4.71%National Australia Bank4.58%CSL4.45%Lifestyle Communities4.16%
19 March 2018FundsListed Investment CompaniesDomestic equities medium cap: QV Equities (QVE)Key dataInvestment styleValue, medium cap, ex top 20BenchmarkS&P/ASX 300 AccumulationIndex excluding the S&P/ASX20 Accumulation IndexManagement fee1.10%Performance feeNoMarket cap 333.1mListing date22 August 2014Fund descriptionThe investment objective is to provide long-term capital growth over a five year-plus investment horizon through investment in a diversifiedportfolio of quality, undervalued ASX-listed equities and other investment securities, outside the ASX top 20 securities.The ASX top 20’s composition is very concentrated by sector, with the financials and materials sectors combined representing almost70% of holdings. An investment portfolio that is based on stocks outside the top 20 has a much broader and evenly spread setof sectors.It is QV’s belief that companies ex the top 20 can still be leaders in their field with competitive advantages over their peers and strongrecurring and predictable earnings offering greater opportunities for above-market returns.As well as long-term capital growth, Investors Mutual (QV is one of IML’s funds) is focused on long-term income growth, seekinginvestment opportunities that pay sustainable and growing dividends with active franking credits. The portfolio is managed from anAustralian investor’s perspective, with tax being an important consideration in its daily management.Portfolio performance*As at 15/03/2018Share price and NTA profileTotalreturnShare price 1.21NTA at 28/02/2018Pre-tax NTA 1.22Post-tax NTA 1.17Share price premium/discount to NTAPre-tax NTA-1%Post-tax3%3-year NTA performance6m1yr3m6m1yr3%3%5%2%-3%-1%Sector allocationDividend yield3.5%10%Gross dividend yield5.0%5%Wilsons Investment StrategyPage 5Pre-tax NTAout/under-performance*3m15%Source: Wilsons, company data, IRESS*NTA performance is exclusive of dividends paid. Total return isshare price and dividends 2-month historicalTotal 00Sep-14-10%Feb-15Jul-15Dec-15May-16Prem/disc (RHS)NTA (LHS)Oct-16Mar-17Aug-17Jan-18Share price (LHS)Avg prem/disc (RHS)Top holdings as at 28 February 2018Tox Free Solutions4.10%Amcor4.00%Pact Group3.90%Sonic Healthcare3.90%Crown Resorts3.70%
19 March 2018FundsListed Investment CompaniesDomestic equities small cap: Spheria Emerging Companies (SEC)Key dataInvestment styleValue, small/micro capBenchmarkS&P/ASX Small OrdsAccumulationManagement fee1.00%Performance fee20% (plus GST) of theoutperformance versus thebenchmarkMarket cap 132.3mListing date04 December 2017Fund descriptionSpheria is an Australian small cap and microcap fund manager with a combined 40 years’ of investment experience and an excellent trackrecord, generating top-quartile returns to have relatively low risk.The manager will seek to purchase securities in businesses where the present value of future free cash flows can be reasonablyascertained, and the security is trading at a discount to the assessed fundamental valuation. Preference will be given to companies itconsiders to have relatively low risks – entities that are geared to a level that the manager considers appropriate given the nature of therelevant businesses – and have free cash flow to support that relevant level of gearing.Portfolio performance*Share price and NTA 2.05Share priceAs at 15/03/2018Disc/prem2.20-4%2.00-6%1.95 2.001.90Pre-taxNTA performance-8%1.85-10%1.80NTA at 28/02/20183mPre-tax NTA 2.08Post-tax NTA 2.06Share price premium/discount to NTAPre-tax NTA-4%Post-tax-3%3-year average0%12-month historicalDividend yieldN/AGross dividend yieldN/ASource: Wilsons, company data, IRESS*NTA performance is exclusive of dividends paid. Total return isshare price and dividends paid.N/ASector allocationNot 18Feb-18Mar-18Prem/disc (RHS)Share price (LHS)NTA (LHS)Avg prem/disc (RHS)Top holdings as at 28 February 2018Sirtex 0%Wilsons Corporate Finance Limited (ACN 057 547 323: AFSL 238 383) acted as Lead Arranger and Joint Lead Manager in the December 2017 IPO of Spheria Emerging Companies Limited securities for which it received fees or will receive fees foracting in this capacity. This document should be read in conjunction with the disclosures and disclaimer at the end of this document.Wilsons Investment StrategyPage 6
19 March 2018FundsListed Investment CompaniesDomestic equities small cap: Acorn Capital Investment (ACQ)Investment styleNeutral, small/micro cap(incl unlisted)Fund descriptionOne of Australia’s few specialist listed funds to invest in Australian microcap shares, Acorn Capital focuses on this generally neglectedpart of the market because of the lack of research in this area provides scope to uncover growth opportunities.BenchmarkS&P/ASX Small OrdinariesAccumulation IndexAcorn aims to exploit inefficiencies in the pricing of stocks that arise from information gaps about microcaps, and to identify opportunitiesfor long-term growth. The fund is style and sector neutral, typically holding a portfolio of 65-80 stocks with a low expected portfolio turnover.Management fee0.95%In November, two of Acorn’s unlisted investments (Telix Pharmaceuticals and Ocean Grown Abalone) listed on the ASX contributing tothe recorded performance of 8.8% in the month, compared to the 3.9% return of the S&P/Small Ordinaries Accumulation Index.Performance fee20% of outperformance offunds NAV to the benchmark,subject to various testsMarket cap 60.7mListing date01 May 2014Key dataPortfolio performance*Share priceAs at 15/03/2018Acorn has also announced the 7.5m acquisition of seven assets from Washington H Soul Pattinson. The acquisition will be funded byshare issuance at its post-tax NTA. With part of the consideration deferred, this should be seen as an endorsement of Acorn’s managementteam. The pro-forma market cap post the transaction will lift from 50m to 57m. Acorn has recently announced its intention to pay ahigher annual dividend target 5% (up from 3%) of closing post-tax NTA (franked to the highest possible extent). With greater size andhigher dividend payments it is possible that Acorn’s discount to NTA could reduce.Share price and NTA profileTotalreturn 1.16Total 14%18%6%NTA at 28/02/2018Pre-tax NTA 1.31Post-tax NTA 1.25Share price premium/discount to NTAPre-tax NTA-12%Post-tax-8%3-year axNTA performancePre-tax %-3%-15%0.60-20%0.40-25%0.200.00Jun-14 Nov-14 Apr-15 Sep-15 Feb-16Prem/disc (RHS)Jul-16NTA (LHS)Sector allocationNot disclosed12-month historicalCPS1.60-30%Dec-16 May-17 Oct-17 Mar-18Share price (LHS)Avg prem/disc (RHS)Top holdings as at 28 February 2018Genea*4.00%Dividend yield3.1%Telix Pharmaceuticals3.60%Gross dividend yield4.4%Calix*3.20%Redbubble2.90%Moula Money*2.50%Source: Wilsons, company data, IRESS*NTA performance is exclusive of dividends paid. Total return isshare price and dividends paid.* UnlistedWilsons Investment StrategyPage 7
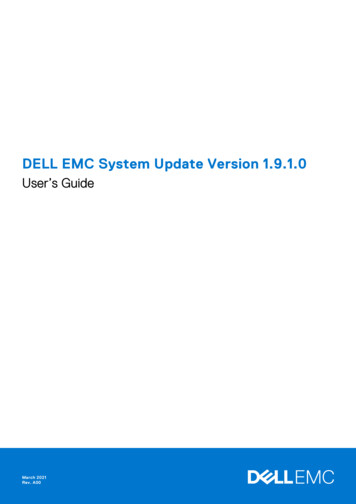
19 March 2018FundsListed Investment CompaniesAbsolute: Watermark Market Neutral (WMK)Key dataInvestment styleAll cap, market neutral,domestic and global mandateBenchmarkRBA cash rateManagement fee1.00%Performance fee20% (plus GST) ofperformance above thebenchmarkMarket cap 70.1mListing date18 July 2013Fund descriptionIn a market-neutral structure, returns are derived from the difference in performance between a long and a short portfolio of shares. As bothportfolios are of equal size, the fund is fully hedged, retaining little or no net exposure to the share market. Irrespective of whether theportfolios are rising or falling, a positive return is achieved when the long portfolio outperforms the short. In this way, returns from a marketneutral strategy will have no correlation with the performance of the broader share market, reflecting instead the investment manager’ssuccess in selecting the right securities.While the share market is generally efficient in valuing companies, there will always be a select group of companies that are mispriced atany given point in time. Watermark’s investment strategy allows investors to benefit from its success in identifying “strong” companies toinvest in and “weaker” companies to sell short, without being fully exposed to the volatility and risks of the share market.Sector exposureShare price and NTA profileCPS1.20Disc/prem10%UtilitiesAs at 15/03/20185%1.00Share priceTelco0.80IT0.60 0.800%-5%-10%NTA at 28/02/20180.40Pre-tax NTA 0.95MaterialsPost-tax NTA 0.96IndustrialsShare price premium/discount to NTAPre-tax NTA-16%Post-tax-17%3-year average-5%Dividend yield2.5%Gross dividend yield3.0%Source: Wilsons, company data, IRESS*NTA performance is exclusive of dividends paid. Total return isshare price and dividends paid.Health CareWilsons Investment StrategyPage 8-25%Feb-14Aug-14 Feb-15Prem/disc (RHS)Aug-15Feb-16Aug-16NTA (LHS)Feb-17 Aug-17 Feb-18Share price (LHS)Avg prem/disc (RHS)Portfolio performance*REITsTotalreturnFinancialsCons Staples-20%-10%0%ShortLong10%20%Total %13%-14%-18%11%Cons Disc.-30%-20%0.00Aug-13Energy12-month historical-15%0.20Pre-taxNTA performance30%Pre-tax %-9%0%
19 March 2018FundsListed Investment CompaniesAbsolute: VGI Investment Partners (VG1)Investment styleAbsolute return/value(long/short)Fund descriptionAccess to a concentrated portfolio that will predominantly comprise long and short positions in global listed securities. The portfolio will beactively managed with a focus on capital preservation and aims to generate superior risk-adjusted returns over the long term ( 5 years).BenchmarkN/AThe listed vehicle provides access to an investment strategy and an investment manager that had only previously been accessible towholesale investors with a 1m minimum investment.Management fee1.50%We view the investment manager favourably and believe that the team has deep expertise across equity markets; since inception in 2008it has successfully implemented the same investment strategy with a strong and robust investment process.Performance fee15% of the portfolio’sperformance subject to a highwatermark mechanismPortfolio performance*Key dataMarket cap 572.5mListing date28 September 2017Share priceAs at 15/03/2018Share price and NTA %N/AN/A 2.08Pre-taxNTA performanceNTA at ax NTA 2.053m6m1yrPost-tax NTA sc (RHS)Jan-18NTA (LHS)Share price premium/discount to NTAPre-tax NTA1%Post-tax1%3-year average1%12-month historicalDividend yieldN/AGross dividend yieldN/ASource: Wilsons, company data, IRESS*NTA performance is exclusive of dividends paid. Total return isshare price and dividends paid.Sector allocationNot disclosedFeb-18Mar-18Share price (LHS)Avg prem/disc (RHS)Top holdings as at 28 February 2018CME Group8.00%Colgate Palmolive5.00%Mastercard4.00%Medibank Private4.00%The Coca-Cola Co.4.00%Wilsons Corporate Finance Limited ACN 057 547 323, AFSL 238 383 acted as Joint Lead Manager in the September 2017 IPO of VGI Partners Global Investments Limited securities for which it received fees or will receive fees for acting in this capacity.This document should be read in conjunction with the disclosures and disclaimer at the end of this document.Wilsons Investment StrategyPage 9
19 March 2018FundsListed Investment CompaniesInternational: Antipodes Global Investment Company (APL)Investment styleLong/short, valueFund descriptionLong-short global securities investment portfolio with a currency overlay. The portfolio will aspire to accumulate wealth over the long termby generating positive returns in excess of the benchmark at below-market levels of risk.BenchmarkMSCI All Country World NetIndex in AUDThe manager seeks to purchase securities in what it considers to be great businesses that are not valued as such and build a high convictionportfolio with a capital preservation focus. Investors should be aware that returns can vary considerably from broad index returns.Management fee1.10%Performance fee15% of net outperformance,subject to a high watermarkMarket cap 424.2mListing date18 October 2016Key dataAntipodes was formed in March 2015 by Jacob Mitchell with the backing of Pinnacle Investment Management. The portfolio manager, MrMitchell, has more than 20 years’ investment experience and prior to forming Antipodes was Deputy Chief Investment Officer and PortfolioManager at Platinum Asset Management.Portfolio performanceShare price and NTA profileCPS1.40TotalreturnDisc/prem8%6%1.20Share priceAs at 15/03/2018 1.243m6m1yr1.00-1%4%11%0.804%2%0%0.60NTA at 28/02/2018Pre-tax NTAPost-tax NTAPre-taxNTA performance 1.29 1.24Share price premium/discount to NTAPre-tax NTA-4%Post-tax0%3-year averageN/A30%25%20%12-month historical15%Dividend yieldN/AGross dividend yieldN/ASource: Wilsons, company data, IRESS*NTA performance is exclusive of dividends paid. Total return isshare price and dividends paid.Wilsons Investment StrategyPage 1010%-4%0.203m6m1yr1%9%14%Sector 7Jul-17Sep-17Nov-17Jan-18Mar-18Prem/disc (RHS)Share price (LHS)NTA (LHS)Avg prem/disc (RHS)Regional allocationRest of World1.3%Australia1.7%Other2.6%Cash4.1%United States25.3%Western Europe20.9%5%0%Developing Asia21.2%Developed Asia23.0%
19 March 2018FundsListed Investment CompaniesFixed income: MCP Master Income Trust (MXT)Key dataInvestment styleFixed incomeBenchmark90-day BBSWManagement fee0.58%Performance fee15% of the differencebetween the return and theHurdleFund descriptionMCP is an Australian debt-specialist fund manager. The investment team have on average 30 years’ direct lending experience and hasshown a strong track record in originating, structuring, negotiating, managing and distributing Australian corporate loans. The MCP MasterIncome Trust provides a unique opportunity to access monthly cash income from direct lending to Australian corporates.Some of the characteristics of this investment opportunity are its attractive risk-adjusted returns from a diversified portfolio, monthly cashincome with low risk of capital loss and low capital volatility, and access to floating rate credit.Portfolio performance*Share price and NTA profileCPS2.12TotalreturnMarket cap 516.2m3mListing date09 October %2.022.00Share priceAs at 15/03/2018Pre-taxNTA performance 2.00 2.00Post-tax NTAN/A3m6m1yr0N/AN/AIndustry allocation0%Post-taxN/A3-year averageN/A1.94Nov-170%Nov-17Dec-17Jan-18Prem/disc (RHS)NTA (LHS)Jan-18Feb-18Mar-18Share price (LHS)Avg prem/disc (RHS)Credit quality BB rated, 1%Cash, 16%Share price premium/discount to NTAPre-tax NTA1%1.96NTA at 28/02/2018Pre-tax NTA2%1.98Other, 35%AA rated (cash), 16%BB rated, 26%A rated, 12%RE Management &Development, 18%12-month historicalDividend yieldN/AGross dividend yieldN/ASource: Wilsons, company data, IRESS*NTA performance is exclusive of dividends paid. Total return isshare price and dividends paid.Hotels, Restaurants andLeisure, 9%REITs, 11%TransportationInfrastructure, 11%BBB rated, 45%Wilsons Corporate Finance Limited ACN 057 547 323, AFSL 238 383 acted as Joint Lead Manager in the September 2017 IPO and the February 2018 Entitlement Offer for MCP Master Income Trust securities for which it received fees or will receive feesfor acting in this capacity. This document should be read in conjunction with the disclosures and disclaimer at the end of this document.Wilsons Investment StrategyPage 11
19 March 2018FundsListed Investment CompaniesSpecialist: Blue Sky Alternative (BAF)Key dataInvestment styleAlternative assetsBenchmark8% per annumManagement fee1.12%Performance fee17.5% fee on returns abovehurdle rate of 8%Fund descriptionBlue Sky Alternative is an ASX-listed (ASX:BLA) alternative asset manager with more than 2bn in assets under management. Blue Skyhas built a strong investment track record across private equity, venture capital, hedge funds, private real estate and real assets (primarilywater and water infrastructure) of 16.7% per annum compounding (net of fees).The Fund Limited is mandated to invest in a diversified portfolio of alternative assets, including: 1) private equity and venture capital, 2)real assets, 3) private real estate, and 4) hedge funds.Portfolio performance*Market capListing date 257.3m16 June 2014Share price and NTA %0.800%Share priceAs at 15/03/2018Disc/prem1.400.60Pre-taxNTA performance 1.13-5%0.40-10%0.20NTA at 28/02/20183mPre-tax NTA 1.14Post-tax NTAN/AShare price premium/discount to NTAPre-tax NTA-1%Post-taxN/A3-year average1%12-month historicalDividend yield4.3%Gross dividend yield6.2%Source: Wilsons, company data, IRESS*NTA performance is exclusive of dividends paid. Total return isshare price and dividends paid.Wilsons Investment StrategyPage 126m1%1yr-1%4%0.00Jul-14-15%Dec-14 May-15 Oct-15Prem/disc (RHS)Mar-16Aug-16NTA (LHS)Top holdings as at 28 February 2018Sector allocationCove & Other Real Estate7%Cash8%Blue Sky Water Fund17%Strategic Ag Fund4%StudentAccommodation17%Other Real Assets6%Retirement Living11%Residential development2%Growth Capital22%Venture Capital6%Not disclosedJan-17Jun-17 Nov-17Share price (LHS)Avg prem/disc (RHS)
19 March 2018FundsListed Investment CompaniesLIC key metricsCompanyAustralian EquitiesAberdeen LeadersAFICAust Gov Masters Index FundsArgo InvAust United InvContrarian Value FundCentury Aust InvDjerriwarrh InvMilton CorpPlato Income MaximiserAMCILBKI Inv CoCarlton InvClime CapitalCBG Capital LimitedDiversified United InvFlagship InvPerpetual Inv CoQV EquitiesWAM LeadersWhitefieldMcap weighted averageSimple averageAcorn Capital Inv FundContango Income GeneratorMirrabooka InvOzgrowthWAM CapitalWAM ResearchWestoz Inv Co8Ip Emerging Companies LimitedNAOS Small Cap OpportunitiesGlennon Small CosMercantile Inv CoNAOS Absolute Opps CoNAOS Emerging Opps CoNGE CapitalSpheria Emerging CompaniesSandon Capital InvMcap weighted averageSimple averageASXcodeInvestmentfocusListingdateMcap ( Am)Lastprice APre-taxNTA SIPICQVEWLEWHFLarge CapLarge CapLarge CapLarge CapLarge CapLarge CapLarge CapLarge CapLarge CapLarge CapLarge/Medium CapLarge/Medium CapLarge/Medium CapLarge/Medium CapLarge/Medium CapLarge/Medium CapLarge/Medium CapLarge/Medium CapLarge/Medium CapLarge/Medium CapLarge/Medium GC1MVTNACNCCNGESECSNCMedium/Small CapMedium/Small CapMedium/Small CapMedium/Small CapMedium/Small CapMedium/Small CapMedium/Small CapSmall CapSmall CapSmall CapSmall CapSmall CapSmall CapSmall CapSmall CapSmall 340.632.080.99Pre-tax NTA3yr avgprem/disc ource: IRESS, Capital IQ, company data. Previous 12-month dividend yield. NTA as at 28/02/2018. Share price as at close 14/03/2018.Wilsons Investment StrategyPage 13Post-taxNTA 31.090.961.090.191.121.290.632.060.96DilutedNTA A1.09Diluteddiscount/premium-3%Optionse
for the month, with Telstra (-4.4%) still out of favour since reducing its dividend, and Vocus Group (-18.1%) hit hard following a downgrade to its FY18 guidance and the departure of CEO Geoff Horth. The energy sector (-3.8%) also came under pressure, with Whitehaven Coal (-8.9%) battling . MSCI World S&P/ASX 200 Small Ords S&P 500 STOXX .