Transcription
The Right to Vote protects all other rights“The right of voting for representatives is the primary right by whichother rights are protected. To take away this right is to reduce a man toslavery, for slavery consists in being subject to the will of another, andhe that has not a vote in the election of representatives is in this case.”- Thomas Paine, Dissertation on First Principles of Government
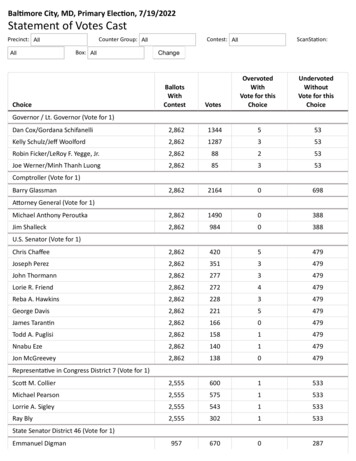
Historic Specific Partisan AsymmetryThis research was done by Colin McAuliffe. Thanks to Sam Wang et. al. of Princeton for the vote count data.Net nationalTotal nationalDems gerrymandering in 1970 and 1980, Repubs in 2010For the past 50 years, Gerrymandering has held constant at 25 seatsThat’s equivalent to stealing about 20 million votes!
Supreme Court dereliction onPartisan Gerrymandering 1986 - Davis v. Bandemer (Indiana) no action taken 2004 - Vieth v. Jubelirer (Pennsylvania) no action taken 2006 - LULAC v. Perry (Texas) no action taken 2018 - Gil v. Whitford (Wisconsin) delayed (filed in 2015) 2018 - Benishek v. Lamone (Maryland) delayed (filed in 2013) 2018 - Rucho v. Common Cause (North Carolina) delayed (filed in2016)
The Solution Part 1: Automated Redistricting Demonstration Part 2: A sound legal test of Gerrymandering Demonstration
Criteria in Map outCustom criteriaCustom criteriaCustom criteriaCustom criteria
Open Source SoftwareAll source code is licensed under “GNU-GPL 3.0” Explicitly grants permission to copy, modify, and distribute All distributions must include the source code All derivative works must inherit this license
Fitness criteriaGeometric Connectedness Compactness Equal population County splitsFairness Competitiveness Proportionality Partisan Gerrymandering Racial Gerrymandering
User-selected weights Normalized scores are then weighted by the user Shown by the sliders to the right Enables the user to prioritize criteria on-the-fly A master slider for geometry vs fairness criteria Criteria scores are then added together to get a grand total
The Genetic Algorithm: Steps1) Evaluate – score the fitness2) Select – pick high-scoring maps tocreate next generation from3) Recombine – randomly takegenes from each parent,exponentially approaches the bestsolution (the key driver of evolution)4) Mutate – adds variety
AutoRedistrict starts with large refinementsand gradually makes smaller refinements Only the perimeters of the districts are mutated Rate of mutation is reduced over time On an exponential schedule AutoRedistrict is “done” when refinements are negligibleonly genesat a borderare mutated
In short, it’s a search engine. AutoRedistrict explores almost all possible district arrangements On a typical desktop PC, it can evaluate hundreds of maps per second This outperforms any human being by orders of magnitude More evaluations better results
Man vs. MachineMachine Wins.
Man MachineBetter map
Automation adds Transparency
Automating AutoRedistrict AutoRedistrict records all user actions in a script Which can be played back Increases automation Increases transparency
Automating Automating AutoRedistrict An AutoRedistrict script can be launched from the command line –without a user interface (“headless”) So in turn you can write a shell script to script the running of scripts For example
POWERED BY
(Show software)
(Show website map)
The SolutionPart 2: A sound legal standard
How to win a gerrymandering lawsuitBased on my reading of judges' opinions and defendants' filings inSupreme Court cases, in order to prevail in court you need to establishthat: the districts are gerrymandered the gerrymandering is extreme and will continue to beI'm going to show you how to do that.
The Supreme Court asked for a sound way tomeasure Gerrymandering That avoids counterfactualsadjective relating to or expressing what has not happened or is not the case.noun a counterfactual conditional statementexample If kangaroos had no tails, they would topple over. And assesses durability Was the partisan bias by chance, or will it continue to occur?
“Specific Asymmetry” Probability model Avoids counterfactuals Assess durabilitySpecificasymmetryactualpopularvote
Specific Asymmetry
Generating seats-votes curve from 1 electionX (independent variable)Y (dependent variable)
Specific asymmetry “Specific asymmetry” is the vertical distance (# of seats) between theseats votes curve and its reflection, measured at the actual popularvote Avoids counterfactualsSpecificasymmetryactualpopularvote
Specific Asymmetry
Different measures of gerrymanderingEfficiency gapSteph. & McGheeMedian minus MeanSam Wang et. al.Assumes linearityMeasures at ahypothetical seat count(implicitly)Partisan SymmetryGrofman & KingMeasures at ahypothetical popular vote(50:50)Specific AsymmetryBaas & McAuliffeNo counterfactuals
Voter sentiment weighted coin When a random voter shows up at the polls, which way they vote canbe modeled by a flip of a weighted coin. The probability that a coin has any given weight is modelled by the“Beta distribution”, pictured below. So we use a Beta distribution to modelvoter sentiment.
Maximum Likelihood Estimation Maximum likelihood estimation (MLE) is a method of estimating theparameters of a statistical model so the observed data is mostprobable.
Probability model: 2-level Beta 1st level: The popular vote Beta distribution models the shared covariance among the districts 2nd level: The district Beta distributions then take individual districtdeviations from that An unbiased estimator is used to avoid overfitting Then just pull random samplesPacked districts
“Specific Asymmetry” Probability model Avoids counterfactuals Assess durabilitySpecificasymmetryactualpopularvote
Recap
Criteria in Map outCustom criteriaCustom criteriaCustom criteriaCustom criteria
“Specific Asymmetry” Probability model Avoids counterfactuals Assess durabilitySpecificasymmetryactualpopularvote
The Right to Vote protects all other rights“The right of voting for representatives is the primary right by whichother rights are protected. To take away this right is to reduce a man toslavery, for slavery consists in being subject to the will of another, andhe that has not a vote in the election of representatives is in this case.”- Thomas Paine, Dissertation on First Principles of Government
I want to get this out there. Contact me. Give demos of the software Explain the partisan gerrymandering metric Answer questions Generate maps for you Add new criteria into the softwareWebsite: autoredistrict.orgEmail: kbaas@autoredistrict.orgFacebook group: AutoRedistrictName: Kevin Baas
Thank you.Come visit my booth,I’d love to explain more.Questions? Comments?Website: autoredistrict.orgEmail: kbaas@autoredistrict.orgFacebook group: AutoRedistrictName: Kevin Baas
Extra slides
Potential improvements to AutoRedistrict Major refactoring Make criteria more modular and extensible KML export / google maps integration Shared public repo for source data and result data Plugin for ArcGIS (or QGIS)
Countering common legal argumentsCommon legal arguments: Outcome is due to changes in voter sentiment Outcome is a natural consequence of geography Etc.Solution: Make everything the same except district shapes.Since everything else is held constant, all differences in election outcomesmust be due to district shapes alone.TimesameSpacesameElectionssameDistrict shapesdifferent
Wisconsin Assembly before and after Gerrymanderingusing cross-aggregated vote countsre-aggregate tovoting ward resolution2000districtsde-aggregate toblock resolution2010districtsvoting ward resolution
Wisconsin Assembly, before and after GerrymanderingSeats-votes pictures
Wisconsin Assembly before and after GerrymanderingSpecific Asymmetry, Expected and ActualSpecificasymmetryactualpopularvote
Myths about automated redistricting Automated redistricting can be used for evil (not a myth) Yeah, and it is being used for evil, and that evil will flourish if we don’t fight back by using it for good You don’t need automated redistricting to gerrymander, self-sorting makes it trivial: just draw a circle aroundthe cities. Done. A computer can't decide the criteria for creating a district (not a myth) but it can create districts based on these criteria better than any human could do. Automated redistricting removes human input The results can be pre-processed and post-processed Different criteria and priorities can be chosen in advance and adjusted in real-time People can choose between a number of proposed/generated solutions Automated redistricting removes transparency Automated redistricting adds transparency You can read the source code – you can’t read a person’s mind An open-source license such as GNU-GPL protects against malicious code tampering You can record every action – you can’t read a person’s mind It’s repeatable / reproducible
Myths about automated redistricting (cont’d) Constitutional criteria must come first – automated redistricting can’t do that In mathematics and computer science we call this a “constraint”. Computers are really good atthem. It’s trivial to feed a computer user-supplied constraints A genetic algorithm can churn through user-supplied constraints like butter This includes “communities of interest” Compactness and other such measurements are subjective and a computer can’tmeasure them These are trivial to compute, not even hard not even average. If you can’t put it in a formula, you are being biased and that’s bad. Automated redistricting is deterministic – produces only one solution Heuristic optimization algorithms produce a different solution each time The computing power needed is unmanageable With today’s computing power, it can be done on a typical desktop computer The solution can start at a low resolution and go to progressively higher resolutions
Gerrymandering is getting more extremeIn 2010, Republicans gerrymandered theentire country, openly, and bragged about it“Republicans have an opportunity tocreate 20-25 new RepublicanCongressional Districts through theredistricting process over the nextfive election cycles, solidifying aRepublican House majority.”– redistrictingmajorityproject.com2010 gerrymanders were significantlymore extreme than all previous decades
Bayesian probabilityThe Frequentist is using a simple significance test:“P value” p(sun not exploded yes) (almost 1/36).that’s less than 0.05, so the sun has exploded.The Bayesian is using Bayes’ rule:p(a b) p(b a)*p(a)/p(b)a sun exploded, b machine says yesp(sun exploded yes) p(yes sun exploded) * p(sun exploded) / p(yes) (35/36) * (almost zero) / (almost 1/36) 35 * almost zero(35 times more likely than it was before the machine said yes)
The Beta Distribution After 5 flips of a coin, you get 4 heads and 1 tail. What’s thelikelihood that it’s a fair coin? Bayes’ Rule: p(fair 4h,1t) p(4h,1t fair) More generally: p(w x outcomes) p(outcomes w x) Draw out the full curve for every value of w That’s called the “Beta Distribution”
Bayesian probabilityFrequentistWe don’t know the exact outcome each time,but we know the probability distribution of theoutcomes. (e.g. 50% heads, 50% tails)Uses observations to estimate the single mostlikely parameters of a probability distribution.(e.g. mean and variance)BayesianNo, actually we don’t know that either. We canonly infer from the data that some distributionsare more likely than others. (e.g. we givedifferent likelihoods to each possible weight of acoin.)Uses observations to estimate a likelihood forALL possible parameters of a distribution.
Towards adoption - outreach Education / spreading awareness Political Action Committees Contacting representatives Academic publications News / Opinion (such as the NYT)
Towards adoption - action Lawsuits based on sound mathematics Ballot initiatives Individual municipalities reaching out
Partisan impacts of redistricting methods Used presidential vote counts from 6 elections Used the probability model Used all 50 states, so the results aren’t idiosyncratic to any state Used 4 different redistricting methods: Actual 2000 districtsActual 2010 districtsCompactness optimized districtsMulti-member districts Generated seats-votes picture for each
All congressional districtsSeats-votes likelihood picturesActual 2000 districtsActual 2010 districts
All congressional districtsSeats-votes likelihood picturesCompactness optimized (Bdistricting)Multi-member districts
Multi-member proportional districts, such asRanked Choice, are the solution Gives voters more expression Eliminates the need for party primaries Gives third parties a chance More proportionally represents minorities Produces a diagonal seats-votes curve(instead of sigmoidal) Eliminates gerrymandering
Visualizing the Genetic Algorithm The Genetic Algorithm is a probabilistic binary search through a veryhigh dimensional space, operating on each dimension in parallel Think about the negative space – the candidates that aren’t selected forrecombination. These are areas of the solution search space that are beingeliminated. Each “gene” is a dimension. So this elimination is happening in parallel on alldimensions (“genes” and even gene combinations) at once Since it’s a binary search, and thus eliminates areas of the searchspace exponentially, the mutation rate should drop exponentiallyover time (“annealing”) to confine the search space When the mutation rate is very small, it’s “complete”.
Tacit assumptions of the Genetic Algorithm Randomly combining two maps with good scores is more likely than not to be producea map with a better score than randomly combining two maps with bad scores. This is the underlying assumption of a genetic algorithm. If this is false, the algorithm can’t work. High score (or conversely low score) represents good fulfillment of the objective. A score can take on many different values. Time to calculate the score does not grow too fast with the size of the solution (in bits). In computer science, computation time is measured in what’s called “Big-O notation”. In Big -Onotation, we are concerned only with how the number of computations scale with the number ofdata points. “N” signifies the number of data points. For instance if we are sorting a 52-card deck,N 52. If to sort them, we have to compare every card to every other card, then the number ofcomputations is proportional to N*N. (aka N2) This would take too long to calculate for a geneticalgorithm to be practical. However, genetic algorithms only need an approximately correct scoring system to work, so theycan use shortcuts or heuristics instead of exact scores. And almost all problems admit linear-time(O(N)) heuristics.
Reading and writing shapefiles in Java Shapefiles are open data formats, thoroughly spec’d by ESRI Consequently, many open-source libraries exist for reading andwriting them in various programming languages, including librariespublished by ESRI To keep the code easy to maintain, I selected a very small and simplelibrary for reading the shapefile polygons Separately I found a very small and simple library for reading andwriting the .dbf (dbase) file that stores the tabular data.
Accidental Gerrymandering and Self-Sorting Geography is not a neutral criteria Democrats tend to concentrate in urban areas They are unintentionally “packing” their own votes, reducing the number of congressionalseats they can get Consequently, party-blind redistricting leads to systemic partisan bias “Unintentional Gerrymandering: Political Geography and Electoral Bias in Legislatures” Jowei Chen and Jonathan Rodden Driving blind is no way to avoid hitting pedestrians Without proper analytic tools and training, an independent commission can stillgerrymander – accidentally. A carpenter is only as good as their ruler Independent commissions are necessary but not sufficient.
The cost of Gerrymandering
Complications – Getting the data! There is no central national repository – or standardized format – for electionvote counts integrated with geospatial data. Each state publishes their own dataseparately. Florida mails you a CD because apparently they don’t have email?!? Some open source efforts exist, but the naming and formatting is not consistent enough forautomation In many states, district boundaries don’t follow voting ward boundaries, splittingvoting wards in half Just make equal population voting wards first,and then make the electoral districts out of the voting wards.(Wisconsin does this and it works great!) Many states will change their voting wards mid-decade Why?! Makes data analysis difficult You have to de-aggregate to census block level, then re-aggregate to the new (or old) districts
Probability of Map vs. Probability of OutcomeProbability of a map being equallygerrymandered or more given oneelection’s vote counts The random map generatingalgorithm implicitly pulls from aprobability distribution of mapsProbability of an outcome given themap and multiple election’s votecounts Doesn’t assume a probabilitydistribution of various maps Can’t extract probability densitiesabout the election outcomes for agiven map Can extract various probabilitydensity functions for the map Which is not explicitly stated And there is no empirical evidence for Doesn’t demonstrate durability of thegerrymander over multiple elections Fit a Bayesian prior distribution fromactual vote counts using the EmpiricalBayes Method Including durability over multipleelections
Aggregating the needed data This was way too much work! This should be compiled by the federalgovernment in a simple and consistent format! Initial shapefiles of voting tabulation districts from census.gov (4 states were not available, so had to use census tracks instead) Population and demographics from census.gov (block files .csv) (estimated) Ward-resolution presidential vote counts from StephenWolf of DailyKo’s google drive (Thanks to FairVote.org for referring meto this.)
History & Motivation A friend of mine become my state assembly person He posted something on social media about using independent redistrictingcommittees to end gerrymandering I thought to myself: that’s not a solution, you need to know how to optimize it forfairness, and for that what you need is an algorithm and a fast computer The algorithm was an interesting intellectual problem: optimizing multipleconflicting criteria at once, related to regions defined on a space, so I pondered it(I enjoy reasoning spatially) After I thought I had all the pieces solved, I wanted to see if it worked, so I builtwhat was in my head And because the software was unique and had a noble purpose, my motivationkept up to see it through to all the way (And yes it took a long time to write!)
Multi-objective heuristic optimizationThe Genetic Algorithm is part of a larger class of algorithms called“Multi-objective heuristic optimization”. These algorithms are notdeterministic. They are random.This class of algorithms is used to find good solutions to multiple goalsat once, when deterministic methods are not feasible. Other algorithms in this class include: Particle swarm optimizationAnt colony optimizationLearning classifier systemsSimulated annealingStochastic gradient descent
Multi-Member districts / Ranked Choice
Generating National Maps forFairVote.org Added option for multi-member with “Hare quota” to AutoRedistrict Added FairVote.org’s rules for seats per district (3/4/5) Recorded a script using AutoRedistrict’s instruction window Wrote a linux shell script to copy that script 50 times, changing thestate and seat counts Wrote a small script to run those 50 scripts Wrote php and javascript for the interactive map Wrote php scripts to aggregate the statistics of all 50 maps, and sentlinks to FairVote.org for analysis.
Interactive maps compiled from AutoRedistrictexported renderings and stats
NYT Maps – expanded house, multi-member
Transparency Due to the political nature of redistricting, I decided that I had tomake AutoRedistrict Free and Open Source. The code (and executable) is hosted on github. It’s licensed GNU-GPL 3. (“copy-lefted”) The shapefiles for the interactive map are published on my ftp site. The program records all actions in a script and you can play it back oruse the script on a different state. So even the settings and process istransparent. (and reusable!)
About myself Fully self-taught software developer (no college) I’ve been programming since I was a little kid Interested in artificial intelligence, simulation, and modeling Senior Systems Analyst in the Government sector I wrote AutoRedistrict in my spare time Eliminate gerrymandering Makes redistricting cheaper
Wisconsin Assembly, before and after Gerrymandering,Methodology Highlights Highest resolution available Equal number of elections aggregated forward and back (3 & 3) Same exact elections are used in both before and after picture Can’t argue that it’s caused by changes in voter sentiment over time,because they both cover the same time period Can’t argue that the gerrymandering is a natural consequence ofgeography, if it’s absent in the before picture
Gerrymandering is extreme
How gerrymandering worksPackedCrackedParty 1 has 60% of the votes and 1 seat0.90.8Party 1 has 60% of the votes and 2 strict 1District 2Party 1Party 20District 1District 2Party 1Party 2
Justice Delayed is Justice Denied - indefinitely 2012 election irreparable harm80% of the damage is already done 2014 election irreparable harm and when it hits 100%, 2016 election irreparable harmit repeats. 2018 election irreparable harm 2020 election only one election left, then the same people who gerrymandered last time will be able to gerrymander again, securing stolen seats for another 10 years, a new lawsuit is filed, and the cycle repeats.
Means of prevention Early identification (identify and contest gerrymandering before mapsare approved) Requires transparency And automated tools Clear (and mathematically sound) legal standards Automated redistricting tools to enforce them Good actors Independent commissions Oversight
Integrated analytics Maps Population density, partisan swing, demographics, etc. Per capita, per precinct, per district Charts Pie charts, seats-votes pictures, probability densities Tables By district, by party, by demographic, global statistics All exportable
*Prevention is much better than correctionPrevents a lot more harm Prevents irreparable harm to voters and the country each election bykeeping elections truly democratic Prevents irreparable harm to the world via policy (e.g. climatechange)Correction often simply isn’t an option Lawsuit is the only means, and defendants will use delay tactics andthe courts move very slowly and are hesitant to rule Many years and millions of dollars later, nothing
Gerrymandering determines the policies Takes the power to control the composition of congress away fromthe citizens - turns democracy into autocracy Determines who has control of congress Which determines the laws and policies, which affect the country You can’t impact what policies get implemented if you can’t impactthe composition of congress
Means of prevention Early identification (identify and contest gerrymandering before mapsare approved) Requires transparency And automated tools Clear (and mathematically sound) legal standards Automated redistricting tools to enforce them Good actors Independent commissions Oversight
The Genetic Algorithm: Steps1) Evaluate – score the fitness1.2) Normalize - map all scores intoa fixed and smooth range1.3) Weight – Adjust importance ofsub-scores2) Select – A few different methods,truncation is the simplestnormalizeweight
The Genetic Algorithm: Definitions The “Population” is the set of allmaps currently being evaluated Each “Chromosome” is a map The “Genes” are a list of whatdistrict each voting ward isassigned to (in the order that thevoting wards occur in the tabulardata) Ex. 1,5,3,1,2,6 .
Step 0: Initialization A random “seed” ward is chosen for each district Remaining districts are added via arandomized breadth-first flood fill All districts are flood-filled at the same time,with the lowest population district always taking the next fill iteration This results in Roughly equal population districtsThat are fairly compactAnd contiguousAnd yet are random Time to complete is proportional to number of voting wards (O(N))
Step 1: Computing the scores – The scores Dis-contiguity is a district’s total population, minus the populationthat’s not in the most highly populated region Compactness is a district’s area divided by it’s perimeter squared(“isoperimetric quotient”)01 Population inequality is total squared deviation from perfect equality Partisan gerrymandering is computed from the seats-votes curve andwill be explained later in this slideshow
Normalization - Why Smooths out sudden jumps in scores Prevents a single optimization from dominating Gives tough-to-optimize areas a boost Puts all criteria on the same scale e.g. population is in thousands,compactness is between 0 and 1 Equalizes their impact
Normalization - How “Rank normalization” is used For each criteria, order all maps from best to worst Replace their “score” with their place in that order Produces evenly spaced scoresevenlyspacedscoresunevenly spaced scores
Step 2: Selection “Truncation selection” is used Just select the top 50% or so (adjustable) This is the simplest selection method – there are others An adjustable amount of “Elitism” is included “Elitism” is where some of the “parents” survive for multiple generationsThis allows them to pass on more information to future generationsKeeps the gene pool closer to recently discovered optimaHas been shown to improve convergence
Step 3: Recombination Two parents are selected at random from the survivors “Uniform recombination” is done As opposed to “single point crossover” For each voting ward, one of the two parents is selected at random This can add discontinuities to the maps, but those are slowly weededout by selection pressure
So in turn you can write a shell script to script the running of scripts . Kevin Baas. Extra slides. Potential improvements to AutoRedistrict Major refactoring . voting ward resolution. Wisconsin Assemb