Transcription
3SOCIAL AND ECONOMIC INDICATORSBridget Robson, Donna Cormack, Fiona CramIntroductionIn Aotearoa/New Zealand and internationally there is increasing recognition ofthe role that various social, economic, environmental, and political factors play indetermining health experiences and outcomes for individuals and social groups(Howden-Chapman & Tobias 2000; Wilkinson & Marmot 2003). These factors includesuch determinants as income, employment status, housing, education, social position,and social exclusion. They can have both direct and indirect impacts on health, as wellas having interrelated and cumulative effects over lifetimes.In many countries there is evidence of a social gradient in health, with those in moreadvantaged positions enjoying generally better health and lower mortality (Wilkinson& Marmot 2003). In addition, there is growing acknowledgement that disparitiesin health between different ethnic groups are a consequence of inequalities in theway in which the determinants of health are distributed in society (Robson 2004). InAotearoa/New Zealand there is clear evidence of the differential distribution of social,environmental, economic, and political determinants of health for Màori and nonMàori.The right to health cannot be realised if structural inequities in the presence of social,economic, environmental and political determinants of health exist. This chapterfocuses on some social and economic indicators of health for Màori, includingeducation, employment and unemployment, income, housing, living standards,deprivation, justice, racism, and language. These indicators need to be understoodwithin the context of the underlying fundamental causes of the differential distributionof social and economic determinants by ethnicity in Aotearoa/New Zealand, namelycolonisation and racism.Education“Indigenous peoples have the right to establish and control their educationalsystems and institutions providing education in their own languages, in amanner appropriate to their cultural methods of teaching and learning.Indigenous individuals, particularly children, have the right to all levels andforms of education of the State without discrimination.” United NationsDeclaration on the Rights of Indigenous Peoples, Article 14 (UN 2007).Education is fundamental to the full development of human potential. Màoricommunities have made a major contribution to education in Aotearoa/New Zealandwith the development of the kohanga reo movement, kura kaupapa, wharekura andwànanga. Kaupapa Màori education has led to greater participation in education byMàori at all levels (Te Tàhuhu o te Màtauranga 2006). In addition, programmes such asTe Kotahitanga (Bishop et al 2003) have been developed to mitigate the inequitable21
Hauora: Māori Standards of Health IVteaching provided to Māori students for many decades (Alton-Lee 2003) and lift theteacher performance and engagement with Māori students. However, suchprogrammes are not yet widespread and recent statistics show that too many schoolsare still failing to provide high quality education to Māori children. In 2005 Māori secondary school students were more than twice as likely as nonMāori students to be granted an early-leaving exemption (13% compared to 5%),three times more likely to be suspended from school, and twice as likely to haveleft school by age 16 (Te Tāhuhu o te Mātauranga 2006). In 2005 49% of Māori secondary school students left school without an NCEAqualification, compared to 22% of non-Māori. Only 9% of Māori students leftschool with an NCEA qualification allowing them to enter university, comparedto 34% of non-Māori students (Ministry of Education 2007). Between 1997 and 2006 the number of kohanga reo decreased from 675 to 486and the number of children participating decreased from 13,000 to 9,500. 26,340Māori students (16%) and 3,000 non-Māori students were enrolled in Māorimedium schools in 2006, 17,000 receiving at least half the curriculum in te reoMāori (Ministry of Education 2007). In 2003 the age-standardised tertiary education participation rate for Māori was20.2%, higher than any other ethnic group. However, a large proportion of Māoristudents were studying at certificate level. Certificate level students carry a largerstudent loan debt five years after study, reflecting notably lower earnings. Māoriwith bachelors’ degrees or postgraduate qualifications also had notably higheraverage leaving loan balances than non-Māori (Te Tāhuhu o te Mātauranga2006).During the past 20 years educational qualifications have become an increasinglycritical determinant of employment and occupational status. University qualificationsnow confer a 62% lifelong privilege in earnings (Salmond 2003). The three wānanga, TeWānanga o Raukawa, Te Wānanga o Awanuiārangi and Te Wānanga o Aotearoa, havebeen critical in providing Māori controlled and Māori medium tertiary education andstaircasing Māori students to higher education. Nevertheless, failure of the schoolsystem to perform equitably for Māori transfers the cost of attaining an education ontoMāori. The lifetime cost of obtaining an education is thus disproportionately higher onaverage for Māori.Employment and unemployment“Everyone has the right to work, to free choice of employment, to just andfavourable conditions of work and protection against unemployment.” UniversalDeclaration of Human Rights, Article 23 (1) (UN 1948).The right to work underpins the realisation of other rights including the right tohousing, education, and a standard of living adequate for maintaining health andwellbeing (Human Rights Commission 2004). Occupational gradients in health have22
Social and Economic Indicatorsbeen well-described, with poorer health among those in unsafe, insecure, low-controland poorly paid jobs (Shaw et al 1999). Redundancy and unemployment are associatedwith poorer health outcomes (Keefe et al 2002; Blakely et al 2003). Māori workopportunities and work conditions were differentially impacted by economic andsocial policies of the 1980s and 1990s. The differential position of Māori in the labourmarket (i.e., both having a job or not and the type of job or occupation) accounted for asignificant proportion of the widening gaps in mortality rates between Māori and nonMāori during the 1980s and 1990s (Ministry of Health & University of Otago 2006). Unemployment rates for Māori have decreased from 13.0% in 2001 to 7.6% inJune 2007 but remain three times higher than that of Pākehā aged 15 years andover (2.6%), and similar to that of the Pacific population (7.8%) (Statistics NZ2007a; Department of Labour 2007). Youth unemployment is particularly high, with 21.4% of Māori aged 15–19 yearsunemployed in June 2007. This compares to 11.4% of Pākehā and 25.7% of Pacificyouth (Statistics NZ 2007b). There are differences in the occupational distribution of Māori and non-Māori. In2006 Māori were most likely to be employed in service industries (16.7%), and asplant/machine operators and assemblers (16.4%) (Department of Labour 2006). There is evidence that Māori face discrimination in the labour market – in gettinga job, in the type of job obtained, and the wages paid for a particular type of work(Sutherland and Alexander 2002; Alexander et al 2003).Income“Everyone has the right to a standard of living adequate for the health andwellbeing of himself and of his family.” Universal Declaration of Human Rights,Article 23(1) (UN 1948)There is well-established evidence of the relationship between income and health. Ingeneral, lower incomes are associated with higher morbidity and mortality for manyillnesses and injuries. In addition, among both Māori and non-Māori, death rates ofthose on high incomes declined more sharply in recent years than those of people withlow or middle incomes (Blakely et al 2007). The income gap between Māori and nonMāori remains substantial: The median annual income for Māori adults (those aged 15 years and over) in2006 was 20,900, compared with 24,400 for the total population. The medianannual income was 25,900 for Māori males and 17,800 for Māori females(Statistics New Zealand 2007a). The average weekly income (from all sources) for Māori was 471 for the June2005 quarter, compared with 637 for European/Pākehā, 412 for Pacific peoplesand 415 for Other ethnic groups (Statistics New Zealand 2005). According toStatistics New Zealand, this is in part reflective of differences in age structure.23
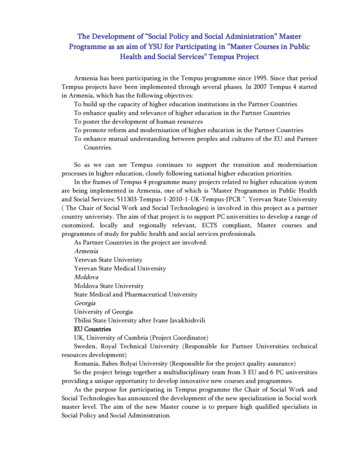
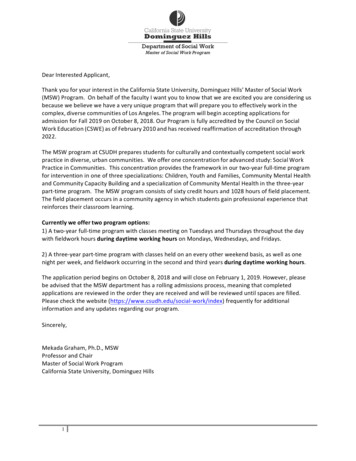
Hauora: Māori Standards of Health IV The average hourly rate of pay for Māori grew from 13.8 in 2000 to 17.3 in2006, while the total New Zealand wage grew from 15.6 to 20.0 (Department ofLabour 2006). While there is a gender pay gap in Aotearoa/New Zealand, theethnic pay gap is larger than the gender pay gap, with Māori womenexperiencing both an ethnic and gender pay gap (Ministry of Women’s Affairs2001). Māori were disproportionately represented in the lowest equivalised householdincome quintile (25% compared to 15% of European/Pākehā people) and underrepresented in the highest income quintile (12% of Māori compared to 24% ofEuropean/Pākehā) in 2004. Pacific and Other ethnic groups were also skewed tothe lowest income quintile (Perry 2007). The proportion of Māori children living in poverty (a household income below60% of the median, after housing costs) peaked at around 50% in 1994 thendeclined by 2004 but remains very high at 27% (compared to 16% of Europeanand 40% of Other ethnic groups) (Perry 2007).Living standards“States parties recognise the right of every child to a standard of living adequatefor the child’s physical, mental, spiritual, moral and social development.” UnitedNations Convention on the Rights of the Child, Article 27 (1) (UN 1989).In Aotearoa/New Zealand the Ministry of Social Development measures livingstandards of ‘economic family units’ through a national survey, using the EconomicLiving Standard Index (ELSI). This Index considers a range of indicators, includingincome, assets, access to amenities and services, activities and so on (Jensen et al 2006).Childhood hardship not only affects the health of the child, but also has long-termnegative impacts over the life course. The living standards of children are therefore ofparticular significance. Living standards for Māori in 2004 were significantly lower on average than forthe total population, a pattern also evident in the 2000 Living Standards Survey(Jensen et al 2006). Although there was little change overall in average living standards for Māoribetween 2000 and 2004, there was an increase in the proportion of Māoriexperiencing ‘severe hardship’ from 7% in 2000 to 17% in 2004. Forty percent ofMāori families and 19% of European families were living in hardship in 2004.Over half of Pacific families were living in some degree of hardship (58%) (Jensenet al 2006). Beneficiary families with dependent children were particularly vulnerable todepressed living standards, experiencing a fall in living standards between 2001and 2004 with 74% living in hardship by 2004 (Jensen et al 2006). In 2006, 93,423Māori children (45.9%) were living in families dependent on an income-testedbenefit compared to 29.6% of Pacific and 12.3% of Pākehā children (Wynd 2006).24
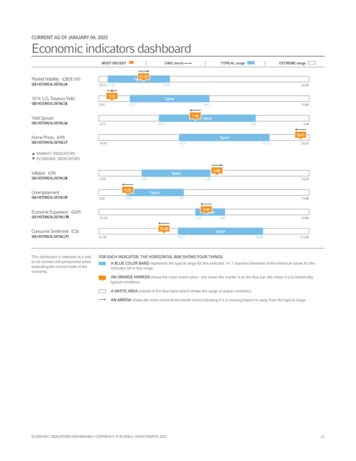
Social and Economic IndicatorsCurrent family assistance policies have a discriminatory impact disadvantaging Māorichildren. Children of beneficiaries are excluded from the “In Work Payment” thatreplaced the child tax credit in April 2006. Yet, due to economic policies that put moreMāori out of work in the 1980s and 1990s, an education system that continues to failMāori at an unacceptable rate, and a discriminatory job market and housing market, arelatively high proportion of Māori families require a benefit to survive (whether ACC,sickness, unemployment, domestic purposes or student allowance). Susan St John (inpress) identifies that social welfare policies designed to reward work rather thanalleviate child poverty have introduced “an unfortunate degree of discriminationagainst the non-working poor”. Māori children and their future wellbeing continue tobe most affected.Figure 3.1:Living standards distributions by ethnicity, 2004Population Severe hardshipSignificanthardshipSome hardshipFairlycomfortableComfortableGoodVery goodLiving standardsSource: Jensen et al 2006Housing“The International Covenant on Economic, Social and Cultural Rights (ICESCR)provides the most significant legal source of the right to adequate housing.Article 11(1) recognises the right of everyone to an adequate standard of livingfor himself and his family, including housing, and to the continuousimprovement of living conditions.” (Human Rights Commission 2004).Access to safe, secure and good quality housing is an important determinant of goodhealth (Howden-Chapman & Carroll 2004). Household crowding, poor dwellingconditions, and insecure tenure impacts on education, health and access to localservices (James 2007). There are significant differences in access to high quality housingfor Māori and non-Māori in Aotearoa/New Zealand.25
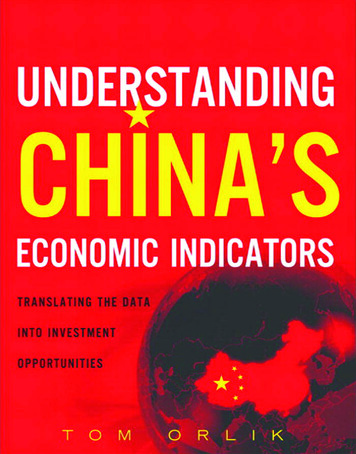
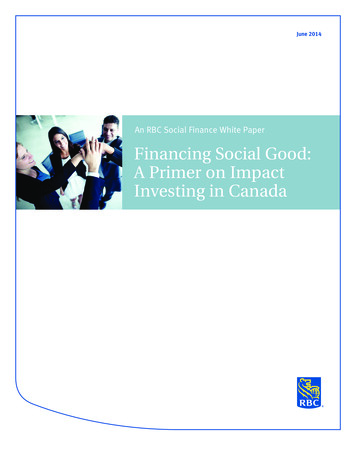
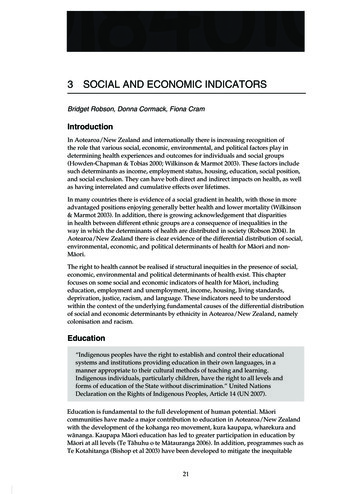
Hauora: Māori Standards of Health IV The Ministry of Women’s Affairs identified that Māori are more likely to be inrental or temporary accommodation, and to be living in crowded housingenvironments than non-Māori (Ministry of Women’s Affairs 2001). There was an increase in renting among all ethnic groups between 1991 and 2001.In 2001 over 50% of Māori households (households with one or more people ofMāori ethnicity) were renting, up from approximately 45% in 1991. Although thepercentage of European households renting increased from 28.9 in 1991 to 32.2 in2001, the proportion remains lower than for other ethnic groups including Māori(Statistics New Zealand 2002). In 2001, 31.7% of Māori owned or partly owned their home. This compared with59.7% of Europeans, 38.8% of Asians, 26.0% of Pacific peoples, and 24.2% ofOther ethnic groups (Statistics New Zealand 2002). Discrimination in renting or buying a house was the most frequent type of ‘unfairtreatment’ discrimination reported by Māori in the 2002/03 New Zealand HealthSurvey (Harris et al 2006a). Housing discrimination was significantly associatedwith a higher risk of smoking and poor mental health (Harris et al 2006b).Small area socioeconomic deprivationSmall area deprivation is one way of measuring socioeconomic position and has a clearassociation with mortality and morbidity in New Zealand. The NZDep index uses thepopulation census to measure area-based relative deprivation (see Appendix 1:Methods, for further discussion). It draws on nine variables from the five-yearlypopulation census to assign a deprivation score to each meshblock in Aotearoa/NewZealand, with 1 being the least deprived areas and 10 being the most deprived. In anequitable society, 10% of the Māori population and 10% of the non-Māori populationwould reside in each decile. There is a significant disparity in the distribution of deprivation inAotearoa/New Zealand. The proportion of Māori living in very deprived areas issignificantly higher for Māori than for non-Māori, with over half of the Māoripopulation represented in the most deprived deciles. This trend has changed little since 1996.26
Social and Economic IndicatorsFigure 3.2:Distribution of deprivation by ethnicity 910NZDep2001 decile(1 least deprived, 10 most deprived)Source: Ministry of HealthJustice“All are equal before the law and are entitled without any discrimination to equalprotection of the law.” Universal Declaration of Human Rights, Article 7 (UN1948).There is evidence of bias against Māori within the justice system in Aotearoa/NewZealand. Māori are more likely to be apprehended by the police than non-Māori at alevel not explained by self-reported offending (Fergusson et al 1993). A higher level ofpublic and police vigilance against Māori is likely to be a contributing factor,supported by evidence that young Māori are more likely to come to notice for lessserious offences than non-Māori (Maxwell et al 2004). Although Māori youth are arrested on average for less severe offences, they aremore frequently referred by the police to the Youth Court for minor offences,rather than directly for family group conference. This results in more seriousoutcomes for young Māori (Maxwell et al 2004). High arrest rates are likely to becontributing to Māori employment disadvantage (Hunter 2005). Māori offenders have higher rates of conviction than non-Māori offenders withsimilar offending history and socioeconomic background (Fergusson et al 2003). Differential access to legal information, legal advice and legal representationlimits Māori access to justice (Law Commission 2004). The Ministry of Justice forecasts an increase of 19% to 25% in the size of theimprisoned population (Wang 2006). This has serious implications for Māori27
Hauora: Māori Standards of Health IVfutures given the current extremely high incarceration rates for young Māori men– 2% for those aged 20–29 years in 2003 (Table 3.1). These high imprisonmentrates also mask the true unemployment rate for Māori men. Māori were at greater risk of being a victim of a crime in 2005 than other groups,particularly confrontational offences. Risk of victimisation was also associatedwith sole parenthood, being unemployed or on a benefit, living in rentedaccommodation, living in socioeconomically deprived areas, and being ofyounger age (15–29 years) (Mayhew & Reilly 2007).Table 3.1:Age(years)Sentenced male prisoners, 2003MāoriNumberNon-MāoriRate per 1,000 populationNumberRate per 1,000 populationRate 21.815.5250–59874.332271.084.0160 342.081000.365.79Source: Department of Corrections 2004Racism“States parties condemn racial discrimination and undertake to pursue by allappropriate means and without delay a policy of eliminating racialdiscrimination in all its forms and promoting understanding among all races.”International Convention on the Elimination of All Forms of RacialDiscrimination, Article 2 (UN 1965).Within New Zealand and internationally racism is recognised as an important socialdeterminant of health and inequalities (Jones 2001, Krieger 2003, Nazroo 2003,Williams 1997, Ministry of Health 2002). There are many forms of racial discriminationthat can affect health in different ways. In New Zealand there is direct evidence linkingself-reported experience of interpersonal racial discrimination to poorer healthoutcomes (Harris et al 2006b).Results from a national survey asked adults (15 years and older) about theirexperiences of racial discrimination in various settings (Harris et al 2006b). It showedthat Māori reported the highest prevalence of ‘ever’ experiencing racial discriminationcompared to other ethnic groups. 8.5% of Māori reported ‘ever’ being the victim of an ethnically motivatedphysical attack compared to 3.4% of Europeans. 24.5% of Māori reported ‘ever’being the victim of an ethnically motivated verbal attack compared to 10.3% ofEuropeans (Harris et al 2006a). Māori were more likely than Europeans to report ‘ever’ being treated unfairlybecause of their ethnicity by a health professional (4.5% versus 1.5%), at work28
Social and Economic Indicators(5.6% versus 2.1%) and when renting or buying a house (9.5% versus 0.7%)(Harris et al 2006a). Māori were almost ten times more likely to experience racial discrimination inthree or more settings than were European participants (4.5% versus 0.5%)(Harris et al 2006a). Overall, a third of Māori reported ‘ever’ experiencing any of the types of racialdiscrimination asked about in this study (Harris et al 2006a, Harris et al 2006b).Language“Indigenous peoples have the right to revitalize, use, develop and transmit tofuture generations their histories, languages, oral traditions, philosophies,writing systems and literature, and to designate and retain their own names forcommunities, places and persons.” United Nations Declaration on the Rights ofIndigenous Peoples, Article 13 (UN 2007). According to the 2006 Census, almost a quarter of Māori (23.8%) speak more thanone language (Statistics NZ 2007a). The 2006 Māori language survey shows an increase in proficiency among Māoriadults as well as increasing use of the Māori language. In 2006, 27% of Māoriadults reported speaking te reo Māori with some degree of proficiency and 43%reported listening proficiency (Te Puni Kōkiri 2007). There is a high degree of support among Māori adults for te reo Māori andsignificant increases in support from non-Māori, although non-Māoriparticipation in te reo increased only slightly between 2000 and 2006 (Te PuniKōkiri 2006).Tōku reo, tōku ohooho. Tōku reo, tōku māpihi maurea.ConclusionThe right of everyone to the enjoyment of the highest attainable standard of physicaland mental health encompasses the essential conditions of health, including the rightto be free from discrimination. Inequity in the distribution of social, economic,environmental, cultural and political resources must be addressed for the full potentialof Māori health to be realised.ReferencesAlexander WRJ, Genc M, Jaforullah M. 2003. Māori Disadvantage in the Labour Market. Dunedin:Department of Economics, University of Otago.Alton-Lee A. 2003. Quality Teaching for Diverse Students in Schooling: Best evidence synthesis.Wellington: Ministry of Education.Bishop R, Berryman M, Tiakiwai S, Richardson C. 2003. Te Kotahitanga: The experience of Year 9and 10 Māori students in mainstream classrooms. Report to the Ministry of Education. Hamilton:29
Hauora: Māori Standards of Health IVUniversity of Waikato. URL: http://www.minedu.govt.nz/goto/tekotahitanga. Accessed1 September 2007.Blakely T, Collings S, Atkinson J. 2003. Unemployment and suicide. Evidence for a causalassociation? Journal of Epidemiology and Community Health 57: 594–600.Blakely T, Tobias M, Atkinson J, Yeh L-C, Huang K. 2007. Tracking Disparity: Trends in ethnic andsocioeconomic inequalities in mortality, 1981–2004. Wellington: Ministry of Health.Department of Labour. 2006. Māori Labour Market Outcomes: October 2006. Wellington:Department of Labour. URL: utcomes.asp. Accessed 20 August 2007.Department of Labour. 2007. Māori Labour Market Factsheet – June 2007. Wellington: Departmentof Labour. URL: . Accessed 18September 2007.Fergusson DM, Horwood LJ, Lynskey MT. 1993. Ethnicity and bias in police contact statistics.Australian and New Zealand Journal of Criminology 26: 193–206.Fergusson DM, Swain-Campbell NR, Horwood LJ. 2003. Ethnicity and criminal convictions:Results of a 21-year longitudinal study. The Australian and New Zealand Journal of Criminology36(3): 354–367.Harris R, Tobias M, Jeffreys M, Waldegrave K, Karlsen S, Nazroo J. 2006a. Effects of selfreported racial discrimination and deprivation on Māori health and inequalities in NewZealand: cross-sectional study. The Lancet 367: 2005–2009.Harris R, Tobias M, Jeffreys M, Waldegrave K, Karlsen S, Nazroo J. 2006b. Racism and health:the relationship between experience of racial discrimination and health in New Zealand. SocialScience and Medicine 63(6): 1428–1441 [Epub].Howden-Chapman P, Carroll P (eds). 2004. Housing and Health: Research, policy and innovation.Wellington: Steele Roberts.Howden-Chapman P, Tobias M (eds). 2000. Social Inequalities in Health: New Zealand 1999.Wellington: Ministry of Health and Wellington School of Medicine.Human Rights Commission/Te Kahui Tika Tangata. 2004. Human Rights in New Zealand Today.Ngā Tika Tangata o te Motu. Wellington: Human Rights Commission.Hunter B. 2005. A historical analysis of socioeconomic outcomes for Indigenous Australians:Lessons for Māori. Presentation to New Zealand Treasury.URL: ls-hunter.pdf. Accessed 15 August2007.James B. 2007. Children’s and Young People’s Housing Experiences: Issues and scoping paper.Wellington: Centre for Housing Research, Aotearoa New Zealand (CHRANZ).Jensen J, Krishnan V, Hodgson R, Sathiyandra S, Templeton R, Jones D, Goldstein-Hawes R,Beyon P. 2006. New Zealand Living Standards 2004: Ngā āhuatanga noho o Aotearoa. Wellington:Centre for Social Research and Evaluation, Ministry of Social Development.Jones CP. 2001. Invited commentary: “Race,” racism and the practice of epidemiology. AmericanJournal of Epidemiology 154: 299–304.Keefe V, Reid P, Ormsby C, Robson B, Purdie G, Baxter J, Ngāti Kahungunu Iwi Incorporated.2002. Serious health events following involuntary job loss in New Zealand meat processingworkers. International Journal of Epidemiology 31: 1155–1161.30
Social and Economic IndicatorsKrieger N. 2003. Does racism harm health? Did child abuse exist before 1962? On explicitquestions, critical science, and current controversies: An ecosocial perspective. American Journalof Public Health 93: 194–199.Law Commission. 2004. Delivering Justice for All – A vision for New Zealand Courts and Tribunals.Wellington: Law Commission.Maxwell G, Kingi V, Robertson J, Morris A, Cunningham C. 2004. Achieving Effective Outcomes inYouth Justice: Final report. Wellington: Ministry of Social Development.Mayhew P, Reilly J. 2007. The New Zealand Crime and Safety Survey 2006: Key findings.Wellington: Ministry of Justice.Ministry of Education. 2007. Education statistics of New Zealand for 2006. Wellington: Ministry ofEducation.Ministry of Health and University of Otago. 2006. Decades of Disparity III: Ethnic andsocioeconomic inequalities in mortality, New Zealand 1981–1999. Wellington. Ministry of Health.Ministry of Health. 2002. Reducing Inequalities in Health. Wellington: Ministry of Health.Ministry of Women’s Affairs. 2001. Māori Women: mapping inequalities and pointing ways forward.Wellington: Ministry of Women’s Affairs.Nazroo J. 2003. The structuring of ethnic inequalities in health: economic position, racialdiscrimination and racism. American Journal of Public Health 93(2): 277–284.Perry B. 2007. Household Incomes in New Zealand: trends in indicators of inequality and hardship 1982to 2004. Wellington: Ministry of Social Development.Robson B. 2004. Economic Determinants of Māori Health and Disparities: a review for Te RōpūTohutohu i te Hauora Tūmatanui (Public Health Advisory Committee of the National HealthCommittee). Wellington: Te Rōpū Rangahau Hauora a Eru Pōmare, University of Otago.Salmond A. 2003. Speech to Conference of Social Policy Research and Evaluation. Wellington:SPEAR. www.msd.govt.nz.Shaw M, Dorling D, Gordon D, Davey Smith G. 1999. The Widening Gap: Health inequalities andpolicy in Britain. Bristol: The Policy Press.St John S (in press). Child poverty and family incomes policy in New Zealand. In K Dew,A Matheson (eds). Health Inequalities and Need in Aotearoa New Zealand. Dunedin: OtagoUniversity Press.Statistics New Zealand. 2002. Ethnic Groups: 2001 Census of Population and Dwellings. Wellington:Statistics New Zealand.Statistics New Zealand. 2005. New Zealand Income Survey: June 2005 Quarter. Wellington:Statistics New Zealand. URL: -incomesurvey-Jun05qtr-mr.htm. Accessed 7 August 2007.Statistics New Zealand. 2007a. QuickStats About Māori. Wellington: Statistics New Zealand.URL: maori-revised.htm. Accessed 7 August 2007.Statistics New Zealand. 2007b. Labour Market Statistics 2006. Wellington: Statistics New Zealand.URL: -market-statistics-06.htm. Accessed 7August 2007.Sutherland H, Alexander R. 2002. The Occupational Distribution of Māori 1997–2000. Dunedin:Department of Economics, University of Otago.Te Puni Kōkiri. 2006. Ngā Waiaro atu ki te Reo Māori. Attitudes towards the Māori language. FactSheet 27. Wellington: Te Puni Kōkiri.31
Hauora: Māori Standards of Health IVTe Puni Kōkiri. 2007. Te Tirohanga ki te Reo Māori. The Māori Language Survey. Wellington:Te Puni Kōkiri.Te Tāhuhu o te Mātauranga (Ministry of Education). 2006. Ngā Haeata Mātauranga: AnnualReport on Māori Education 2005. Wellington: Ministry of Education.UN. 1948. Universal Declaration of Human Rights. Geneva: United Nations.URL: http://www.un.org/Overview/rights.html. Accessed 5 September 2007.UN. 1965. International Convention on the Elimination of All Forms of Racial Discrimination. Geneva:United Nations. URL: http://www.ohchr.org/english/law/cerd.htm. Accessed 2 September2007.UN. 1989. United Nations Convention on the Rights of the Child. Geneva: United Nations.URL: http://www.cyf.govt.nz/text/432.htm. Accessed 7 September 2007.UN. 2007. United Nations Declaration on the Rights of Indigenous Peoples. Geneva: United Nations.URL: laration.htm. Accessed 25September 2007.Wang J. 2006. Justice Sector Prison Population Forecast 2006: Technical report. Wellington: Ministryof Justice.Wilkinson R, Marmot M (eds). 2003. The Solid Facts: social determinants of health (2nd ed).Copenhagen: World Health Organization.Williams DR. 1997. Race and health: basic questions, emerging directions. Annals of Epidemiology7(5): 322–33.Wynd D. 2006. Committed to Fairness and Opportunity? A brief analysis of the impact of the In WorkPayment on Māori and Pasifika families. Child Poverty Action Group Backgrounder 01/06.URL: 55.pdf. Accessed 3 September2007.32
economic, environmental and political determinants of health exist. This chapter focuses on some social and economic indicators of health for Màori, including education, employment and unemployment, income, housing, living standards, deprivation, justice, racism, and language