Transcription
Vehicle FiresMarty AhrensMarch 2020Copyright 2020 National Fire Protection Association (NFPA)
Key findingsAn estimated 212,500 vehicle fires caused 560 civilian deaths i1,500 civilian injuries; and 1.9 billion in direct property damage inthe US during 2018.In 2018, only fires in one- and two-family homes claimed more livesthan vehicle fires. Vehicle fires caused 4.5 times the number ofdeaths as nonresidential structure fires and 1.6 times the number ofapartment fire deaths.The leading causes of vehicle fires were mechanical failures ormalfunctions and electrical failures or malfunctions. Older vehiclesaccounted for three-quarters of the highway vehicle fires caused bymechanical or electrical failures or malfunctions. Maintenance isimportant throughout the vehicle’s years of use.Collisions were the leading cause of vehicle fires that resulted indeath.Most of this report focuses on highway vehicle fires. ii The vastmajority of vehicle fires and vehicle fire casualties involve highwayvehicles (vehicles intended for use on roadways).Large trucks have a higher rate of deaths per 1,000 fires thanhighway vehicle fires overall. Tires play a larger role in large truckand bus fires than in car fires.The 2018 estimate of highway vehicle fires was 60 percent lowerthan in 1980, and the rates of fires per billion miles driven and firedeaths per 100 billion miles driven were 81 percent and 65 percentlower, respectively.Additional information can be found in the supporting tables for thisreport.Four of every five people killed or injured in highway vehicle fires in2013–2017 were male. Almost half (44 percent) of the vehicle firefatalities were between 15 and 34. Only 10 percent were at least65 years of age.Highway vehicle fires were most common between 3:00 p.m. and6:00 p.m.iUnless otherwise specified, firefighter deaths and injuries are excluded from casualty statistics.The term highway vehicle fire is used to describe fires in which cars, trucks, motorcycles, buses, and other road vehicles burned, regardless of where the fireoccurred. However, if a vehicle inside a structure caught fire and spread to the structure or other contents, that fire would be considered a structure fire.iiNFPA Research pg. 1
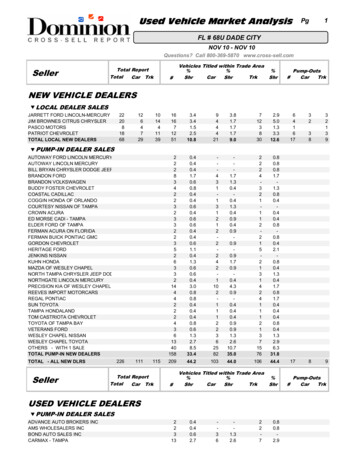
US fire departments responded to an estimated 212,500 vehicle firesin the United States during 2018. These fires caused an estimated560 civilian deaths; 1,500 civilian injuries; and 1.9 billion in directproperty damage. 1Vehicle fires accounted for 16 percent of the 1.3 million firesreported to US fire departments. Vehicle fires also caused 15 percentof all civilian fire deaths and 10 percent of all reported civilian fireinjuries.In 2018, only fires in one- and two-family homes claimed more livesthan vehicle fires. Vehicle fires caused 4.5 times the number ofdeaths as nonresidential structure fires and 1.6 times the number ofapartment fire deaths.Trends in highway vehicle use and firesDespite the increase in highway vehicles, miles driven, and vehicleage, highway vehicle fires are less common than in the past. Figure 1shows that the estimate of highway vehicle fires was 60 percentlower in 2018 than in 1980. Fewer than 200,000 such fires werereported annually in the past decade. In 2018, an estimated 181,500highway vehicle fires caused 490 deaths; 1,300 injuries; and 1.4 billion in direct property damage. The fire trend data in thissection is based on national estimates from the NFPA fire experiencesurvey as presented in NFPA’s Fire Loss in the United States series. 4Figure 1. Highway vehicle fires by year500 456in ThousandsThe big picture4594003002072001641821000Highway vehicles, such as cars, trucks, buses, motorcycles, andrecreational vehicles, accounted for the majority of vehicle fires. Theterm highway vehicle fire is used to describe fires in which roadvehicles burned, regardless of where the fire occurred, includinginside—if the fire did not spread from the vehicle to the structure.According to the National Highway Traffic Safety Administration’s(NHTSA’s) “Traffic Safety Facts 2017,” in that year, the US had225 million drivers with 290 million registered vehicles. 2Today’s vehicles are older than in the past. According to the FederalHighway Administration (FHWA), there were 223 million householdvehicles (as opposed to commercial vehicles) in the US in 2017, withan average of 1.9 vehicles and 1.9 licensed drivers per household. In1983, the average household vehicle was 7.6 years old, compared to10.3 years old in 2017. 3Because fire deaths are less common than fires, it is not surprisingthat death estimates are more volatile. Figure 2 shows that theestimated annual fire deaths had settled in the range of 260–310 formost of the past decade. However, estimates for 2015, 2017, and2018 were substantially higher. The 2018 estimate was the highestsince 2005.Figure 2. Highway vehicle fire deaths by year1000800800600 6504904002002600NFPA Research pg. 2
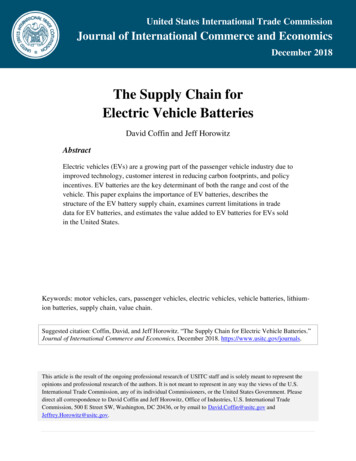
Figure 4. Highway vehicle fire deathsper 100 billion miles drivenThe number of miles driven by highway vehicles has more thandoubled from 1,527 billion in 1980 to 3,255 billion in 2018. 560Figure 3 shows that the number of vehicle fires per billion milesdriven has fallen 81 percent over the same period. The decline hasbeen fairly steady over time.35030025020015010050050 43403020Figure 3.Highway vehicle fires per billion miles driven15102990Fire Loss in the United States series, US Department of Transportation, FederalHighway Administration Office of Highway Policy Information.56Sources: NFPA’s Fire Loss in the United States series, US Department ofTransportation, Federal Highway Administration Office of Highway Policy Information.Figure 4 shows that even with the recent increases in highwayvehicle fire deaths, the fire death rate per 100 billion miles was still65 percent lower in 2018 than in 1980.The 2013–2017 estimates that follow were derived from NFPA’sannual fire department experience survey and the detailed data fromthe US Fire Administration’s (USFA’s) National Fire IncidentReporting System (NFIRS). At the time this analysis was done,NFIRS data for 2018 was not yet available.Patterns of highway vehicle firesThe 181,700 highway vehicle fires iii per year in 2013–2017 caused anaverage of 355 civilian deaths; 1,172 civilian injuries; and 1.3 billionin direct property damage. These fires accounted for 92 percent of allreported vehicle fires, 91 percent of vehicle fire deaths, 81 percent ofvehicle fire injuries, and 74 percent of vehicle fire dollar loss.Highway vehicle fires accounted for 14 percent of reported fires ofall types, 11 percent of fire deaths, 8 percent of fire injuries, and9 percent of total fire dollar loss. iv The remainder of this report willfocus on highway vehicle fires.Sources: NFP Fire Loss in the United States series, US Department of Transportation,Federal Highway Administration Office of Highway Policy Information. Sources: NFPA’siiiivIf a vehicle inside a structure caught fire and spread to the structure or other contents, that fire would be considered a structure fire.Percentages were calculated from the 2013–2017 total vehicle fire estimates derived from NFIRS and the NFPA fire experience survey.NFPA Research pg. 3
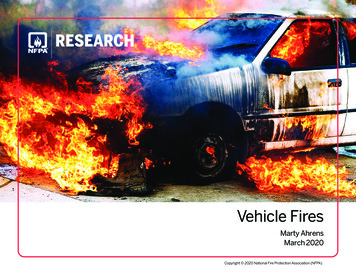
The victims of highway vehicle firesFour out of five fatal highway vehicle fire victims (79 percent) andthe non-fatally injured (80 percent) were male. This is somewhathigher than the 71 percent of all highway crash fatalities who weremale. 6Victims of fatal highway vehicle fires tend to be close in age tooverall crash victims. This is consistent with the fact that three ofevery five highway vehicle fire deaths resulted from fires caused bycollisions or overturns.Figure 5.Highway vehicle fire deaths and injuriesby age group: 2013–2017Under %9%4%2%2%1%85 and over0%5%10%15%20%When are highway vehicle fires most common?Highway vehicle fires were most common from May throughAugust, peaking in July. Vehicle fire deaths were more common infires on Saturdays and Sundays. According to NHTSA, Saturday wasthe peak day for fatal vehicle crashes in 2017, followed by Sundayand Friday. Eighteen percent of the fatal crashes on Sundaysoccurred between midnight and 3:00 a.m. This suggests acontinuation of Saturday night activities might have been a factor inSunday’s larger share of deaths.Highway vehicle fire times appear to correlate with the timesvehicles are in use. The smallest number of fires occurred between4:00 a.m. and 6:00 a.m. Fires increased steadily throughout the day,peaking between 3:00 p.m. and 6:00 p.m., likely due to rush hourtraffic. From that point forward, fires steadily decreased.21%17%Figure 5 shows that almost half (44 percent) of the vehicle firefatalities were between 15 and 34, compared to 38 percent of allcrash victims. 7 Only 10 percent of highway vehicle fire fatalities and18 percent of all crash victims were 65 years old or older.25%Only 9 percent of the highway vehicle fires occurred betweenmidnight and 3:00 a.m., but these hours accounted for 21 percent ofthe highway vehicle fire deaths. The 2017 “National HouseholdTravel Survey” (NHTS) collected information about the time of daypeople were on the road in vehicles. Only 2 percent of all trips beganbetween 1:00 a.m. and 6:00 a.m. 8 With fewer vehicles on the road,greater speeds are possible, resulting in higher impact collisions.Driver fatigue and impairment can also play a role in these postcollision fire deaths.Figure 6 shows that the time at which a highway vehicle fire occursvaries by the cause of the fire. Vehicle fires resulting from collision oroverturns peaked between 2:00 a.m. and 3:00 a.m. However, theNFPA Research pg. 4
variation by time of day was smaller and less consistent with firescaused by mechanical or electrical failures. Fires resulting frommechanical or electrical failures or malfunctions began increasing infrequency during the morning commute and peaked between 2:00 p.m.and 6:00 p.m. NHTS found that 86 percent of trips started between thehours of 6:00 a.m. and 7:00 p.m. These fires were more common whenmore vehicles are on the road. 9Figure 6.Highway vehicle fires by major cause and alarmtime 2013–20178%7%7%7%6%5%5%5%4%3%4%3% 2%2%1%4%3%5%3%1%Mechanical or electrical failure or malfunctionCollision, overturn, or run over0%Fire causes and circumstancesThe leading causes of vehicle fires varied based on the type ofvehicle and whether fires or fire deaths were being considered. Thissection will focus on the causes and circumstances of all types ofhighway vehicle fires, and, more specifically, car fires, car firedeaths, large truck fires, and bus fires (including school buses). The 117,400 car fires (65 percent of highway vehicle fires)per year caused an average of 230 fire deaths (65 percent),694 fire injuries (59 percent), and 557 million in directproperty damage (44 percent) annually in 2013–2017. The 12,600 large truck fires per year (6 percent) caused anaverage of 33 fire deaths (9 percent), 102 injuries (7 percent),and 281 million in direct property damage (16 percent). Thelarge truck category includes semi-trailers with or withouttractors, general use trucks, dump trucks, fire apparatus, garbagetrucks, and tank trucks.The 1,550 bus fires per year (1 percent) caused an average of11 injuries (1 percent) and 28 million in direct propertydamage (2 percent) annually. Because participation in NFIRSis voluntary at the federal level, estimates of rare events, suchas fatal bus fires, might be artificially inflated when such adeath is reported, or it might underestimate the problem whensuch fires are not reported. Although no bus fire deaths werereported to NFIRS during this time period, seven passengersdied of asphyxiation and burns as a result of an April 2014California fire that started after a bus was hit by a tractortrailer. 10 A school bus driver and a 16-year-old student died inan Iowa fire in December 2017. 11 These fires will bediscussed in more detail later in the report.Figure 7 shows that roughly three-quarters of the highway vehiclefires occurred on some type of highway, street, or parking area.While highways or divided highways were the most commonlocations for these events, the percentage of car fire deaths and largetruck fires that occurred on these properties was approximately twicethat of car and bus fires.In addition, 4 percent of bus fires occurred on educational propertiesand 3 percent occurred on public assembly properties, includingpassenger terminals and places of worship. In some cases, firedepartments might have listed the location or property use as themain occupancy when the fire actually occurred in a parking lot ordriveway.NFPA Research pg. 5
Figure 8.Highway vehicle fires by leading area of origin2013–2017Figure 7.Highway vehicle fires by property usewhere the fire occurred: 2013–201722%21%Highway or divided highway23%Residential street, road, orresidential driveway9%Vehicle parking %21%16%9%6%6%6%11%Street or road in commercial areaEngine area, runninggear, or wheel areaAll highway vehicle firesCar firesCar fire deathsLarge truck firesBus fires6%8%10%5%12%Unclassified street6%1%6%6%4%Mercantile or business4%3%6%3%2%Open land, beach, or campsite0%20%40%35%Passenger or operatorarea11%13%22%6%10%Unclassified vehicle area9%8%22%10%9%Cargo or trunk area5%4%2%12%1%Exterior or exposedvehicle surface3%3%1%8%3%Unclassified area oforigin2%2%1%2%Fuel tank or fuel line2%2%12%1%0%63%66%55%69%All highway vehicle firesCar firesCar fire deathsLarge truck firesBus fires33%60%0%Figure 8 shows that fires most commonly began in the engine area,running gear, or wheel area. However, a disproportionate share of thecar fire deaths resulted from fires that started around the fuel tank orfuel line or in the passenger area.In an SP Technical Research Institute of Sweden pre-study of postcollision fires, Ochoterena, et al., noted that real situation tests showedthat fire spreads faster when an engine has been running, and the type ofcrash can affect the fire spread. Vehicle components that were mostcritical to fire safety included the fuel system and tank and passengerarea items such as the seats, inner roof, dashboard, and door covers. The50%100%materials in vehicle seats were identified as the greatest potential sourceof toxic compounds.Figure 9 shows that mechanical failures or malfunctions were theleading factors in all types of vehicle fires, followed by electricalfailures or malfunctions. These fires were much less likely to befatal than fires resulting from collisions.Almost two-thirds of car fire deaths resulted from fires caused bycollisions or related events. In addition, 79 percent of the deaths fromlarge truck fires were caused by collisions. As noted earlier, aNFPA Research pg. 6
Consequently, it is not surprising that vehicles that are at least10 years old are at greater risk of a fire started by a mechanical orelectrical failure or malfunction.disproportionate share of car fire deaths and large truck firesoccurred on highways or divided highways, suggesting a linkbetween fires and high-speed impacts.Figure 9.Highway vehicle firesby major causal factors, 2013–2017Mechanical failure or malfunctionElectrical failure or malfunction47%45%7%7%8%12%2%3%Exposure fire6%6%2%4%4%Collision, overturn, or run over4%5%3%1%6%4%2%All highway vehicle firesCar firesCar fire deathsLarge truck firesBus fires0%63%20%Collision, overturn, or run overMechanical or electrical failure0%Highway vehicle fires were more likely to begin with the ignition ofelectrical wire or cable insulation than any other specific item.2%2%1%1%1%Smoking materialsFigure 10. Model year of highway vehicle firesin re 10 shows that roughly three-quarters of the highway vehiclefires reported in the US in 2017 that were caused by mechanical orelectrical failures (77 percent) involved cars with model years of 2007or earlier. This was true for only 54 percent of the fires resulting fromcollisions or overturns. As vehicles age, parts wear out, extendedmaintenance plans expire, and maintenance can be overlooked.Roughly two-thirds of the car fire deaths specifically and highwayvehicle fire deaths overall in the US during 2013–2017 resulted fromfires that began with a flammable or combustible liquid or gas.Gasoline was first ignited in more than half of all the highwayvehicle fire deaths. Ochoterena, et al., noted that the item that firstignited and the subsequent fuels are important components of firescenarios.Figure 11 shows that large truck fires were more likely to begin withthe ignition of a tire than other items. Tire ignitions were also morecommon in bus fires than car fires.NFPA Research pg. 7
switch, which is already required in cars, should also be required inlarge trucks.Figure 11.Highway vehicle firesby leading item first ignited, 2013–2017Electrical wire orcable insulation28%31%1%15%33%26%28%Flammable orcombustible liquid,gas filter or piping68%16%21%Unclassified item firstignited9%All vehicle firesCar fires7%8%12%4%5%Multiple items firstignitedAccording to data collected by the National Highway Traffic SafetyAdministration, fire occurred in 3 percent of the vehicles involved infatal traffic crashes in the US. 13 As in the Kentucky research, fireswere more common in fatal large truck crashes (6 percent) than inother vehicle crashes.17%15%15%19%Car fire deathsLarge truck firesBus firesLarge truck and bus fires5%6%2%1%2%Upholstered furnitureor vehicle seat6%3%3%Tire12%0%The Kentucky study also found that fire in any type of vehicle wasmore likely in single vehicle and head-on crashes. This wasespecially true for large trucks. Drivers of vehicles that caught firepost-collision were less likely to have been wearing seat belts. Suchdrivers would seem to pay less attention to safety. Crashes thatcaused fires were more likely to result in death or severe injury thanother crashes. Older vehicles were also more likely to catch fire.20%While large truck fires caused an average of only 33 of the 355highway vehicle fire deaths per year in 2013–2017 (9 percent), thelarge truck fire death rate of 2.7 deaths per 1,000 fires was 36 percenthigher than the 2.0 deaths per 1,000 highway vehicle fires of alltypes.30%40%60%80%Bunn, Slavova, and Robertson reviewed data about post-collision firesthat occurred on Kentucky highways with speed limits of at least55 miles per hour. 12 Large trucks accounted for 14 percent of the postcrash fires but only 8 percent of the crashes with no fire. Drivers inlarge truck post-crash fires were more likely to have been fatigued orasleep than drivers in non-fire crashes. The greater weight of largetrucks results in more impact force. These trucks also have much largerfuel tanks. The authors recommended that an automatic inertia fuelAs mentioned previously, no bus fire deaths were reported to NFIRSin the US during 2013–2017, although some did occur. Because ofthe number of passengers, the potential for many deaths from a busfire is higher than for other road vehicles. Evacuation from a bus fireis often difficult, particularly if the main entrance has been damaged.Tires and collisions were both common factors in the fatal bus firesnarratives that follow.In his 2016 report on truck, trailer, and bus fires, Peter Hartidentified five potential causes of truck trailer and bus fires:electrical, turbocharger and exhaust systems, hot brakes and wheelNFPA Research pg. 8
bearings, tires, and road debris. 14 He noted that flat or underinflatedtruck tires can catch fire, as can tires that rub against hard surfaces.Brake and wheel bearing failures can also cause tire ignitions. Tirescan be the cause of a fire, a fuel, or both. Figure 11 shows that tireswere the item first ignited in 30 percent of large truck fires and12 percent of bus fires.The deadliest US bus fire in this century occurred in Wilmer, Texas,on September 23, 2005 during the evacuation before Hurricane Rita.The accident killed 23 passengers from an assisted living/nursinghome complex. Two additional passengers were seriously injured. Intheir investigation, the National Transportation Safety Board (NTSB)learned that the bus was carrying 44 residents and nursing staff. 15Another motorist alerted the bus driver that the right rear tire hubwas glowing red. The driver and nursing staff got out of the vehicleand saw flames coming from the right rear wheel well. Passers-byassisted them with the evacuation of the bus. Insufficient lubricationin the right tax axle wheel bearing assembly was indicated as theprobable cause. This led to higher temperatures, failure of the wheelbearings, tire ignition, and deadly fire. Other contributing factorsincluded a lack of maintenance, pre-and post-trip inspections, andfire-retardant construction in the wheel well area. Investigators alsolearned that it had taken between 1½ to 2 hours to get the residentsonboard the bus. Cognitive and mobility impairments were amongthe factors that hindered the evacuation.The National Institute of Standards and Technology (NIST) studiedthe growth of a bus tire fire that could be caused by failed bearings,locked brakes, or dragged blown tires. In the experiment, conditionsreached tenability limits in the fire area within eight minutes of firepenetration in the passenger compartment and in the wholecompartment within 11 minutes. 16In April 2014, a tractor pulling two 28-foot trailers on a Californiahighway left the travel lanes and crossed the median, where it strucka car. The car spun around and off the highway. The truck thencollided with a bus containing 42 high school students and threeadult chaperones. The resulting fire destroyed the tractor, large partsof the trailer, and the interior of the bus. The truck driver died ofasphyxiation. The bus driver, although severely burned, died of bluntforce trauma. Six passengers died from asphyxiation, one passengerwas fatally burned, and one died of blunt force trauma. Ten seriouslyinjured passengers suffered both fire injuries and injuries from thecollision or exit process. The NTSB made several additionalobservations as part of their report: 17 The emergency exit windows were roughly seven feet above theground. The height was challenging, and passengers haddifficulty keeping the windows open.The collision was almost head-on, creating a large hole in thefront of the bus and rupturing the right fuel tank of the tractor.This allowed fuel to get inside the bus. The interior of the busfilled with smoke very quickly.Burning diesel fuel, tires, and material in the front of the bus,rather than the interior materials, created the untenableconditions. FMVSS 302, the current flammability standard forhighway vehicle interiors, was designed to protect against smallignition sources, such as matches, lighters, and smokingmaterials, not the more frequent bus fire scenarios. Modernvehicles have greater crash survivability.Forty-three people died after a truck crashed into a bus in France anda fire erupted. 18 The driver of the truck, which was pulling an emptywood trailer, lost control of the vehicle when navigating a tight bendon a French road on October 23, 2015. His vehicle jackknifed andcrashed into a bus heading in the opposite direction, crushing one ofthe bus’s fuel tanks and damaging the tractor unit’s added tank. Afire erupted between the truck and the bus almost immediately.NFPA Research pg. 9
Interior materials in the bus caught fire, resulting in toxic smoke. Thesmoke extraction vents were never opened.fuel tanks, and encouraged the development of a brochure aboutemergency evacuation and what to do in the event of a fire.Forty-nine people were on the bus, including members of an olderadult club on an excursion and their tour leader. After the crash, thelights on the bus went out. The driver used the manual emergencysystem to open the front door, exited, and opened the central doorfrom outside. Only one passenger escaped out the front door. Sixevacuated through a side door. The stairs were narrow and steep,posing challenges for those with limited mobility. The impact alsodamaged a safety barrier, partially obstructing the stairwell. Apassenger broke a window by that door with an emergency hammerto create an escape hole, out of which one person escaped. Forty-onepassengers died, as did the truck driver and his passenger.Rakovic, Försth, and Brandt reviewed the data on commercial busfires in Sweden in 2005–2013. 19 They found that 61 percent of thecommercial bus fires started in the engine compartment, 20 percentbegan in the wheel well, 5 percent started inside the bus or other area,and 14 percent began in an unknown location. Figure 8 shows thatthis is fairly consistent with the 69 percent of US bus fires that beganin the engine area, running gear, or wheel area, and the 10 percent thatstarted in the passenger or operator area.Investigators believe that the truck driver was traveling at anexcessive speed for the location. The tractor also had an unapprovedfuel tank installed in the back of its cabin.Investigators recommended that vehicle manufactures do thefollowing: Inspect any added fuel tanks after installation.Use materials that are more fire-resistant and less toxic if burned.Make smoke extraction devices easier to use.Add emergency exit doors at the rear of coaches. If this is notpossible, make emergency exits more accessible and easier touse.Reinforce legislation on emergency lighting systems to ensurethat emergency exits and equipment remain visible.Investigators also encouraged authorities to consider reducing thespeed limit at the crash site, suggested large truck driver unionscommunicate the importance of following the rules for additionalElectric vehicle firesWhile hybrid and electric vehicles have become more common,existing data collection systems have not yet adequately captured thefrequency of fires involving these specific vehicles.In a recently published Fire Technology invited paper, Sun,Bisschop, Niu, and Huang provided a comprehensive overview ofbattery fires in electric vehicles. 20 Most fire incidents involvingbattery electric vehicles or plug-in hybrid electric vehicles began inthe battery power system. The battery system could, in terms ofpropulsion, be compared to gasoline capacity in internal combustionengine vehicles (ICEVs). Electric vehicle (EV) fire risk increaseswith more batteries and with batteries containing more energy.In addition to trauma from impact, batteries can be stressed bytemperature extremes and fluctuations, heavy rain, overcharging, orcharging too quickly. Manufacturing and design issues can also play arole.As manufacturers increase the range of EVs by adding morelithium-ion batteries (LIBs), the potential heat that could bereleased in a fire grows.NFPA Research pg. 10
EV fires can occur:NHTSA regulates vehicles1. When a vehicle is stationary. Extreme temperatures, highhumidity, internal cell failure, and abuse of a LIB at some priortime can all cause such fires.2. When the EV is charging due to overcharging or problems withthe charging stations or cables.3. After a traffic crash or other abuse does sufficient damage tocause ignition during or immediately after the crash.4. When an LIB reignites after an initial fire has been handled.5. Due to external factors, such as arson or other fires (wildland,structure, or other vehicles) nearby.Occasionally, defects in the manufacturing process cause firehazards. Consumers can enter their Vehicle Identification Number(VIN) at nhtsa.gov/recalls to learn of any safety recalls. Consumerscan report safety-related complaints at https://wwwodi.nhtsa.dot.gov/VehicleComplaint/ or search complaints athttps://www.nhtsa.gov/recalls#vehicle.It takes some time for enough energy to accumulate to triggerthermal runaway in a battery. This makes them different fromICEVs, which can be quickly ignited by a spark or flame. Firedevelopment in a LIB battery pack might not be obvious in the earlystages. The authors recommend fire detection and extinguishingsystems to prevent such scenarios.Mechanical and electrical fires, the most common fires in ICEVs,become more common as the vehicles age. EVs have not yet reachedthe ages where these conditions are more commonly seen.Plans must be made and procedures established to protect theenvironment and those involved in the collection of batteries duringthe disposal stages. The risk of fire increases when battery packsaccumulate, as is likely during the disposal process.The authors also noted the challenges faced by the fire service whenfighting fires in these vehicles. Consumers reporting fires in thesevehicles are advised to indicate if a vehicle is electric or hybrid whenreporting them.MethodologySupporting tables for the information found in this report areavailable here. Vehicle fires were identified by NFIRS incident typecodes 130–139. The NFIRS Mobile property data element was usedto classify vehicles by type, regardless of the vehicle fire incidenttype. Highway vehicles were identified by mobile property codes10–29. Cars were identified by mobile property 11, buses by mobileproperty 12, and large trucks by mobile property 21 and 23–27.Unknown data, except for the incident type and property use, wereallocated proportionally for each data element. Major causal factorswere pulled from several NFIRS data elements, including factorscontributing to ignition, heat sources, and causes of ignition. Doublecounting can occur. Reports of fires from departments providingmutual aid were excluded from the analysis.National estimates are projections. Casualty and loss projections canbe heavily influenced by the inclusion or exclusion of one unusuallyserious fire. Percentages were calculated on the actual estimates, sotwo fig
vehicle fire deaths, the fire death rate per 100 billion miles was still 65 percent lower in 2018 than in 1980. The 2013–2017 estimates that follow were derived from NFPA’s annual fire department experience survey and the detailed data from the US Fire Administration’s (USFA’s) National