Transcription
Where do calories come fromin your diet?Lesson ThreeOverviewStudents examine food labels, calculate the percentage of calories from macromolecules(protein, fat, and carbohydrates), and determine durations of physical activity required forbalancing calories consumed and calories burned. Students will also consider factors thatcontribute to a balanced diet for people with, and without, type 2 diabetes.Enduring understandings: Type 2 diabetes can be prevented: factors contributing to a person’s risk include goodnutrition and exercise. In is important to balance energy consumed with energy burned, as well as knowing therelative value of the calories consumed.Essential question:Where do calories come from in your diet and what does this have to do with type 2diabetes?Learning objectivesStudents will be able to: Calculate from food labels the percentage of calories derived from fat, carbohydratesand proteins in that food. Display the relative caloric percentages on a graph. Use on-line tools to analyze food labels and quantify exercise.Prerequisite KnowledgePrior understanding of macromolecules such as carbohydrates, proteins, and fats ishelpful, but not necessary.Time: One 50-minute periodThis lesson connects to the Next Generation Science Standards in the following ways:Performance ExpectationHS LS2-4 Use mathematical representations to support claims for the cycling of matter and flow of energy.This lesson highlights the Practices of Using Mathematics, Information, and Computer Technology, andComputational Thinking, and the Crosscutting Concepts of Scale, Proportion and Quantity. 2014 University of Washington. All rights reserved.Non-commercial, educational use only39Genes, the Environment, and Mehttps://gsoutreach.gs.washington.edu/
TeacherTeacherPagesLesson Three: Where do calories come from in your diet?MaterialsMaterialsTeacher Copy Master of blank bar graphsComputers for students with access to: SuperTracker: www.supertracker.usda.gov/foodapedia.aspx Activity Calculator: ten-up-and-get-movingA variety of food labels, including nutritional contentQuantity1 per classCalculator1 per studentTape or glue1 per groupGreen, red, and purple markersStudent Resource Part A: Calculating food labels (can be copied back toback with Part B)Student Resource Part B: Calculating physical activity1 each per studentStudent Sheet 3: Balancing calories and exercise1 per student1 per student or group4 per student1 per group1 per groupLesson Background and Preparation This lesson requires having a selection of food labels with nutritional information onhand for students to use. Ask students to bring in food labels from home, provide thelabels for them, or make sure students have access to on-line nutritional information,such as through www.SuperTracker.usda.gov. This lesson focuses on the caloric contribution of different macromolecules in foodand asks students to consider how much physical activity is needed to balance thecaloric intake. If students haven’t already learned about macromolecules in previousunits, teachers may wish to teach about fats, proteins and carbohydrates, and theircontributions to diet, role in the body, and how these macromolecules are stored.While helpful for the lesson, prior information about macromolecules is not crucial. While the balancing of “calories in calories out” is a useful concept for students, it ishelpful for students to know that not all calories are created equally. For example,140 calories from a handful of nuts will digest slowly due to the fiber content, provideprotein, and contribute to a feeling of fullness. 140 calories from a 12-oz can ofsugared soda will dump 39 g of sugar into the blood stream without providing fiber orprotein.Presenting the LessonRemind students of the prior lesson which focused on carbohydrates. Tell students thatcarbohydrates are one type of macromolecule used by the body for fuel. Fats andproteins are also macromolecules that make up our food. 2014 University of Washington. All rights reserved.Non-commercial, educational use only40Genes, the Environment, and Mehttps://gsoutreach.gs.washington.edu/
TeacherTeacherPagesLesson Three: Where do calories come from in your diet?ProceduresPart 1 (Engage and Explain):Calories and Exercise(10 minutes)Part A1. Show students the collection of labels or food containers to be used in this lesson.Ask students, “How can you tell what ingredients, nutrients and macromoleculesfoods contain?” or “How can you tell which foods are healthiest?”2. Pass out Student Resource Part A: Calculating Food Labels. This may be photocopiedwith Part B: Calculating Exercise on the back and reused from class to classes.3. Tell students that they will be assessing the nutritional labels from different foods,and calculating the total number of calories from fats, carbohydrates, and proteins.They will then figure out how much physical activity is needed to balance the caloricintake from different foods.4. Using the Student Resource as a guide, demonstrate for students how to convert thenumber of grams of fats, carbohydrates and proteins from a food label into calories.Grams of Fat x 9 cal/gram calories from fatGrams of Carbohydrate x 4 cal/gram calories from carbohydratesGrams of Protein x 4 cal/gramcalories from proteins Total Calories:5. Next, demonstrate for students how to find the relative percentage of calories thatcome from either fat, carbohydrates, or protein for that food.Number of [fat] caloriesTotal caloriesx 100 percent calories from [fat]100%6. Lastly, show students how to graphically represent the relativepercentages of calories using the bar graph. Make sure that studentsknow to use green for fat, red for carbohydrates and purple for protein.Part B7. Ask students, “How would you find out how many calories are in aMcDonald’s grilled chicken sandwich vs a McDonald’s Big Mac?8. Using Student Resource Part B: Calculating Exercise,demonstrate for students how to find the calories of eachsandwich using the USDA’s Food-A-Pedia section of theSuperTracker website (www.supertracker.usda.gov), asexplained on the Student Resource.0%Food-A-Pedia is useful forlooking up nutritional values offoods that do not comepackaged, such as fruits andvegetables. Encouragestudents to research thesefoods, too.9. Next, demonstrate the Activity Calculator ighten-up-and-get-moving. 2014 University of Washington. All rights reserved.Non-commercial, educational use only41Genes, the Environment, and Mehttps://gsoutreach.gs.washington.edu/
TeacherLesson Three: Where do calories come from in your diet?TeacherPagesNote: Using the Activity Calculator, students may notice that a heavier person burnsmore calories than does a lighter person doing the same activity for the same amountof time. This is due to differences in basal metabolic rates, or the number of caloriesrequired to sustain cellular respiration and bodily functions of a person when at rest.A heavier person requires more calories to maintain their weight, and burns morecalories when exercising. As a person loses weight, their caloric needs decrease.Part II (Explore):Balancing Calories and Exercise(25 minutes)10. Pass out Student Sheet 3: Balancing calories and exercise. Let students workindependently or in groups to record information from four different foods andcalculate the amount of activity needed to burn off calories from various foods.11. Using the copy master, provide additional bar graphs for each student to represent adifferent type of food they research. Challenge students to find foods that seemnoteworthy or interesting (e.g., evenly distributed percentages, heavily unbalancedpercentages, or particularly high or low caloric values).12. After students have completed one bar graph to share with the class, have them foldback the bottom portion of the graph so that the name and calorie content of thefood are not displayed. Have students post their graphs in a central location in theclassroom.13. Have students complete the questions on Student Sheet 3 as they proceed.Part III (Evaluate):What food is that?(10 minutes)14. As a class, consider all of the bar graphs posted in a central location. Find one with apredominant percentage of protein, for example, and ask student to predict whattype of food it is.15. Highlight a few more bar graph examples from which to make predictions beforelooking at the food name. It might be helpful to group similar-looking graphs into thesame area, and then checking the food name to see how similar the types of foodsare.16. As a class, go over the answers to the questions on Student Sheet 3: Balancingcalories and exercise.Part A: Do all calories in foods come from carbohydrates? If not, where else docalories in our food come from?No, not all calories in your diet come from carbohydrates. Fats and proteins alsocontribute calories. Each also contributes varying amounts of nutrients such asvitamins and minerals. 2014 University of Washington. All rights reserved.Non-commercial, educational use only42Genes, the Environment, and Mehttps://gsoutreach.gs.washington.edu/
TeacherLesson Three: Where do calories come from in your diet?TeacherPagesPart B:4. What do you think happens to excess calories in all forms (i.e., carbohydrates fats,or protein) that are not burned during daily physical activity and metabolism?Excess calories from carbohydrates that are consumed but not burned duringmetabolism of additional physical activity can be stored as glycogen in the liveror muscles, or stored in adipose tissue as fat. Excess fat could be stored inadipose tissue as fat. Excess protein is often eliminated from the body.5. Based on your answer to the previous question, do you think it is important to beaware of the number of calories that you consume on a daily basis and whetheryou are getting a balanced diet of carbohydrates, fats and proteins? Why or whynot?It is important to know your balance of calories consumed versus burned, and tobe aware that excess calories in the form of carbohydrates, fat and proteins arenot stored in the same way. It may also be important to know that differentforms of exercise (e.g., exercise intensities) burn different energy storages (e.g.,fat versus glycogen).6. Explain the importance of balancing calorie intake and calories burned forsomeone who is pre-diabetic or has type 2 diabetes7. Which snack would be a better choice? Give three reasons to support youranswer.While students might choose the Snickers Barsince it has fewer calories, it is important tonote that the peanut butter sandwich 1)offers grains and fruit, both of which providefiber which slows digestion and contributes toa feeling of fullness, 2) The sandwich has byfar fewer empty calories, 3) The sandwichprovides more protein. If students dig a bitdeeper on Food-A-Pedia, the will find that the sandwich also provides more mineralsand vitamins. However, the sandwich is much higher in sodium which could benoteworthy for certain groups of people, including diabetics.Teacher ResourceA great resource for the role of micro-nutrients can be found at The Linus PaulingInstitute at the University of Oregon: http://lpi.oregonstate.edu/ 2014 University of Washington. All rights reserved.Non-commercial, educational use only43Genes, the Environment, and Mehttps://gsoutreach.gs.washington.edu/
TeacherLesson Three: Where do calories come from in your diet?TeacherPagesPart IV Closure(8 minutes)17. Ask students how this lesson contributes to their understanding of the DrivingQuestion: How can the growth of type 2 diabetes in the Yakima Valley beslowed?18. Revisit the Question Wall to see if any questions have been answered or morequestions need to be added.19. Have students consider possible Call to Action product that might grow from thislesson. For example, students could: Explore various dietary or food claims for accuracy. Research important nutritional habits for maintaining glucose levels forpeople with diabetes and create a specialized nutritional map. Track their own diet and exercise over time in order to evaluate theirown health status and potential risk for type 2 diabetes. Chart a change in diet over time for a specific cultural or ethnic group andresulting impacts on health.Resources to support students in their Call to Action can be found in theAssessment section at the end of the curriculum.Note: Students might also be interested to research where food labelscome from, how food labels will change in the near future, who monitorsthem for accuracy, and what the acceptable margin of error is for thelabels. It is interesting to note that although the labels are mandated bythe FDA, the food company itself, not the FDA, is responsible for theiraccuracy. The law allows up to a 20% margin of error on food labels.GlossaryBasal metabolic rate: The rate at which an organism uses energy (burns calories)when at complete rest. 2014 University of Washington. All rights reserved.Non-commercial, educational use only44Genes, the Environment, and Mehttps://gsoutreach.gs.washington.edu/
TeacherTeacherPagesLesson Three: Where do calories come from in your diet?Copy MasterAdditional bar graphs for representing percentages of food caloriesName:Total cal:Name:Total cal:Name:Total cal:Name:Total cal: 2014 University of Washington. All rights reserved.Non-commercial, educational use onlyName:Total cal:Name:Total cal:45Genes, the Environment, and Mehttps://gsoutreach.gs.washington.edu/
Teacher46
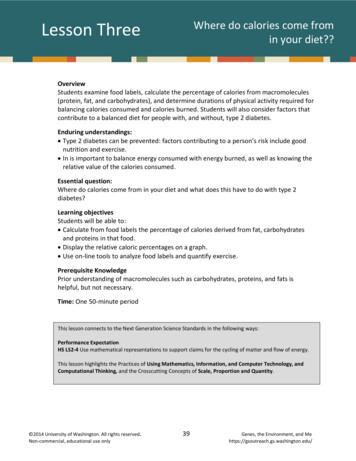
TeacherStudentResourceLesson Three: Where do calories come from in your diet?Part A Example: Calculating Food Labels1. Using the above label, calculate the total calories in Green Giant Whole Kernel Sweet Corna. Grams of Fat 1x 9 calories/gram 9caloriesb. Grams of Carbohydrates 20x 4 calories/gram 80caloriesc. Grams of Protein 2x 4 calories/gram 8calories97caloriesd. Total calories:Note: the total calculated calories may not be identical to the label because grams ofnutrients are rounded for label printing. Use your calculated number of calories tofind the percentages of calories for each type of food, not the number from the label.2. Calculate the percent calories of each of the food types (fat, carbs, and protein):Remember:Part of caloriesWhole (total) caloriesX 100 percentagea. % calories from fat 9/97 fat calories/total calories x 100 9.3 %b. % calories from carbs 80/97 carb calories/total calories x 100 82.5 %c. % calories from protein 8/97 protein calories/total calories x 100 8.2 %3. Represent the percentages from Step 2 as a bar, as you see here.Label the name of the food and provide the total calories perserving. Note: make sure to use the following colors:fat (green), carbohydrates (red) and protein (purple).Name: Sweet corn kernels, cannedCalories: 97 2014 University of Washington. All rights reserved.Non-commercial, educational use only47Genes, the Environment, and Mehttps://gsoutreach.gs.washington.edu/
TeacherLesson Three: Where do calories come from in your diet?StudentResourcePart B Example: Calculating Physical Activity1. How many calories are in a McDonald’s Grilled Chicken Sandwich vs. a McDonald’s Big Mac?Go to: www.supertracker.usda.gov and enter the food category and type into Food-A-Pedia.Enter the type of food from the drop-down menu, and then enter the type of food. Next,choose the correct food from the search results: McDonald’s Grilled Chicken Sandwich:484 calories McDonald’s Big Mac:585 calories2. How long you would need to burn off the calories in the McDonald’s Grilled Chicken Sandwichvs. the McDonald’s Big Mac?Go to the Activity Calculator at: hten-up-and-getmoving: Choose your favorite physical activity, and determine the duration of activity neededto burn off the calories for each meal.For example, a 170-poundperson would need to walkbriskly for just over an hourto burn 486 calories—enough for the GrilledChicken Sandwich. 2014 University of Washington. All rights reserved.Non-commercial, educational use only48Genes, the Environment, and Mehttps://gsoutreach.gs.washington.edu/
TeacherStudentSheet 3Lesson Three: Balancing calories and exerciseName:Date:Period:Part A: Using food labels or Food-A-Pedia (www.supertracker.usda.gov/foodapedia.aspx)choose four different foods to compare. Complete the calculations and fill out the bar graph.ProteinsThings to remember Grams of Fat x 9 cal/gram calories from FatGrams of Carbohydrate x 4 cal/gram calories from CarbohydratesGrams of Protein x 4 cal/gramcalories from ProteinsPart of caloriesTotal calories Carbsx 100 percent caloriesFatsFood #1:Total Calories:From the label Calculate the Calculate the Grams of Fat:Calories From Fat:% calories from Fat:Grams of Carbs:Calories from Carbs:% calories from Carbs:Grams of Protein:Calories from Protein:% calories from Protein:Total calories:Food #2:Total Calories:From the label Calculate the Calculate the Grams of Fat:Calories From Fat:% calories from Fat:Grams of Carbs:Calories from Carbs:% calories from Carbs:Grams of Protein:Calories from Protein:% calories from Protein:Total calories: 2014 University of Washington. All rights reserved.Non-commercial, educational use only49Genes, the Environment, and Mehttps://gsoutreach.gs.washington.edu/
TeacherStudentSheet 3Lesson Three: Balancing calories and exerciseFood #3:Total Calories:From the label Calculate the Calculate the Grams of Fat:Calories From Fat:% calories from Fat:Grams of Carbs:Calories from Carbs:% calories from Carbs:Grams of Protein:Calories from Protein:% calories from Protein:Total calories:Food #4:Total Calories:From the label Calculate the Calculate the Grams of Fat:Calories From Fat:% calories from Fat:Grams of Carbs:Calories from Carbs:% calories from Carbs:Grams of Protein:Calories from Protein:% calories from Protein:Total calories:Do all calories in foods come from carbohydrates (e.g., glucose)? If not, where else do caloriesin our food come from? 2014 University of Washington. All rights reserved.Non-commercial, educational use only50Genes, the Environment, and Mehttps://gsoutreach.gs.washington.edu/
TeacherStudentSheet 3Lesson Three: Balancing calories and exerciseName:Date:Period:Part B:1. Using the Activity Calculator found at ten-up-and-get-moving, choose your favorite physical activity, and determine howlong you would need to participate in this activity to burn off the calories from one of thefoods you chose in Part A. Name of food: Activity chosen: Duration of activity needed to burn of the calories in the food:2. Choose two snacks from the vending machine or fromyour home, and use aspx or the labelsto determine how many calories are in each of thesesnacks.Food-A-Pedia is useful for looking upnutritional values of unprocessedfoods that do not come packaged,such as fruits and vegetables. Howabout including a piece of fruit orvegetable as a snack? Snack #1 :calories Snack #2 :calories3. Using the Activity Calculator: hten-upand-get-moving: Choose a physical activity, and determine how long you would need toparticipate in this activity to burn off the calories from each of the two snacks. Activity chosen: Duration of activity needed to burn of the calories in: Snack #1 : Snack #2 :4. What do you think happens to excess calories (i.e., carbohydrates fats, or protein) that arenot consumed (i.e., burned) during daily physical activity and metabolism? 2014 University of Washington. All rights reserved.Non-commercial, educational use only51Genes, the Environment, and Mehttps://gsoutreach.gs.washington.edu/
TeacherStudentSheet 3Lesson Three: Balancing calories and exercise5. Based on your answer to question 4, do you think it is important to be aware of the numberof calories that you consume on a daily basis and whether you are getting a balanced diet ofcarbohydrates, fats and proteins? Why or why not?6. Explain the importance of balancing calorie intake and calories burned for someone who ispre-diabetic or has type 2 diabetes7. Which snack would be a better choice? Give three reasons to support your answer. 2014 University of Washington. All rights reserved.Non-commercial, educational use only52Genes, the Environment, and Mehttps://gsoutreach.gs.washington.edu/
McDonald’s grilled chicken sandwich vs a McDonald’s ig Mac? 8. Using Student Resource Part B: Calculating Exercise, demonstrate for students how to find the calories of each sandwich using the USDA’s Food-A-Pedia section of the SuperTracker website (www.supertr