Transcription
COMP 4971C: Independent Study (Spring 2016)Analysis of Hong Kong Stock Exchange (HKEx)Stocks with Variables Relating to Closing PriceStudent:Felicia Rebecca ISJWARAYear 2, BBA in Global BusinessSupervised by:Dr. David RossiterDepartment of Computer Science and Engineering
TABLE OF CONTENTSAbstract3Chapter 1: Introduction41. Background42. Problem Statement43. Scope of Study54. Goals5Chapter 2: Methodology61. Programming Language62. Data Source63. Variables64. Analyzing Data6Chapter 3: Results101. Tables102. Issues103. Conclusion104. Discussion11Bibliography12Appendix A: List of Macros13Appendix B: Results152
ABSTRACTRational investors are always risk averse, however financial concepts state that assets with highrisk are the ones that have the potential to generate a higher return. The Hong Kong StockExchange (HKEx) market is a relatively new international market when compared with moreestablished and larger counterparts such as NYSE and NASDAQ, but does not lack the potentialof having anomalous, high-risk and high-return assets. In order to identify those performers, acomprehensive analysis of the current HKEx market is needed. This study is focused onanalyzing the patterns of the closing price movements of companies listed on HKEx by takingthree variables into account: minimum change as a ratio, moving average, and consecutive days.After running the analysis using Excel and Excel VBA, tables filled with the highest likelihoodof occurences in which these three variables have been generated.3
CHAPTER 1: INTRODUCTION1. BackgroundRational investors are always risk averse, however financial concepts state thatassets with high risk are the ones that have the potential to generate a higher return. Aform of asset every average investor has access to are stocks. In order for a person toinvest in a stock with high expected return, this investor must first identify stocks withrelatively higher risks and higher expected returns than the average market portfolio.Investors can do this by selecting a particular stock and then benchmarking it against themarket performance to spot these stocks. These stocks are anamolous in nature, as theygive drastic increases in returns over a certain period. Hence, identifying anomalousstocks would mean indicating stocks that have potential for generating high returns.Numerous analyses of the stock market have been done and are available forthose listed in large stock exchanges such as NYSE and NASDAQ. However, thereseems to be a lack of consolidated data of the stocks listed on Hong Kong StockExchange (HKEx). To find anomalies in the Hong Kong stock market, a comprehensiveanalysis on HKEx as a whole must be conducted first as a benchmark. Only after amarket standard has been obtained can anyone benchmark an individual stock’sperformance against it.2. Problem StatementWhen creating a standard to benchmark against, frameworks and variables thatwould be useful for future analysis have to be taken into account. This boils down to theproblem statement of the study:4
How can we create an analysis of the performance of stocks listed on HKEx overthe past 10 years that can be used as a benchmark for identifying anomalousstocks?3. Scope of StudyAlbeit the analysis concept being universal, this study is limited to analysis of acertain scope of data. Data used for analysis in this study come from the Hong KongStock Exchange, which are mainly stocks that are listed on HKEx (from 0001.HK to2343.HK). The prices used with respect to each stock are the closing prices daily (Berk,et al., 2015), and the time frame of the data collected is 10 years.4. GoalsThe goals of this study are:i.To determine the variables used to measure performance of companieslisted on HKExii.To design a framework for current market analysis and how to identifyanomalies by benchmarking individual stocks’ performance against itiii.To conduct the market analysis and analyze the results5
CHAPTER 2: METHODOLOGY1. Programming LanguageWhen conducting this study, the software used is Microsoft Excel, and thelanguage used to conduct the analysis is Excel VBA, combined with a few existingfeatures of Microsoft Excel for easier data visualization. A list of macros used to conductthis study is listed in Appendix A.2. Data SourceThe sources of the data are grabbed from Yahoo! Finance and are of the stockslisted on Hong Kong Stock Exchange. The two elements used from each stock are the 1)date and 2) that day’s closing price for the given stock.3. VariablesVariables used for the analysis are:a. Minimum change as a ratio: measures the minimum change of closing price todaycompared to the previous day’s. This variable’s value will span from 1.00 to 2.00with increments of 0.01.b. Moving average: taken into account to reduce the noise of the market’s data(O'Neil, 2009). This variable’s value will span from 1 to 4 days with incrementsof 1 day.c. Consecutive days: measures over how many consecutive days does the priceincrease last. This last variable is most useful to measure anomalies in the stock6
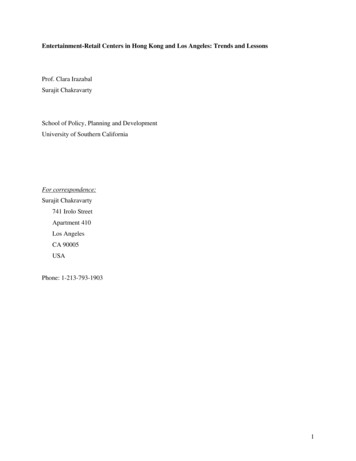
market to identify the lasting effect of these stocks. This variable’s value will spanfrom 2 to 4 days with increments of 1 day.The table generated to account for these variables is:Table 1: Analysis Tablein which each cell will account for the number of occurrences in which all three variablesare valid in any given date and stock.4. Analyzing DataThe automation of the data analysis is conducted in two steps:a. Grabbing data from Yahoo! FinanceData for each stock’s closing price will be grabbed by a macro from Yahoo!Finance according to the specified date range, and the two columns taken fromtheir publicly available CSV sheet are “Date” and “Closing Price”. The data willbe placed in a new sheet renamed after each stock, and additional columns will becreated to calculate the other required variables.In order to visualize the data, data used to count these occurences are listed ineach separate column. For example, the column “Price Increase [1]” is the7
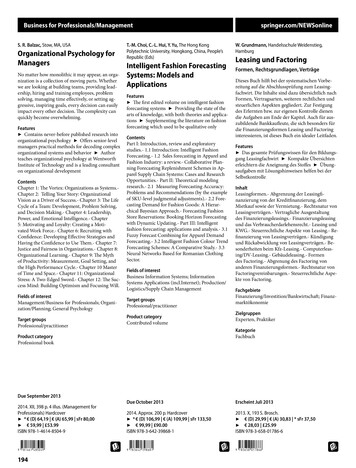
minimum change as a ratio of “Close”. “Moving Average [2]” refers to themoving average of “Close” over 2 days, and “Price Increase [2]” is the minimumchange as a ratio for “Moving Average [2]”. Similarly, “Moving Average [3]” and“Moving Average [4]” are moving averages of “Close” for 3 and 4 daysrespectively. “Price Increase [3]” and “Price Increase [4]” refers to the minimumchange as a ratio for “Moving Average [3]” and “Moving Average [4]”respectively.A sample sheet generated can be seen below, which is for the stock 0100.HK,Clear Media Limited.Table 2: Sheet for 0100.HK. The first two columns’ values come directly from Yahoo! Finance,whilst the rest are calculated within Excelb. Tabulating occurrencesOnce all the data is stored in Excel, another macro will run to tabulate everyinstance across all stocks in the last decade in which the three variables are valid.8
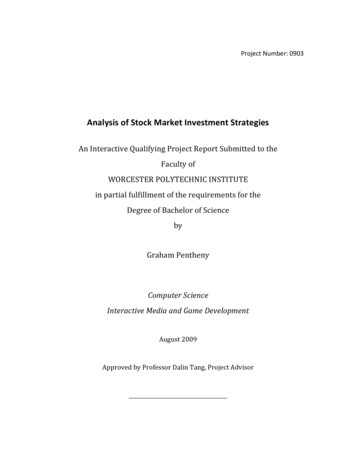
The number for occurrences will then be filled into each of the empty cells inTable 1, and the results are 100 tables of such (to account for three variables). Anexample of the results can be seen below.Table 3: Analysis table for stocks 0001.HK to 0100.HK across 10 years of closingprices9
CHAPTER 3: RESULTS1. TablesThe results for the first ten stocks (0001.HK to 0010.HK) can be seen in Appendix B.2. IssuesWhile conducting this study, several issues were experienced that hindered the studyfrom being completed, including Microsoft Excel’s capacity to run the macros. MicrosoftExcel seems to experience problems when running workbooks with large amounts ofdata. Each additional sheet, which represents 10 years of data for one stock, contributesto about 300KB increase in file size. It is not an issue when analyzing 10 stocks, butMicrosoft Excel stops responding once the sample data is upscaled.3. ConclusionA market analysis of one hundred stocks (0001.HK to 0100.HK) has been done, but theanalyzed data is insufficient to represent the whole Hong Kong Stock Exchange market.The data used for analyses are only a small portion (currently accounting for 4.27% outof 2343 stocks) of the whole HKEx market. To fully understand the market, more stockshave to be taken into account when analyzing the data, especially because the first onehundred stocks are the first one hundred most established listed companies in HongKong.10
4. DiscussionSuggestions future development of this study include:1. Changing the programming platform from Excel and Excel VBA, becauseexternal (Microsoft Excel) limitations restrict the capacity of the data analyzed2. Benchmarking individual stock’s performances to the HKEx market performanceto discover anomalies in the stock market to then identify the high risk and highexpected return performers11
BIBLIOGRAPHYBerk, Jonathan B, Peter M DeMarzo, and Jarrad V. T Harford. Fundamentals OfCorporate Finance. Malaysia: Pearson, 2015. Print.O'Neil, William J. How To Make Money In Stocks. New York: McGraw-Hill,2009. Print.12
APPENDIX A:List of macros used for analysisMacros in user GUI: the workbook investors will work with. Investors can determine their ownstart and end date of analysis, and can also choose the range of stocks they would like to look at.Other variables they can choose are the moving average (“Smooth data by (1) days”), andminimal change as a ratio (“Min price increase ratio”). Ideally, the values for these two would bethose that have the highest likelihood of identifying the anomalous stocks. This study wasfocused on identifying those recommended values. For users to perform their own analysis, thisworkbook also allows users to generate graphs regarding their stocks of choice.Figure 1: Graphic User Interface for investors to use1. generateStockData: generates one sheet per stock by grabbing data from Yahoo! Finance.Users can determine the starting and ending stock code, as well as the start and end date.2. generateGraph: generates a time-series graph for a given stock and plots both the averageand moving average on it.13
3. resetform: resets the inputs of the GUI to the default (and recommended) values.Additional macros for market analysis: this is the workbook used to analyze the stock data.Apart from the features available in the user GUI, this workbook is also equipped with othermacros that enable analysis, such as generating the analysis tables and other macros forconvenience in navigation between the numerous sheets.1. generateTable: generates the tables used for analysis that encompasses three variables.The inputs for the analysis include starting and ending stock codes, and those values willbe taken from the “Home” GUI sheet.2. Additional macros such as deleteSheet (a loop to delete numerous sheets at a time),viewAnalysis (to move the sheet containing the analysis tables to the beginning of aworksheet) have also been created to increase the convenience of data analysis.14
APPENDIX BResults: Analysis tables for stocks 0001.HK to 0010.HK with three variablesMinimal Change as aRatioConsecutive DaysMinimal Change as aRatioConsecutive DaysMinimal Change as aRatioConsecutive DaysMinimal Change as aRatioConsecutive DaysMinimal Change as aRatioConsecutive DaysMinimal Change as aRatioConsecutive Days1.00Moving Average 50448006550832091901.01Moving Average 099010401.02Moving Average 1.03Moving Average oving Average (Days)1234267022013070377504020410202001.05Moving Average (Days)1234240014050403413001041000015
Minimal Change as aRatioConsecutive DaysMinimal Change as aRatioConsecutive DaysMinimal Change as aRatioConsecutive DaysMinimal Change as aRatioConsecutive DaysMinimal Change as aRatioConsecutive DaysMinimal Change as aRatioConsecutive Days1.06Moving Average (Days)12342260804010312000400001.07Moving Average (Days)1234219050301030000400001.08Moving Average (Days)1234210030101030000400001.09Moving Average (Days)123426020101030000400001.10Moving Average (Days)123425010101030000400001.11Moving Average (Days)12342401010103000040000Minimal Change as aRatio1.12Consecutive Days2Moving Average (Days)12344010101016
Minimal Change as aRatioConsecutive DaysMinimal Change as aRatioConsecutive DaysMinimal Change as aRatioConsecutive DaysMinimal Change as aRatioConsecutive DaysMinimal Change as aRatioConsecutive DaysMinimal Change as aRatioConsecutive Days30000400001.13Moving Average (Days)123424010101030000400001.14Moving Average (Days)123424010101030000400001.15Moving Average (Days)123422010101030000400001.16Moving Average (Days)123422010101030000400001.17Moving Average (Days)123421010101030000400001.18Moving Average (Days)1234210101010300004000017
Minimal Change as aRatioConsecutive DaysMinimal Change as aRatioConsecutive DaysMinimal Change as aRatioConsecutive DaysMinimal Change as aRatioConsecutive DaysMinimal Change as aRatioConsecutive DaysMinimal Change as aRatioConsecutive Days1.19Moving Average (Days)123421010101030000400001.20Moving Average (Days)123421010101030000400001.21Moving Average (Days)123421010101030000400001.22Moving Average (Days)123421010101030000400001.23Moving Average (Days)123421010101030000400001.24Moving Average (Days)12342101010103000040000Minimal Change as aRatio1.25Consecutive Days2Moving Average (Days)12341010101018
Minimal Change as aRatioConsecutive DaysMinimal Change as aRatioConsecutive DaysMinimal Change as aRatioConsecutive DaysMinimal Change as aRatioConsecutive DaysMinimal Change as aRatioConsecutive DaysMinimal Change as aRatioConsecutive Days30000400001.26Moving Average (Days)123421010101030000400001.27Moving Average (Days)123421010101030000400001.28Moving Average (Days)123421010101030000400001.29Moving Average (Days)123421010101030000400001.30Moving Average (Days)123421010101030000400001.31Moving Average (Days)1234210101010300004000019
Minimal Change as aRatioConsecutive DaysMinimal Change as aRatioConsecutive DaysMinimal Change as aRatioConsecutive DaysMinimal Change as aRatioConsecutive DaysMinimal Change as aRatioConsecutive DaysMinimal Change as aRatioConsecutive Days1.32Moving Average (Days)123421010101030000400001.33Moving Average (Days)123421010101030000400001.34Moving Average (Days)123421010101030000400001.35Moving Average (Days)123421010101030000400001.36Moving Average (Days)123421010101030000400001.37Moving Average (Days)12342101010103000040000Minimal Change as aRatio1.38Consecutive Days2Moving Average (Days)12341010101020
Minimal Change as aRatioConsecutive DaysMinimal Change as aRatioConsecutive DaysMinimal Change as aRatioConsecutive DaysMinimal Change as aRatioConsecutive DaysMinimal Change as aRatioConsecutive DaysMinimal Change as aRatioConsecutive Days30000400001.39Moving Average (Days)123421010101030000400001.40Moving Average (Days)123421010101030000400001.41Moving Average (Days)123421010101030000400001.42Moving Average (Days)123421010101030000400001.43Moving Average (Days)123421010101030000400001.44Moving Average (Days)1234210101010300004000021
Minimal Change as aRatioConsecutive DaysMinimal Change as aRatioConsecutive DaysMinimal Change as aRatioConsecutive DaysMinimal Change as aRatioConsecutive DaysMinimal Change as aRatioConsecutive DaysMinimal Change as aRatioConsecutive Days1.45Moving Average (Days)123421010101030000400001.46Moving Average (Days)123421010101030000400001.47Moving Average (Days)123421010101030000400001.48Moving Average (Days)123421010101030000400001.49Moving Average (Days)123421010101030000400001.50Moving Average (Days)12342101010103000040000Minimal Change as aRatio1.51Consecutive Days2Moving Average (Days)12341010101022
Minimal Change as aRatioConsecutive DaysMinimal Change as aRatioConsecutive DaysMinimal Change as aRatioConsecutive DaysMinimal Change as aRatioConsecutive DaysMinimal Change as aRatioConsecutive DaysMinimal Change as aRatioConsecutive Days30000400001.52Moving Average (Days)123421010101030000400001.53Moving Average (Days)123421010101030000400001.54Moving Average (Days)123421010101030000400001.55Moving Average (Days)123421010101030000400001.56Moving Average (Days)123421010101030000400001.57Moving Average (Days)1234210101010300004000023
Minimal Change as aRatioConsecutive DaysMinimal Change as aRatioConsecutive DaysMinimal Change as aRatioConsecutive DaysMinimal Change as aRatioConsecutive DaysMinimal Change as aRatioConsecutive DaysMinimal Change as aRatioConsecutive Days1.58Moving Average (Days)123421010101030000400001.59Moving Average (Days)123421010101030000400001.60Moving Average (Days)123421010101030000400001.61Moving Average (Days)123421010101030000400001.62Moving Average (Days)123421010101030000400001.63Moving Average (Days)12342101010103000040000Minimal Change as aRatio1.64Consecutive Days2Moving Average (Days)12341010101024
Minimal Change as aRatioConsecutive DaysMinimal Change as aRatioConsecutive DaysMinimal Change as aRatioConsecutive DaysMinimal Change as aRatioConsecutive DaysMinimal Change as aRatioConsecutive DaysMinimal Change as aRatioConsecutive Days30000400001.65Moving Average (Days)123421010101030000400001.66Moving Average (Days)123421010101030000400001.67Moving Average (Days)123421010101030000400001.68Moving Average (Days)123421010101030000400001.69Moving Average (Days)123421010101030000400001.70Moving Average (Days)1234210101010300004000025
Minimal Change as aRatioConsecutive DaysMinimal Change as aRatioConsecutive DaysMinimal Change as aRatioConsecutive DaysMinimal Change as aRatioConsecutive DaysMinimal Change as aRatioConsecutive DaysMinimal Change as aRatioConsecutive Days1.71Moving Average (Days)123421010101030000400001.72Moving Average (Days)123421010101030000400001.73Moving Average (Days)123421010101030000400001.74Moving Average (Days)123421010101030000400001.75Moving Average (Days)123421010101030000400001.76Moving Average (Days)12342101010103000040000Minimal Change as aRatio1.77Consecutive Days2Moving Average (Days)12341010101026
Minimal Change as aRatioConsecutive DaysMinimal Change as aRatioConsecutive DaysMinimal Change as aRatioConsecutive DaysMinimal Change as aRatioConsecutive DaysMinimal Change as aRatioConsecutive DaysMinimal Change as aRatioConsecutive Days30000400001.78Moving Average (Days)123421010101030000400001.79Moving Average (Days)123421010101030000400001.80Moving Average (Days)123421010101030000400001.81Moving Average (Days)123421010101030000400001.82Moving Average (Days)123421010101030000400001.83Moving Average (Days)1234210101010300004000027
Minimal Change as aRatioConsecutive DaysMinimal Change as aRatioConsecutive DaysMinimal Change as aRatioConsecutive DaysMinimal Change as aRatioConsecutive DaysMinimal Change as aRatioConsecutive DaysMinimal Change as aRatioConsecutive Days1.84Moving Average (Days)123421010101030000400001.85Moving Average (Days)123421010101030000400001.86Moving Average (Days)123421010101030000400001.87Moving Average (Days)123421010101030000400001.88Moving Average (Days)123421010101030000400001.89Moving Average (Days)12342101010103000040000Minimal Change as aRatio1.90Consecutive Days2Moving Average (Days)12341010101028
Minimal Change as aRatioConsecutive DaysMinimal Change as aRatioConsecutive DaysMinimal Change as aRatioConsecutive DaysMinimal Change as aRatioConsecutive DaysMinimal Change as aRatioConsecutive DaysMinimal Change as aRatioConsecutive Days30000400001.91Moving Average (Days)123421010101030000400001.92Moving Average (Days)123421010101030000400001.93Moving Average (Days)123421010101030000400001.94Moving Average (Days)123421010101030000400001.95Moving Average (Days)123421010101030000400001.96Moving Average (Days)1234210101010300004000029
Minimal Change as aRatioConsecutive DaysMinimal Change as aRatioConsecutive DaysMinimal Change as aRatioConsecutive DaysMinimal Change as aRatioConsecutive Days1.97Moving Average (Days)12342101010103000
three variables into account: minimum change as a ratio, moving average, and consecutive days. After running the analysis using Excel and Excel VBA, tables filled with the highest likelihood of occur