Transcription
Picking up the NRA’s TabThe Public Costof Low Wagesin the Full-ServiceRestaurant Industry
1Executive Summary2Introduction2Data Sources and Methods3Findings4the big five in full service:5Full-Service Restaurants5Who is the NRA?6the big five in full service:7Tipped Sub-Minimum Wage8the big five in full service:9Recommendations for Policymakers, Employers, and the PublicDardenDine Equity and Bloomin’ BrandsBrinker International and Cracker Barrel10 Appendix12 EndnotesThis report was inspired by: Allegretto SA, Doussard M, Graham-Squire D, Jacobs K, Thompson D,and Thompson J. Fast Food, Poverty Wages: The Public Cost of Low-Wage Jobs in the Fast-Food Industry.Berkeley, CA. UC Berkeley Center for Labor Research and Education, October 2013.The primary research and writing was by Mike Rodriguez and Teófilo Reyes, with support from ArielJacobson. The profiles of major full-service companies were prepared by Philip Mattera at Good Jobs First.We gratefully acknowledge the support of Sarah Anderson and Philip Matera. This report should be cited as:Restaurant Opportunities Centers United. April 15, 2015. Picking Up the NRA’s Tab: The Public Cost of LowWages in the Full-Service Restaurant Industry. New York, NY: Restaurant Opportunities Centers United.Design by Quanci Design 2015 Restaurant Opportunities Centers United
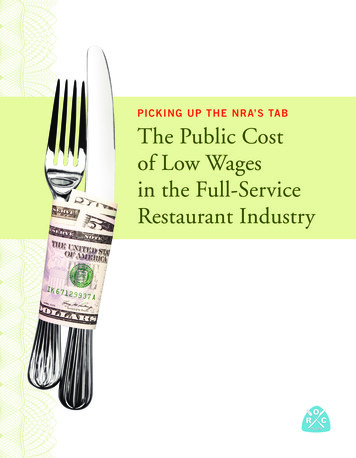
Executive SummaryThe full-service restaurant industry currently employs over 4 million people and employment is expected to growby nearly 10% by 2022.1,2 Despite the industry’s growth, restaurant workers occupy eight of the ten lowest-paidoccupations reported by the Bureau of Labor Statistics; at least five of these are in full-service.3 Many of thesefull-service restaurant workers receive wages far below what is needed to provide basic necessities for themselves andtheir families. As a result, these workers must rely on taxpayer-funded programs in order to meet their basic needs.Of late there has been much public attention on fast food workers and the way that taxpayers subsidize fastfood companies because so many of their workers rely on public assistance.4 What has been less publicized isthe fact that the fast food segment of the restaurant industry works hand in hand with full-service restaurantsthrough the National Restaurant Association, the trade group and lobby for the entire industry. The full-servicerestaurant industry, which employs the majority of restaurant workers, receives a double subsidy from the public:through extraordinary levels of full-service restaurant workers being on public assistance; and through the subminimum wage, which requires customers to pay these workers’ wages directly through tips.This report estimates the public cost of low-wage jobs in the full-servicerestaurant industry. We focus our analysis on major means-tested public programs that operate as income supplements for working families. These vitalfigure 1 Participation in public programs12public benefit programs include health insurance (Medicaid and Children’sHealth Insurance Program, or CHIP, coverage), the federal earned income tax50%credit (EITC), food stamps (the Supplemental Nutrition Assistance Program,Full-serviceworkers40%or SNAP), basic household income assistance (Temporary Assistance for NeedyFamilies, or TANF), the national school lunch program, childcare assistance,All workers30%low income home energy assistance program, section 8 housing, and housing20%choice vouchers.5 We analyze public program utilization and cost data to estimate annual benefit expenditures on the families of full-service restaurant10%workers for the years 2009-2013.Main Findings Nearly half of the families of full-service restaurant workers are enrolled in one or more public-assistance programs.6 The cost of public assistance to families of workers in the full-servicerestaurant industry is 9,434,067,497 per year.7 Tipped restaurant workers live in poverty at 2.5 times the rate of theoverall workforce.8 Restaurant workers as a whole experience poverty at a rate over twicethat of the overall workforce – 20.9%.9 Large full-service restaurant companies like Darden and DineEquitypay their workers so little that many of the employees of these companies rely on taxpayer-funded programs.10 The taxpayer cost of a single Olive Garden is 196,970 annually.11Estimated annual cost of public assistance at thefive largest full-service restaurant companies13table 1Company Estimated Annual Average Cost ofPublic Assistance Provided to EmployeesDineEquity 449,569,135Darden 339,772,942Brinker International 237,432,503Bloomin’ Brands 233,711,874Cracker Barrel 166,870,3711
Introductiontable 2Median wages for full-service restaurant occupations14Occupation2014 Median WageChefs and head cooks 18.77First-line supervisors/managersof food preparation and serving workers 14.80Cooks 10.58Food preparation workers 9.61Bartenders 9.27Waiters and waitresses 8.98Dining room and cafeteria attendants,bartender helpers, and miscellaneous foodpreparation and serving related workers 8.92Dishwashers 8.97Hosts and hostesses, restaurant,lounge, and coffee shop workers 8.96Food preparation and servingrelated workers, all other 9.52Every year on tax day, when American taxpayers pay their fair share to sustaincrucial public services, they also get stuck with a multi-billion dollar tax bill tocover outsized subsidies and tax breaks that benefit the country’s largest companies. With many high-growth industries paying their employees too littleto meet basic needs for their families, a growing number of working familiesmust supplement their income with publicly funded programs. Full-servicerestaurant workers are at the core of America’s growing low-wage economy;many of these workers’ earnings are far below what’s needed to meet theirsubsistence needs.This report estimates the cost to the public as a result of low wages andscarce benefits in the full-service restaurant industry. To measure these costs,we draw upon publicly available administrative and survey data on majormeans-tested benefit programs. We estimate that the cost of these programsfor families of full-service restaurant workers averaged nearly 9.5 billion peryear from 2009-2013.While the full-service restaurant industry thrives, the workers who cook,clean, prepare, and serve food in the nation’s restaurants struggle with povertywages. Over 21% of tipped restaurant workers live in poverty — that’s 2.5times the rate of the overall workforce.15Conditions for full-service restaurant workers closely reflect those experienced within the industry as a whole. Nearly half of the families of full-servicerestaurant workers are enrolled in one or more public programs.16Data Sources and MethodsThis section provides an overview of our data sources and methods; for a detailed explanation of ourmethodology see Appendix.Our estimate of the public cost of low-wage work for full-service restaurant workers is based oncombining data on employment and public program participation with administrative data on participation levels and costs for relevant programs. This estimate draws upon an analysis of major means-testedpublic benefit programs that function as income supplements for low-income families. Public benefitprograms analyzed include: health insurance (Medicaid and Children’s Health Insurance Program, orChip, coverage), the federal earned income tax credit (EITC), food stamps (the Supplemental NutritionAssistance Program, or SNAP), basic household income assistance (Temporary Assistance for NeedyFamilies, or TANF), the national school lunch program, childcare assistance, low income home energyassistance program, section 8 housing, and housing choice vouchers. Our analysis of public benefitsto employed workers covers benefits directly provided to full-service restaurant workers as well as theirfamily as a whole. This includes restaurant workers with children enrolled in the CHIP program andother benefits provided at the family level such as SNAP and EITC.2
Data SourcesTo carry out our analysis we combined government administrative data containing enrollmentand cost data for major public support programs with information available in the CurrentPopulation Survey (CPS). Together, these sources allow us to estimate the total amount ofpublic benefits paid to full-service restaurant workers. In cases where government administrative program data is underrepresented in the CPS, we adjusted the CPS data to match the governmentdata and correct a well-documented undercount of certain program enrollment.17 In combining the CPSand administrative data, we selected a multiyear period (2009-2013) that minimized the impact of annualfluctuations in program costs and enrollment.FindingsAs a foundation for our estimate of the pubic cost oflow-wage jobs in the full-service restaurant industrywe analyzed enrollment and expenditure data for major public programs in order to generate an averagecost per family for the benefits analyzed. From 2009through 2013, total support for major public assistanceprograms averaged 631.64 billion annually. Medicaidand CHIP account for about 70 percent of the totalcosts. The Earned Income Tax Credit and Food Stampsare the next most costly benefits, amounting to 20 percent of the remaining expenditures.After determining the average costs per family forthe relevant benefit programs, we then proceeded toestimate the number of people participating in theprograms who are full-service restaurant workers. Weidentified full-service restaurant workers in the Current Population Survey (CPS) dataset by drawing uponOccupational Employment Statistics (OES) from theBureau of Labor Statistics (BLS). Using OES data,we modeled full-service restaurant workers within thebroader food service restaurant occupations definedin the CPS. Combining government administrativedata with figures drawn from the CPS allowed us togenerate an estimate of the cost-per-worker of majorpublic programs for full-service restaurant employees.We find that the total cost of public programs fortable 3Enrollment and costs of public support programs annual average 2009-201318Federal Program Enrollment Expenditure Average Annual Cost per RecipientEITC27,680,000 62,620,000,000 2,278Medicaid and CHIP59,893,116 448,120,295,408 7,482Food Stamps42,549,200 67,355,383,600 1,583TANF4,143,722 10,773,783,605 2,599School Lunch31,480,248 14,260,200,000 454Energy Assistance7,393,204 4,173,838,690 563Childcare Assistance934,920 8,734,616,280 9,360Housing Assistance2,265,571 15,598,456,335 6,885Sources: 2009-2013 March CPS & ACS, program administrative data.table 4Public program enrollment and costs19Full-Service (FS)Restaurant Program EnrollmentFederal ProgramProgram CostsAverage FS RestaurantAnnual CostWorkers’ Familiesper Recipient EnrolledCost of Program provisionfor FS RestaurantWorkers’ FamiliesEITC 2,2781,346,827 3,068,610,822Medicaid or Chip 7,482509,310 3,810,596,867Food Stamps 1,583562,274 889,872,172TANF 2,59966,700 173,342,050School Lunch 454679,062 307,983,214Energy Assistance 563118,184 66,509,774Childcare Assistance 9,36025,967 243,064,999Housing Assistance 6,885126,947 874,087,599Total cost of benefits to full-service restaurant workers’ families: 9,434,067,497Sources: 2009-2013 March CPS & ACS, program administrative data.3
the Big Fivein Full ServicerdDae n R e s ta u r a n1tsDarden is the dominant presence in the full-service restaurant sector, with more than1,500 locations that serve more than 320 million meals per year. Along with its OliveGarden restaurants, which can be found throughout the United States, the companyowns six smaller chains: LongHorn Steakhouse, Capital Grille, Bahama Breeze, Seasons 52, EddieV’s and Yard House. Darden recently sold the Red Lobster chain of seafood restaurants.Darden, which has more than 150,000 employees, has been embroiled in numerous controversiesover its labor practices and is a leading opponent of workplace reforms such as paid sick days. Ithas paid out several million dollars to settle lawsuits concerning the failure to pay overtime andrequiring off-the-clock work, and additional class actions are pending.Through its leadership in the National Restaurant Association, Darden has fought against improvements in the minimum wage, especially for tipped employees. In states such as Florida, Dardenofficials are reported to have pressed legislators to pass laws pre-empting local efforts to improvewages and working conditions.There have also been allegations that Capital Grille has engaged in a pattern of racial discrimination, including the denial of better-paid server and bartender jobs to non-white workers. In 2009,the U.S. Equal Employment Opportunity Commission announced that Darden’s Bahama Breeze chainwould pay 1.3 million to settle allegations that managers at its restaurant in Beachwood, Ohiohad subjected 37 black workers to repeated overt racial harassment. In addition to the monetaryrelief, the chain signed a three-year consent decree requiring it to improve its anti-discriminationpractices throughout the country.With its board now controlled by New York-based hedge fund Starboard Value, Darden seems moreintent than ever to drive down working standards in order to realize gains for Wall Street.CEO PayIn fiscal year 2014 then-chief executive Clarence Otis, Jr. received annual compensation totaling 7million and realized 2.6 million in value on the exercise of previously awarded stock options. In February2015 Eugene Lee, Jr. took over as CEO.Political InfluenceIn the last two election cycles (since 2011-2012) the Darden political action committee has made 951,000 in contributions to federal candidates. Darden has also greatly increased its lobbyingexpenditures in recent years, spending more than 1 million a year to influence federal policy.Big Five profiles prepared by Good Jobs First.
Who is the NRA?families of workers in the full-service restaurant industry averaged over 9.4 billion peryear between 2009 and 2013. More than 1.3 million families of full-service restaurantworkers receive the Earned Income Tax Credit, about double the number enrolled inany other program. 679,062 children of full-service restaurant workers receive a freeor subsidized school lunch. 562,274 families of full-service restaurant workers dependon food stamps to meet their basic needs. 509,310 families of full-service restaurantworkers receive a form of public healthcare assistance. These programs provide a vitallifeline for poverty-wage full-service restaurant workers and their families. However,through these programs taxpayers also subsidize America’s largest and most successfulrestaurant employers.Full-Service RestaurantsThe full-service restaurant industry is defined by large iconic brands whose householdnames generate billions in earnings each year. However, while industry chief executivesenjoy abundant compensation packages and shareholders receive generous rewardsthrough dividends and share buybacks, the workers who make these restaurants successful are among the lowest paid in the workforce. Finding themselves left out fromthe rewards generated through their labor, millions of full-service restaurant workersmust rely on public assistance in order to meet their basic needs.Low wages and lack of benefits at the five largest full-service restaurant companies inthe U.S. cost taxpayers an estimated 1.4 billion per year. These large corporations benefitfrom paying their workers tax-payer-subsidized low wages, while shifting huge rewardstowards chief executives and shareholders. Just last year these companies collectively: Earned 704,746,000 in profits; Paid 27,173,422 to their chief executives; Distributed 750,549,000 in dividends and buybacks.table 5Five largest full-service restaurant companies by size of U.S.–based restaurant workforce26Company Estimated Total U.S. Total U.S. Restaurants Estimated Average EmployeesRestaurant WorkforcePer U.S. 0192Brinker International96,4341,61560Bloomin’ Brands94,9231,28874Cracker Barrel67,775633107Payroll data for individual full-service restaurant companies is not publicly available,so we estimate the cost of public assistance attributable to a particular company byapplying the average public cost per employee for participation in public benefit programs generated above to the number of employees working under a particular brand.The National Restaurant Association (NRA) is thetrade lobby for the 700 billion restaurant industry. With annual revenues of over 91 million, 750staff, and nearly 40 congressional lobbyists, theNRA is one of the most powerful business lobbiesin Congress and state legislatures.20The NRA’s legislative agenda centers on opposing policies that improve working conditions andpublic health such as minimum wage increases,paid sick days, nutritional menu labeling, andregulation of sodium, trans fats, and sugars.21The NRA has been one of the fiercest and mosteffective opponents against initiatives to raise theminimum wage around the country.22Opposing raises for tipped workers – more thantwo-thirds of whom are women- through minimumwage increases is a particular priority for the NRA.As the leading force keeping the federal tippedminimum wage at 2.13, the NRA bears specialresponsibility for the gender inequities producedby maintaining subminimum wages for tippedworkers which result in the restaurant industrybeing the single largest source of sexual harassment claims to the Equal Employment OpportunityCommission.23Taking cues from the American Legislative Exchange Council (ALEC), the NRA has lobbiedsuccessfully to pass legislation that preventslocalities from getting to vote on paid sick days,strips states of their right to enact nutrition labeling requirements, and obstructs the advancementof women’s equality by opposing the PaycheckFairness Act, the Pregnancy Discrimination Act,and the Family Medical Leave Act.24The most recognizable members of the NRA includebrand-name industry giants like McDonalds, Yum!Brands (the owner of Taco Bell and KFC), Disney,and Darden Restaurants (the owner of Olive Garden, Longhorn Steakhouse, and Capital Grille).255
the Big Fivein Full ServiceD I N E e qu i t y2Formerly known as IHOP Corporation, DineEquityis the parent company of the IHOP chain of pancake-focused restaurants that began in 1958,as well as the Applebee’s chain of full-service grill and barcasual dining restaurants. The latter was acquired in 2007,and the DineEquity name was adopted the following year.DineEquity operates throughout the United States and inmore than a dozen foreign countries, with nearly 2,000 Applebee’s and 1,600 IHOP locations employing a total of about200,000 workers. Nearly all of the restaurants are franchiseoperations. In 2014 the company had 36 million in profit onrevenues of 655 million.Applebee’s is among the restaurant chains accused of notpaying minimum-wage rates for untipped work. In 2014 agroup of former employees of one of the chain’s franchiseoperators received a 2.7 million settlement over the issue.Other class action lawsuits involving Applebee’s workers arepending. Some IHOP franchisees are facing legal actionsconcerning overtime and minimum wage issues.Some Applebee’s franchisees have also faced charges ofsexual harassment. In 2011 one operator in North Dakotapaid 1 million to settle allegations of this kind brought bythe U.S. Equal Employment Opportunity Commission.CEO PayIn 2014 chief executive Julia Stewart received annualcompensation totaling 6.6 million as well as realizing morethan 6.9 million in value from the exercise of stock optionsand vesting of stock awards granted in previous years.Political InfluenceIn the last two election cycles (since 2011-2012) the DineEquity political action committee has contributed 16,000to federal candidates. During the same period the companyspent 930,000 on federal lobbying activities.bloomin’ brands3Bloomin
1 The full-service restaurant industry currently employs over 4 million people and employment is expected to grow by nearly 10% by 2022.1,2 Despite the industry’s growth, restaurant workers occupy eight of the ten lowest-paid occupations reported by the Bureau of Labor Statistics; at least five of these are in full-service.3 Many of th