Transcription
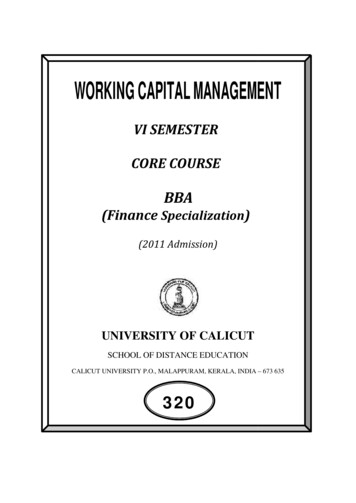
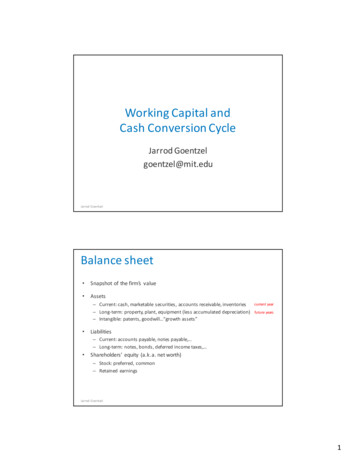
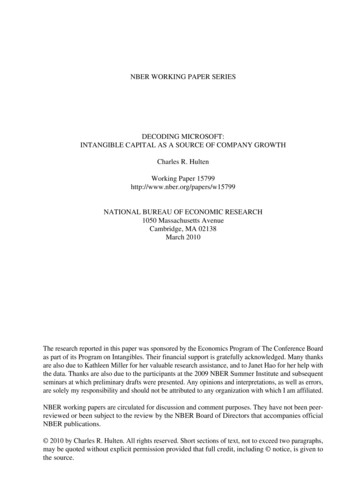
HindeSightwww.hindecapital.comAugust 10Silver Velocity- The Coming BulletMoney can lose its value through excessive abundance, if so much silver is coinedas to heighten people’s demand for silver bullion. For in this way the coinage’sestimation vanishes when it cannot buy as much silver as the money itselfcontains The solution is to mint no more coinage until it recovers its par valueCopernicusSilver Velocity to riseOur Hinde Silver Trend model has reached a significant low that usually precedes a dynamic move. This movecan be lower or higher but our other technical indicators signal a move higher is the most likely scenario.Silver SeasonalityOur silver seasonality analysis suggests that the trend will be directionally higher in price.01
HindeSightwww.hindecapital.comAugust 10Silver VolatilityOther than just purchasing silver bullion (in allocated form), speculators could purchase volatility. As one cansee from the chart below historical price volatility is at the lowest standard deviation on a rolling 3 month basisthat it has been for sometime. Straddle break evens look attractive or likewise out-the-money call premiumslook cheap, for those who agree with our directional bias for a move higher.Silver’s timeless fascinationMankind’s timeless fascination with silver stretches back millennia. As early as 700 B.C., the Mesopotamianmerchants used silver as a form of exchange. Later, many other civilizations also came to recognize theinherent value of silver as a trading metal.The ancient Greeks minted the drachma, which contained 1/8th ounce of silver; and in Rome, the basic coinwas the denarius, weighing 1/7th ounce. And let’s not forget the English shilling "sterling," originally denoting aspecific weight of silver, which has come to mean excellence. In fact the words for "silver" and "money" are thesame in at least 14 languages.Silver or money is derived from the Ancient Greek: ργήντος - argēntos, gen. of ργήεις - argēeis, "white,shining" ). The Incas of Peru called it the “tears of the moon” because they were awed by silver’s strangegleam and the Chinese believed that a silver locket hung around a child’s neck would ward off evil spirits.In recent years silver has grown to be regarded as the poor man’s gold. However we suspect silver will shakeoff this unfortunate shackle and give gold a “run for its money” as the old idiom goes.There are key fundamental differences between gold and his poor cousin silver. Demand for gold is almostentirely from those holding for financial safety and protection of purchasing power and likewise from fabricationthat preserves it. Gold is rarely if at all consumed. A base metal is the opposite, it is consumed. Like iron forexample.Here silver is unique, industry will consume it, and others will buy for financial gain and protection. Fluctuationsin the price of gold primarily arise from changes in demand as annual mine supply is small compared toexisting stockpiles; of the same magnitude as the small amount lost or consumed each year. Hence overground supplies don’t change much.Silver ounces come and go. Unlike gold silver’s active chemical properties lend it to practical industrial use thatsee much of it used beyond practical recovery. The uses for silver in modern industry are growing. It is the bestconductor of both heat and electricity, the most reflective, and after gold the second most ductile and malleable02
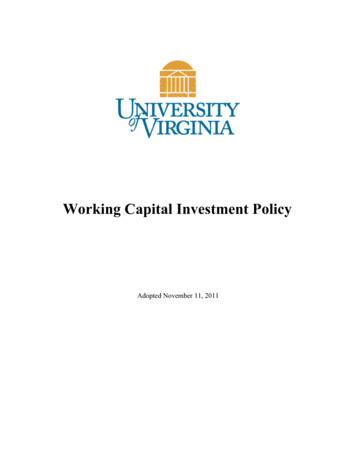
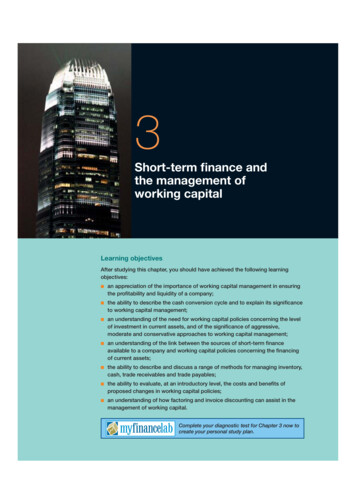
HindeSightwww.hindecapital.comAugust 10element. It is used in photography, electrical applications, particularly in conductors, switches, contacts andfuses. Silver alloys are used in batteries as cathodes. As a bactericide, silver is used in water purification andair handling systems. Silver is also a natural biocide and is very effective against bacterial infections such asMRSA. New products using silver’s biocidal qualities are being developed each year; clothing, bandages,toothbrushes, door-knobs (flu-protection), keyboards, the list goes on growing.Silver is much less rare than gold and as a consequence less effort goes into salvaging and protecting it.Annual mine production and consumption are large compared to existing stock piles, so price fluctuations intheory come from both these factors as well as investment demand.Silver supply demand imbalanceUniquely silver has been in a multi-decade imbalance between annual “production” and demand fromindustrial, jewellery and investment. Ted Butler of Investment Rarities Incorporated has become the mostardent silver analyst and has done extensive research into the issues of dwindling stockpiles. His welldocumented research extended into the leasing market and the existence of huge short positions on Comex(namely among a few large bullion houses) that have been allegedly used to manipulate the price of silverlower for benefit of the “users”. This supply of paper silver has undoubtedly arrested the rise in the price ofphysical silver bullion, as there would appear to be a structural imbalance in supply vs demand, which can onlybe resolved by a much higher increase in price in order to encourage ‘normal’ free market forces of supply anddemand to interact.The world annual silver mine output is approximately 650 million troy ounces (average of last decade), withabout another 180 million ounces from recycling, and possibly another 100 million ounces from selling fromother sources. Industrial consumption is almost 45%, jewellery consumes about 25%, photography is down toabout 15%, leaving 15% for investor demand. Investors buy about 100 to 150 million oz. of silver per year,which is barely 2 billion. Yet the BIS estimates that most all of the worlds' banks have 200 billion in ‘otherprecious metal’ (i.e. silver) notional value worth of derivatives on the books. This seems somewhatincongruous with the lack of supply. It tends to point to a potentially more sinister 21c22a.pdfIn July to November 2008 silver net US bank shorts rose from 9% to 99% of the Comex commercial net shortpositions in one shot. Equal to some 27,000 contracts or 30mm tr.oz of silver sold, just prior to a 50% pluscollapse in the silver futures price. The issue we and others in the market have with this egregious positioningis that it was concentrated between two commercial banks. Flip such a position around to the long side andregulators would be screaming ‘blue murder’ and accusations of market manipulation and market ‘cornering’would be rife. Remember Bunker Hunt.Two Banks Net Short as % of Commercial Net Short and Silver Futures Price(observe July 2008 “Commodity Massacre” short activity)03
HindeSightwww.hindecapital.comAugust 10The two commercial banks held 140% of annual mine supply in OTC positions. These two bullion banksdominate the OTC silver market. They range in concentration from 85% to 100% at any one time.HSBC and JPMorgan % Silver Derivatives (inferred) (average maturity less than 1 yr)Unwinds of these positions would require more silver than is readily available and will lead to much higherprices as sellers are sought.The manipulation of this small market has led to low prices whilst a structural imbalance of some note hasbeen growing.“What’s unique to silver is that it has been in a deficit consumption pattern for more than sixty years, with verylow prices over most of that time. That would be impossible for any commodity, except that it has actuallyoccurred in silver. But the very reason it has occurred in silver is the reason I think silver is the best thing toown”.Theodore Butler, Investment Rarities , first mentioned in 1998The laws of supply and demand dictate that when there is a chronic production shortfall, inventory can only bebid away at higher, not lower prices. Ted argues that most of the inventories consumed over the last 60 yearscame from government holdings. This amounted to a stupendous 6 to 10 billion ounces, some 100-150 millionounces of silver each year for 60 years. So lets put this in perspective it took 5000 years to accumulative thesestockpiles and in sixty, they have gone. Above ground silver is rarer than gold .As Ted Butler describes it, to look ahead 50 years, it would be appropriate to look back fifty years to gain asense of perspective. Half a century ago, at the end of World War II, total known stocks of silver amounted toten billion ounces (with the US government holding 4 billion ounces of that total amount). At that time, we werejust entering an era of unprecedented global economic expansion that has lasted to the present. In this era,silver was consumed in a variety of vital modern applications at a phenomenal rate. Today, known stocks ofsilver have shrunk over 95%, to maybe a half a billion ounces. The nine and a half billion ounce drawdown intotal silver inventory, was the result of the persistent shortfall between supply and demand, which continues tothis day. Not coincidentally, the current 150 to 200 million-ounce annual deficit in silver mirrors the long-termtrend line average. This continuing deficit is remarkable in that there has been decent growth in worldproduction of silver over the past 50 years, but obviously not enough to satisfy the surge in industrial demand.Fast forward towards the end of 2008 and the seizing up of the financial system saw base metals plummet invalue. This was down to a combination of deleveraging and lack of available financing for mining companies.Those encumbered with too much debt and ailing commodity prices had to curtail their current miningoperations, in some cases to bare minimums, whilst shelving large capital expenditure projects which would04
HindeSightwww.hindecapital.comAugust 10bring on new supply in years to come. As over two thirds of silver production occurs as a by-product fromcopper, zinc and lead mining, silver mine supply into the future has been stymied.2009 saw such a swift turnaround in copper prices that silver production was a record 709 mm troy ounces.This was 25 million ounces higher than in 2008 and arguably would have been higher had it not been for thecrisis. But this is a moot point as we have just outlined. It took thousands of years to build up ten billion ounces,so to create a current surplus of over 2% does not appear feasible with the supply demand imbalance wehave. We will caveat; it is exceedingly difficult to ascertain the true levels of inventories, and there is alwaysdisparity on the numbers depending on which data collector you converse with. However as can be seen belowinventories remain exceedingly low, irrespective of whose data one observes.Silver inventories have only turned up as assessed by CPM group, because they have included Silver ETFs,such as iShares SLV. This seems odd, as these inventories already existed, and were merely ‘transferred’ intothese vehicles.In a nutshell- for many decades the world has consumed more silver than it has produced. That hasnecessitated a draw down of previously produced silver - the existing inventories. There has never been asituation in any commodity where such conditions have failed to cause a dramatic price increase.Money velocity rises leads to Silver riseHinde Capital rigorously examines collates and archives proprietary economic and geo-strategic data to helpprovide us with global, national and regional sectoral insights. In 2009 “HindeSight” Macro research was spunoff as Variant Perception www.variantperception.com. Variant has in very short order become a respectedindependent voice. Their growing independent macro research services are widely used by institutionalorganisations, hedge funds, corporate and family offices.In their latest August monthly “De Facto QE in Emerging Markets” they discuss that loose liquidity andundervalued emerging market currencies are leading towards excess foreign exchange reserve accumulationand loose credit conditions. Underleveraged emerging markets with higher velocity will continue to benefit fromaccommodative monetary policies of a developed world beset with high debt and low monetary velocity. AtHinde we employ their analysis and in conjunction with the VP team have drawn some assertions on therelationship between growing forex reserves, increasing monetary velocity and the trajectory for silver. Whatwe have determined is that the macro back drop is also exceedingly promising for silver in the near term.05
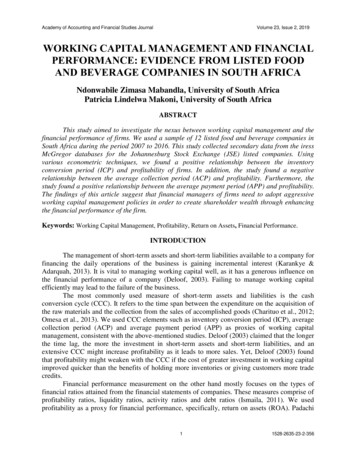
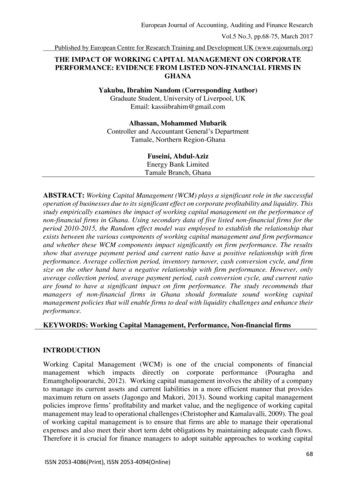
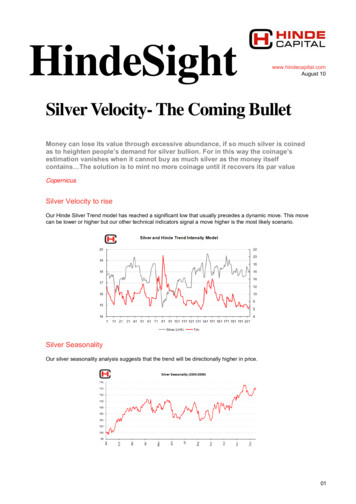
www.hindecapital.comAugust 10HindeSightWhen foreign exchange reserves are accumulated, they represent an expansion in central bank balancesheets. (Of course, some of the reserve accumulation can be sterilized, but this is only happening partially atbest.) Excess reserve accumulation is acting as a massive de facto form of quantitative easing.Global Foreign Reserves Growth45%40%35%30%25%20%15%10%5%Latest YoY Reserve dBraziIndonesiaSKoreaHongKong0%4 year averageSource : Variant PerceptionReserv e Growth, YoY, Asia EM35%30%25%20%15%10%5%IndonesiaHong KongPhilippinesWorldThailandSouth KoreaSingaporeChinaTaiwanMalaysia0%Source : Variant Perception06
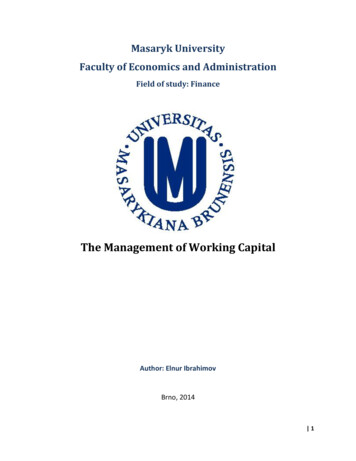
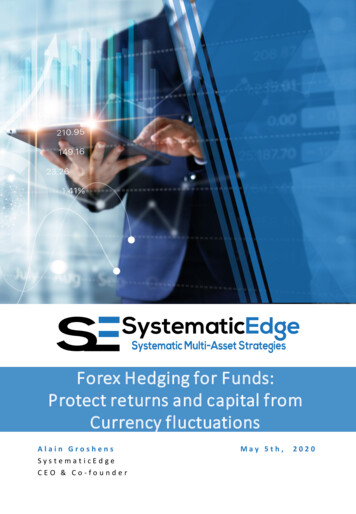
www.hindecapital.comAugust 10HindeSightContinued reserve accumulation can lead to inflationary pressure, over-investment, complications in themanagement of monetary policy and misallocation of domestic banks’ lending and asset bubbles. As thefollowing chart shows, there is a high correlation between reserve growth and emerging market stock returns.EM Reserve Growth MoMvs MSCI Emerging Markets % change 6mo20080%60%15040%10020%500%0-20%-50-40%Total FX Reserve Growth -02-60%EM Stocks 6mo % changeSource : Variant PerceptionAs EM reserve growth has continued in recent months we expect the MSCI continued outperformance toWestern stock markets to support silver prices. Silver has a strong correlation with the MSCI Emergingmarkets:07
www.hindecapital.comAugust 10HindeSightExchange traded commodities are very cheapVP have highlighted before that exchange traded commodities are cheap. Industrial commodities that are notexchange traded are not far from their all time highs, and they barely sold off during the earlier sell-off in riskassets through April to June.CRB Index and CRB Industrial 9450Jun-97500Feb-93500Oct-88550Jun-84550CRB IndustrialSource : Variant PerceptionThe ratio of the CRB Index vs. the CRB Raw Industrial Index is at all time lows, indicating significantundervaluation. The CRB Raw Industrial Index is driven by fundamental demand and not speculators, whilethe CRB Index is driven by speculators. (The Raw Industrial Index includes things like copper scrap, leadscrap, steel scrap, tin, zinc, burlap, cotton, print cloth, wool tops, hides, hogs, lard, steers, tallow, butter,soybean oil, lard, print cloth, rosin, and rubber.) The Raw Industrial Index contains no energy inputs, so is notdriven by higher oil. VP also look at the JOCI Index which includes many non-exchange traded commodities(for example burlap, steel, lead, tin, nickel, hides, rubber, tallow, plywood, red oak, benzene, ethylene, etc).They both present a similar picture.CRB / CRB Industrial Ratio vs CRBCRB / JOCI Ratio vs 43.532.52350300250CRB / CRB Industrial1.510.5200CRBCRB / JOCI IndexJ un-10N ov -07N ov -04M ay -06N ov -01M ay -03N ov -98M ay -00M ay -97N ov -95N ov -92M ay -94M ay -91N ov -89M ay -88N ov -86150M ay ov-830.5May-85150Jun-810.6May-82200CRBSource : Variant PerceptionThe charts could not be clearer. Exchange traded commodities have never been cheaper relative to nonexchange traded commodities.08
www.hindecapital.comAugust 10HindeSightVP has followed a framework of observing leading indicators in trying to determine if ‘deflation’ or a double-diprecession is on the horizon. They wrote in a recent monthly that they believed the world was experiencing amid-cycle slowdown, similar to that seen in 1994 and 2004. “The momentum of growth has peaked and ourforward looking indicators have peaked, but they are still positive and pointing to continued growth ahead.”The gold/copper ratio is one such leading indicator VP look at (it is an intuitive real world measure of excessliquidity). It gives an advance read on ISM manufacturing. After a huge surge, followed by a sharp slump, ithas started to tick up again. The new orders to inventory ratio has also picked up again over the last fewmonths.Gold / Copper Ratio (8mo fwd) vs ISM .5402.0ISM Manufacturing 5Dec-94Dec-93Dec-92Dec-9135Dec-901.5Gold / Copper 8mo forwardSource : Variant PerceptionOver the summer concerns about a European banking crisis helped push sentiment to very negative levels.The VP Mania and Panic indicator, which measures risk aversion and risk taking globally, shows that onlyduring the crash in October 2008 had the indicator been lower.Source : Variant PerceptionExtreme sentiment in western stock markets, undervalued exchange traded products including silver and aturning up in the gold/copper ratio suggest the precious metals complex will rise substantially in short orderunder a surfeit of monetary reserves that is originating primarily in the West but accumulating in the East andon other developing nations’ balance sheets. We observe the Gold silver ratio closely.09
HindeSightwww.hindecapital.comAugust 10SUMMARY of the most important Gold Silver ratiosAs Ferdinand Lips (of ‘Gold Wars’ fame) writes, the Gold Silver ratio makes for one of the most fascinatingquestions of monetary history, and also one of the most mysterious. This ratio was at 10 in antiquity, by theModern Age it was at 14. By the eighteenth century governments tried to stabilise at 15, but without success.In the nineteenth century the ratio was completely destabilised as it raced towards 60 and then back to 16 bythe First World War 1930 and at the height of the Great Depression it hit 100 and this decade appears to havestabilised at 55 to 60; an anomaly in light of all we have written about here.- 90 Was the ratio of silver to gold when the price of an ounce of silver was at a low in 1991. With one ounce ofgold one could buy 90 ounce of silver. In recessions the spread widens.- 51 Was the average ratio of the price of gold to silver in 2007. In boom time the spread narrows.- 17 Was the gold / silver ratio at the time of the record gold and silver prices in 1980. Bunker Hunt corners themarket.- 15 Was the official ratio of gold to silver during the great period of Bimetallism, 15 ½ for France (1803), 15.68for the USA (1800), 14,29 for England (1806).- 12 Was the gold/silver ratio in Antiquity in Rome.-12.5 Was the ratio in Greece at the time of the death of Alexander the Great in 323 BC.The ratio of production and reserves of gold and silver:- 13 Is the ratio of world production from 1493 to 1931. For this 400 year period 13 times more silver than goldwas produced.- 8 Was the ratio of silver to gold production in the world in 2006. What is being said is that eight times moresilver than gold was produced in 2006.- 7.64 It the ratio of all production of gold and silver during one century (1900-2003). In the 103 year period,there was 7.64 times more silver than gold produced in the world.- 6.4 Was the ratio of the ground reserves of silver to gold in 2000.Source: Dr Thomas Chaize10
HindeSightwww.hindecapital.comAugust 10Despite silver's intrinsic properties as an industrial element, it was once money. Silver began to lose its statusas money starting in the late 1800's, as nations stopped using silver, and started using only gold as money.Over 100 years of this "demonetization" h
theory come from both these factors as well as investment demand. Silver supply demand imbalance . Uniquely silver has been in a multi-decade imbalance between annual “production” and demand from industrial, jewellery and investment. Ted Butler of I