Transcription
Linking Life Sciences Data Using Graph-Based MappingJan Taubert1, Matthew Hindle1, Artem Lysenko1, Jochen Weile2, Jacob Köhler3,and Christopher J. Rawlings11Department of Biomathematics and Bioinformatics, Rothamsted Research, Harpenden, UK2School of Computing Science, Newcastle University, Newcastle upon Tyne, UK3Protein Research Group, University of Tromsø, ris.rawlings}@bbsrc.ac.uk,j.weile@ncl.ac.uk, Jacob.Kohler@fagmed.uit.noAbstract. There are over 1100 different databases available containing primaryand derived data of interest to research biologists. It is inevitable that many ofthese databases contain overlapping, related or conflicting information. Data integration methods are being developed to address these issues by providing aconsolidated view over multiple databases. However, a key challenge for dataintegration is the identification of links between closely related entries in different life sciences databases when there is no direct information that provides areliable cross-reference. Here we describe and evaluate three data integrationmethods to address this challenge in the context of a graph-based data integration framework (the ONDEX system). A key result presented in this paper is aquantitative evaluation of their performance in two different situations: the integration and analysis of different metabolic pathways resources and the mapping of equivalent elements between the Gene Ontology and a nomenclaturedescribing enzyme function.1 IntroductionA major challenge for users of data from genetics, genomics and other high throughput experimental methods used for systems biological research is how to interprettheir results in the wider context of the biological information that is held in the manydatabases scattered around the internet. Furthermore, some of these databases havesimilar or overlapping coverage and the user is faced with the additional challenge ofgenerating a consensus data set or selecting the “best” data source. The effective integration of information from different biological databases and information resourcesis recognized as a pre-requisite for many aspects of systems biological research andhas been shown to be advantageous in a wide range of use cases such as the analysisand interpretation of ‘omics data [1], biomarker discovery [2] and the analysis ofmetabolic pathways for drug discovery [3].Software designed to integrate data for life sciences applications has to address twoclasses of problem. It must provide a general solution to the technical heterogeneity,which arises from the different data formats, access methods and protocols used bydifferent databases. More significantly, it must address the semantic heterogeneitiesN.W. Paton, P. Missier, and C. Hedeler (Eds.): DILS 2009, LNBI 5647, pp. 16–30, 2009. Springer-Verlag Berlin Heidelberg 2009
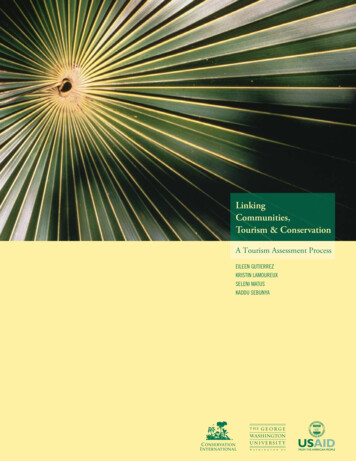
Linking Life Sciences Data Using Graph-Based Mapping17evident in a number of life science databases. The most challenging source of semantic heterogeneity comes from the diversity and inconsistency among naming conventions for genes, gene functions, biological processes and structures among differentspecies (or even within species). In recent years, significant progress in documentingthe semantic equivalence of terms used in the naming of biological concepts and partshas been made in the development of a range of biological ontology databases whichare coordinated under the umbrella of organisations such as the Open BiomedicalOntologies Foundry (www.obofoundry.org).Data IntegrationSoftware tools that solve aspects of the data integration problem have been developing for some time. The early approaches, which produced popular software such asSRS [4] used indexing methods to link documents or database entries from differentdatabases and providing a range of text and sequence-based search and retrievalmethods for users to assemble related data sets. The methods used by SRS (and related tools) address what we describe as the technical integration challenge.More recently, data integration approaches have been developed that “drill down” into the data and seek to link objects at a more detailed level of description. Many ofthese approaches exploit the intuitively attractive representation of data as graphs ornetworks with nodes representing things or concepts and edges representing how theyare related or connected. For example a metabolic pathway could be represented by aset of nodes identifying the metabolites linked by edges representing enzyme reactions.Data integration systems that exploit graph based methods include PathSys [5] orBN [6] and the ONDEX system [1, 7]. Both BN and ONDEX are available asopen source software. The methods presented in this publication are implemented aspart of the ONDEX system and their quantitative evaluation helps maximise the integrity of the ONDEX integration process.The integration of data generally follows three conceptual stages as illustrated inFigure 1: (1) normalising into a generic data structure in order to overcome predominantly technical heterogeneities between data exchange formats; (2) identifyingequivalent and related entities among the imported data sources to overcome semanticheterogeneities at the entry level, and (3) the data analysis, information filtering andknowledge extraction.In order to make the ONDEX system as extensible as possible, we have takenparticular steps to separate the second stage both conceptually and practically. Ourmotivations for doing this are that we wish to: preserve original relationships andmetadata from the source data; make this semantic integration step easily extensiblewith new methods; implement multiple methods for recognising equivalent data concepts to enhance the quality of data integration; support reasoning methods that makeuse of the information generated in this step to improve the quality of data integrationand facilitate the reuse of our methods. ONDEX therefore provides a convenient platform for evaluating different data integration methods which could be subsequentlyexploited by other software platforms as part their data integration workflows (e.g.Cytoscape [8], SemanticWebFolders [9]).Our hypothesis is that multiple methods for semantic data integration are necessarybecause of ambiguities and inconsistencies in the source data that will require
18J. Taubert et al.different treatment depending on the source databases. In many cases, exact linkingbetween concepts through unique names will not always be possible and thereforemappings will need to be made using inexact methods. Unless these inexact methodscan be used reliably, the quality of the integrated data will be degraded.In this paper we present a quantitative evaluation of three data integration algorithms that are used in the second data integration step (Figure 1): Accession basedmapping, Synonym mapping and an algorithm called StructAlign. These all use concept names in different ways to assign equivalences. The approach used in the firsttwo methods will be relatively obvious. The StructAlign algorithm, however, combines both information retrieval approaches and graph based analysis and will therefore be described in more detail. The three algorithms were chosen as progressivelymore flexible concept matching methods that were considered suitable for life sciencedatabases where concept names play a key role in defining semantics. A novel aspectof this paper is that the algorithms are evaluated in two representative contexts: theintegration and analysis of metabolic pathways, and the mapping of equivalent elements in ontologies and nomenclatures.To calibrate our data integration methods with well structured data, we use themapping of equivalent elements from the ontologies and nomenclatures extractedfrom the ENZYME [11] and GO [12] databases. To evaluate mapping methods in amore challenging integration task we use the creation of an integrated database fromtwo important biological pathway resources, the KEGG [13] and AraCyc [14]databases.Fig. 1. Data integration in ONDEX consists of 3 steps. 1) Importing and converting datasources into the generic data structure of ONDEX, 2) Linking of equivalent or related entitieswithin the different data sources, 3) Knowledge extraction in the graph based analysiscomponent.
Linking Life Sciences Data Using Graph-Based Mapping192 Methods2.1 Data Import and ExportFollowing Figure 1, the first data integration step loads and indexes data from different sources. ONDEX provides several options for loading data into the internal datawarehouse and a range of parsers have been written for commonly used data sourcesand exchange formats, see http://ondex.sourceforge.net/feats.php. In addition userscan convert their data into an ONDEX specific XML or RDF dialect for which generic parsers [15] are provided.The role of all parsers is to load data from different data sources into the genericdata structure used in the ONDEX data warehouse. In simple terms, this generic datastructure can be seen as a graph, in which concepts are the nodes and relations are theedges. By analogy with the use of ontologies for knowledge representation in computer science, concepts are used to represent real-world objects [16]. Relations areused to represent the different ways in which concepts are connected to each other.Furthermore, concepts and relations may have additional properties and optionalcharacteristics attached to them. A formal description of the ONDEX graph datastructure is presented in [1] and an XML and RDF representation is described in [15].During the import process, names for concepts are lexicographically normalised byreplacing non-alphanumeric characters with white spaces so that only numbers andletters are kept in the name. In addition, consistency checks are performed to identify,for example, empty or malformed concept names.Datasets integrated in the ONDEX warehouse can be exported into several standard exchange formats such as FASTA, GML, GraphML, RDF, SBML, XGMMLand XML. They can also be accessed programmatically through the API of the ONDEX system.2.2 Data Integration Methods and AlgorithmsThe second data integration step (following Figure 1) links equivalent and relatedconcepts and therefore creates relations between concepts from different data sources.Different combinations of mapping methods can be used to create links betweenequivalent or related concepts. Rather than merging elements that are found to beequivalent, the mapping methods create a new equivalence relation between suchconcepts. Each mapping method can be made to create a score value reflecting thebelief in a particular mapping and information about the parameters used. Thesescores are assigned as edge weights to the graph and form the foundation for the statistical analysis presented later. The information on edges additionally enables theuser to track evidence for why two concepts were mapped by a particular mappingmethod.We now describe the different mapping methods that will be evaluated in the latersections of this paper. This paper provides an extended and more formal account ofthese mapping methods, which were first mentioned without elaboration in [7] and[10] and this is the first time that a detailed evaluation has been reported.
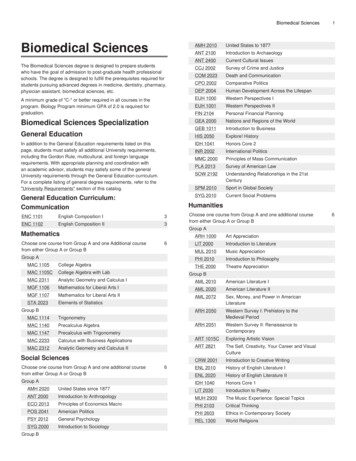
20J. Taubert et al.Accession based mapping: Most of the well-structured and publicly managed repositories of life science data use an accession coding systems to uniquely identify individual database entries. These codes are persistent over database versions. Crossreferences between databases of obviously related data (e.g. protein and DNA sequences) can generally be found using accession codes and these can be easily exploited to link related concepts. Accession codes may not always present a one-to-onerelationship between entries of different databases. References presenting one-tomany relationships are called ambiguous. Accession codes are indexed for betterperformance during information retrieval. Accession based mapping by default usesnon-ambiguous accessions to create links between equivalent concepts, i.e. conceptsthat share the same references to other databases in a one-to-one relationship. It is,however, possible to take one-to-many relationships into account for accession basedmapping but this feature was not evaluated in this study because accession basedmapping was required to establish a “gold standard” between data sources to identifytrue pairs of equivalent entries.Synonym mapping: Entries in biological databases often have one or more humanreadable names, e.g. gene-names. Depending on the data source, some of these nameswill be exact synonyms, such as the chemical name of an enzyme; others only relatedsynonyms, such as a term for enzymatic function. Exact synonyms are flagged aspreferred concept names during the import process. Related synonyms are added toconcepts as additional concept names and concept names are indexed for better performance during information retrieval. The default method for synonym mappingcreates a link between two concepts if two or more preferred concept names arematching. As a simple example of such ambiguity, the term “mouse” shows that consideration of only one synonym is not usually enough for the disambiguation of theword, i.e. “mouse” can mean computer mouse or the rodent Mus musculus. Thethreshold for the number of synonyms to be considered a match is a parameter forthe synonym mapping method.StructAlign mapping: In some cases, two or more synonyms for a concept are notavailable in the integrated data. To disambiguate the meaning of a synonym shared bytwo concepts, the StructAlign mapping algorithm considers the graph neighbourhoodof such concepts. A breadth-first search of a given depth ( 1) starting at each of thetwo concepts under consideration yields the respective reachability list for each concept. StructAlign processes these reachability lists and searches for synonym matchesof concepts at each depth of the graph neighbourhood. If at any depth one or morepairs of concepts which share synonyms are found, StructAlign creates a link betweenthe two concepts under consideration.Pseudo-code for StructAlign (see Figure 2): Let O denote the generic graph structure consisting of a set of concepts C (O) and a set of relations R(O) C (O) C (O) .Every concept c C (O) has two additional attributes assigned: a) a concept classcc(c) characterising the type of real world entity represented by the concept (e.g. agene), b) a controlled vocabulary cv(c) stating the data source (e.g. KEGG) the concept was extracted from. Every relation r R(O) is a tuple r ( f , t ) with f the“from”-concept and t the “to”-concept of the relation.
Linking Life Sciences Data Using Graph-Based Mapping21Fig. 2. Pseudo-code for StructAlign algorithmAssuming the search for a concept name in the indexed list of concept names takesconstant time, the algorithm has a worst case runtime of O (c 3 * log(c)) on densegraphs. Its average runtime on sparse graphs is O (c 2 ) .2.3 Graph Analysis and VisualisationData integration involving large data sets can create very large networks that aredensely connected. To reduce the complexity of such networks for the user, information filtering, network analysis and visualisation (see Figure 1, step 3) is provided in aclient application for ONDEX called OVTK [1]. The combination of data integration
22J. Taubert et al.and graph analysis with visualisation has been shown to be valuable for a range ofdata integration projects in different domains, including microarray data analysis [1],support of scientific database curation [17, 18] and scoring the quality of terms anddefinitions in ontologies such as the Gene Ontology [19].A particularly useful feature in the OVTK is to visualise an overview of the typesof data that have been integrated in the ONDEX system. This overview is called theONDEX meta-graph. It is generated as a network based on the generic data structureused in ONDEX, which contains a type system for concepts and relations. Conceptsare characterised using a class hierarchy and relations have an associated type. Thisinformation about concept classes and relation types is visualised as a graph withwhich the user can interact to specify semantic constraints – such as changing thevisibility of concepts and relations in the visualisation and analysis of the data network structure.2.4 Evaluation MethodsThe mapping algorithms presented in Section 2.2 can be configured using differentparameters. According to the selection of the parameters these methods yield differentmapping results. To evaluate their behaviour, we used two different test scenarios: themapping of equivalent elements in ontologies and the integration and analysis ofmetabolic pathways.The evaluation of a mapping method requires the identification of a reference dataset, sometimes also referred to as “gold standard”, describing the links that really existbetween data and that can be compared with those which are computed. Unfortunately, it is rare that any objective definition of a “gold standard” can be found whenworking on biological data sets and so inevitably most such evaluations required thedevelopment of expertly curated data sets. Since these are time-consuming to produce, they generally only cover relatively small data subsets and therefore the evaluation of precision and recall is inevitably somewhat limited.In Section 3.1 we describe the results of mapping together two ontologies; namelythe Enzyme Commission (EC) Nomenclature [11] and Gene Ontology (GO) [12]. Inthis case, the Gene Ontology project provides a manually curated mapping to theEnzyme Nomenclature called ec2go. We have therefore selected ec2go as the first ofour gold standards. We also consider the cross references between the two ontologiescontained in the integrated data as the second gold standard for this scenario.Section 3.2 presents the results from the evaluation of a mapping created betweenthe two metabolic pathway databases KEGG and AraCyc. Unfortunately, a manuallycurated reference set is not available for this scenario. We must therefore rely on thecross references between the two databases that we can calculate through our accession based mapping as the nearest equivalent of a gold standard for this scenario.3 ResultsWe have evaluated our mapping algorithms using the standard measures of precision(Pr), recall (Re) and F1-score [20]:
Linking Life Sciences Data Using Graph-Based MappingPr tptp fpRe tptp fnF1 232 Pr RePr ReThe accession based mapping algorithm (Acc) was used with default parameters, i.e.only using non-ambiguous accessions. This choice has been made to obtain a “goldstandard” through accession based mapping, i.e. increasing the confidence in therelations created. When evaluating the synonym mapping (Syn) and StructAlign(Struct) algorithms, parameters were varied to examine the effect of the number ofsynonyms that must match for a mapping to occur. This is indicated by the number inbrackets after the algorithm abbreviation (e.g. Struct(1)). We also evaluated a secondvariant of each algorithm in which related synonyms of concepts were used to find amapping. The use of this algorithmic variant is indicated by an asterisk suffix on thealgorithm abbreviation (e.g. Syn(1)*).3.1 Mapping Methods – Enzyme Nomenclature vs. Gene OntologyIn this evaluation our goal was to maximise the projection of the Enzyme Commission (EC) nomenclature onto the Gene Ontology. This would assign every EC termone or more GO terms. For the evaluation we used ec2go (revision 1.67) andgene ontology edit.obo (revision 5.661) obtained from ftp://ftp.geneontology.org.We also downloaded enzclass.txt (last update 2007/06/19) and enzyme.dat (release of2008/01/15) from ftp://ftp.expasy.org. The data files were parsed into the ONDEXdata network and the mapping algorithms applied usin
Linking Life Sciences Data Using Graph-Based Mapping 17 evident in a number of life science databases. The most challenging source of