Transcription
2020 Debit Issuer StudyCard-not-present debit use climbs sharplyamid changing consumer behaviors
“Basically, any merchant category that is 15 and under is ripe to replacecash with plastic because of contactless.”National Bank“We see big growth in month-over-month active cards for mobile wallets.Apple Pay is the largest in terms of number of transactions. This is the caseeven though we have more Android users than Apple.”Regional Bank“We have a healthy mix of simple P2P transfers and transactions for Uber,Lyft and other businesses.Credit Union”1
OverviewFor the past 15 years, PULSE has commissioned the definitive study of the debit market, the annual DebitIssuer Study. The 2020 Study was conducted in February through mid-March, 2020. As such, the metrics reflect2019 data, and thus a pre-COVID-19 business-as-usual operating environment.The COVID-19 pandemic is an extraordinary event – a crisis of global proportions unlike any in the past century.It has significantly impacted the global economy and, with it, the U.S. debit market. Debit transaction volumeplummeted 25 to 30% in mid-March as shelter-in-place rules went into effect and businesses closed. Volumeshave since rebounded to a large extent, and a number of market trends highlighted in this year’s Study resultsare expected to accelerate as a result of the pandemic. These trends include the migration of card-presenttransactions to card-not-present environments, greater adoption and use of contactless cards and mobilewallets, and an increase in the volume and complexity of disputes and fraud.This report addresses the key findings from the 2020 Debit Issuer Study. A special companion report by OliverWyman focuses on COVID-19’s impact on the debit market. This report, as well as pandemic debit trend data forthe PULSE network, is available on the PULSE Pandemic Response Resource Hub.Key FindingsCOVID-19 creates an uncertain futureThe COVID-19 pandemic has had a limited impacton debit, due to consumers making fewer but largerpurchases. But issuers are uncertain about howsoon – and how rapidly – the global, economywill recover. It’s anticipated, however, that thepandemic will accelerate trends identified by thestudy; namely, e-commerce growth and issuanceof contactless debit cards.one additional debit transaction per month, onaverage. In 2019, these cardholders performed 25.5transactions per month, excluding ATM activity. 1Industry-wide, an estimated 77.4 billion debittransactions were made in 2019, up 6.5% over theprior year. but is a tale of two channelsUnpacking the data reveals that debit is a tale of twochannels, with card-not-present (CNP) transactionsserving as the primary driver of growth, while cardpresent (CP) transactions declined on a per-cardbasis. Fueled by digital commerce, bill paymentsand account-to-account (A2A) funds transfers,2CNP transactions now constitute 27% of all debittransactions and are growing approximately 10Debit use continues to grow Debit experienced another strong year in 2019.Issuers’ core debit performance metrics continuedto improve, with year-over-year increases inpenetration, active rate and usage. Every year forthe past five years, active cardholders have made1 Includes purchases, bill payments and debit-based funds transfers.2 A2A transactions include: person-to-person transfers where debit cards are used in apps such as Venmo and Zelle;business-to-consumer “credit push” transactions, which are used to pay gig-economy workers and for other payouts;and consumer-to-business purchases and payments utilizing debit, such as through PayPal.2
2020 is the year of contactlessIssuers cited offering contactless debit cards astheir top priority for 2020. Encouraged by growingmerchant acceptance and a desire to deliver abetter customer experience and to keep up withcompetition, two in three issuers will be issuingcontactless debit cards by year-end 2020. Thenumber of contactless cards in the market willcontinue to grow, with issuers planning to have36% of all full-function (PIN and signature-capable)debit cards contactless-enabled by year-end, and aprojected 87% of cards by the end of 2022.times faster than CP transactions. This alreadyrapid growth has accelerated amid the COVID-19pandemic as a result of changing consumerbehaviors – behaviors that are likely to havestaying power even after the pandemic passes.Debit interchange accounts for 25% ofexempt issuers’ non-interest incomeDebit interchange is a significant driver ofeconomics, both at the demand deposit account(DDA) level and for an issuer’s non-interest feeincome. Issuers subject to Regulation II’s interchangerestriction received an average blended interchangerate of 23.6 per point-of-sale (POS) transaction,while issuers not subject to the restriction realizedan average rate of 40.3 per transaction (withbusiness debit cards generating significantlyhigher returns at 28.1 for regulated and 147.6 for exempt issuers). A typical regulated issuerreceives 74 per consumer card annually from debit,whereas an average exempt issuer earns 116. On anaggregate basis, debit interchange is a materialdriver for exempt issuers, generating approximately25% of their total non-interest income.Funds transfers are growing rapidlyAccount-to-Account (A2A) debit payments haveemerged as the fastest growing category ofdebit. A2A transactions doubled year-over-year,representing 40% of the industry’s total debittransaction growth. An estimated 2.4 billionA2A transactions were processed using debitnetwork rails in 2019, as debit evolved from apurchase capability to also include real-timemoney movement.Apple Pay pulls away from the other “Pays”Purchases using mobile wallets linked to debitcards totaled 1.3 billion transactions in 2019, withApple Pay pulling away from Google Pay andSamsung Pay, and posting 100% year-over-yeargrowth. Apple Pay outperformed its wallet peersacross cardholder enrollment, active rateand usage.Fraud remains a challengeIssuers cited fraud as their greatest challenge, as inthe past several years. They experienced 4.2 billionin gross fraud claims in 2019 and ultimately incurredover 1 billion in net losses on POS debit and ATMtransactions. However, not all transaction types arecreated equal in terms of fraud patterns. PIN POStransactions are the most secure, accounting for38% of POS activity but only 5% of gross fraudcases in 2019.3
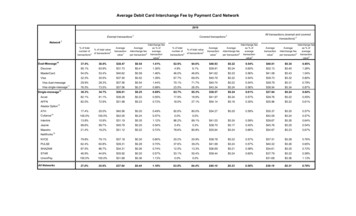
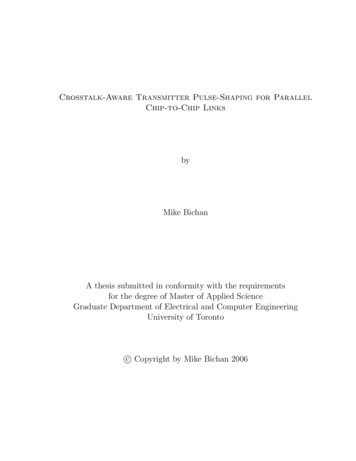
About the StudyThe Debit Issuer Study – commissioned by PULSE and conducted by Oliver Wyman – tracks the state of the industry,identifies emerging themes and opportunities, and provides performance benchmarks. This year’s Study is basedon primary research with 55 financial institutions that manage approximately 157 million debit cards, representingabout 42% of all U.S. debit transactions. The sample spans national banks, regional banks, community banksand credit unions (Figure 1). Issuers are also segmented into Regulated and Exempt categories based on theirstatus with regard to Regulation II interchange restrictions. Given the Study’s size – and the distribution offinancial institutions by segment, geography and network participation – the sample is sufficiently broad andbalanced to be reflective of the debit industry.Figure 1Composition of 2020 Study sampleSegment ( assets)Number of FIsSegmentNumber of FIsNational Banks ( 100 Bn)14Regulated31Regional Banks ( 10 Bn - 100 Bn)15Exempt24Community Banks ( 500 MM - 10 Bn)17Credit Unions9Total55Total554
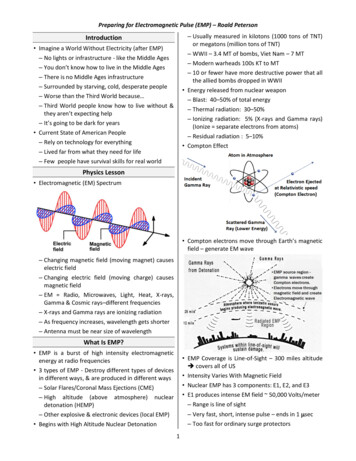
COVID-19 Creates UncertaintyCOVID-19 has uprooted almost every aspect of everyday life, including banking, retail sales and payments.Beginning in mid-March 2020, the pandemic has significantly impacted the U.S. debit market, causing materialchanges in transaction activity.Spending initially surged as consumers stockpiled on staples and other goods. Subsequently, transactionsplummeted by 25 to 30% as shelter-in-place rules went into effect and businesses closed. Volumes then largelyrecovered, supported by the fiscal stimulus and actions by various states to reopen certain sectors of theireconomies (Figure 2).Debit TransactionsFigure 2COVID-19 impact on debit transactions, 2020SurgeMarch 11 - 18Surge in debit spend as consumersstockpile in response to variouspublic announcements2CollapseMarch 18 - early AprilAs shelter-in-place rules go intoeffect and businesses close,debit spend plummets 25 - 30%1BAUJan - March 11Debit market expandingin line with historic normsJanuaryMarch 18 peak64PlateauEarly - mid AprilDebit spend stabilizesat new lower run-rateDebit OutlookPost May 1*Numerous uncertaintiesfor debit’s future3RapidReboundGradualGrowthStimulusApril 15 - May 1Direct stimulus payments to individuals; first direct depositshit on 4/15 (smaller waves on 4/22 and 4/29)5Change in merchant mix, change in spend profileSlowSlideMay* Future outlook as of completion of data gathering for Oliver Wyman COVID-19 report.The pandemic is transforming all aspects of the debit business, contributing to a number of first- and secondorder effects.First-order effects include growth in certain merchant categories (e.g., grocery, warehouseclubs, etc.) and a decline in others (e.g., QSR/restaurants, travel, etc.). Issuers have also experiencedan accelerated migration from CP to CNP, driven by a surge in e-commerce as stores close andconsumers look to shop from the safety of their homes.Second-order effects include changes in card use – consumers are making fewer but largerpurchases; the average ticket for debit increased by 12 to 14% in April. Additionally, COVID-19has led to lower card issuance: with branches closed, the rate at which financial institutions canacquire new cardholders – and issue new debit cards – has been severely curtailed.Ultimately, these first- and second-order effects could impact issuers’ overall debit economics.5
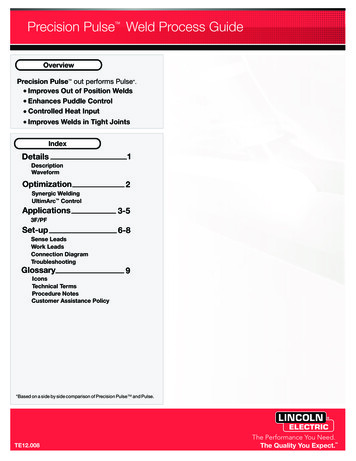
Debit KPIsKey performance indicators (KPIs) for debit issuers continued to improve in 2019, with year-over-year increasesacross penetration, active rate and usage. At an aggregate level combining both consumer and business debitcards, penetration increased from 78.1% in 2018 to 79.5% in 2019, and the average active rate increased from67.1% to 68.2%. On average, cardholders performed 25.5 transactions per active debit card per month in 2019,excluding ATM activity, reflecting an increase in usage of about one monthly transaction every year since 2015(when 21.9 monthly transactions per active card were performed). A typical debit card is now used for about 12,400 in annual spend, with an average ticket size of 40.50 (Figure 3).Figure 3Change in Debit KPIs, 2018-19(aggregate consumer and business portfolio)PenetrationActive RateUsageCard brand% of TransactionsAverageTicket SizeAnnual Spendper Active Card201979.5%68.2%25.564.1% 40.50 1%24.864.2% 39.70 11,684Measures debit card prevalence and frequency of use;transaction volume is the main revenue driverfor regulated issuers post-Reg IIMeasures spend and transaction type on debit cards,which remain important metrics for exempt issuersKPI DefinitionsPenetration is the percentage of an issuer’schecking account base that can be accessed bya debit/ATM card. Penetration only measureswhether at least one card is tied to an account;multiple debit cards tied to a joint account do notinfluence the metric.Card Brand Percentage of Transactions is theratio of card brand transactions to total POStransactions, and is also referred to as “transactionmix.” The change in terminology to “card brand”and “EFT” reflects the increasing convergencebetween the historic labels of “signature” and “PIN”that were used previously in the Debit Issuer Studyand the expanding capabilities of EFT networks.Active Rate is the number of issued cards thatare consistently used by cardholders. The activerate is defined in multiple ways by issuers, basedon the transaction type and time frame. The mostcommonly used definition measures cards usedfor any transaction within the past 30 days.Average Ticket Size is the ratio of transactiondollar volume to number of transactions. The ticketsize shown here is the blended average of cardbrand and EFT transactions.Usage is monthly transactions per active card,including purchases, bill payments and A2Amoney transfers.Annual Spend per Active Card is the averageannual gross dollar volume for an active card.6
“Best-in-class” issuers – defined as those in the top quartile for a given KPI – significantly outperformed those inthe lower quartiles in both penetration and active rate. In penetration (Figure 4), issuers in the top quartile achievedan average penetration of 88% in 2019, compared to 64% for the bottom quartile. In active rate (Figure 5),top-performing issuers achieved an average of 78%, compared to 56% for the bottom quartile. A quartile analysisis not provided for usage rates because the difference in performance by quartile was not significant.Figure 4Figure 5Overall penetration (consumerand business) by quartile, 2019*88%1stAverage79.5%74%3rd64%4thActive Rate (based on POSactivity) by quartile, 2019*Excludes cards that are only usedfor ATM transactions (2.9%)81%2nd78%1stAverage68.2%56%4th67%3rd70%2nd* The value shown for each bar represents the median within the 2019 quartileAt a portfolio level, business and consumer cards exhibit different behavior – business cards represent only 8%of all debit cards and have higher average ticket size and spend, whereas prevalence and frequency of use arehigher for consumer cards. Therefore, these portfolios warrant tailored approaches from financial institutions.Total debit transactions for the industry grew by 6.5% in 2019 (Figure 6). This was mostly driven by greaterper-card usage (transactions per active card grew by 3.1% year-over-year), with the remainder of the growthcoming from increases in the active rate and card base, which grew by 1.1% and 2.3%, respectively.Figure 6Debit card transaction growth sources, 2019Active Rate and Card Usage aredirectly influenced by actions takenby debit card managersGrowth inCard Base1.1%2.3%Growth inActive Rate3.1%Growth inTransactionsper Active CardGrowth due to FI initiatives to acquire DDAs; debit cardmanagers have limited control over this metric7OverallTransactionGrowth6.5%
Transaction MixIssuers are continuing to shift their focus away from the historic labels of “signature” and “PIN” debit, and areinstead more interested in tracking the vector of use: card-present (CP) versus card-not-present (CNP) transactions.This is because there is a clear – and growing – divide between CP and CNP debit activity.As cardholders’ day-to-day lives are becoming increasingly digital, this directly impacts how they pay. As a result,CNP transactions were the primary driver of debit card growth in 2019, increasing 21.3% year-over-year – roughly10 times faster than the growth rate of CP transactions (Figure 7).With the closure of more than 93,000 retail locations3 in 2019 and the increase in cardholder preference foronline purchases, CP debit transactions declined year-over-year by 1.1% on a per-card basis to 18.6 monthlytransactions in 2019 (Figure 8). However, this decline in per-card usage was offset by 2.3% growth in issuers’overall card base and 1.1% growth in the average active rate, contributing to an overall growth in CP transactionsof 2.3%. As a result of these factors, CNP transactions accounted for 27% of all debit transactions and 40% of debitdollar volume in 2019. These percentages are expected to rise further in 2020 as a result of the pandemic.Figure 7Figure 8Card-present vs. card-not-presentKPIs, 2019Card-present(CP)Card-not-present(CNP)Monthly transactionsper active card18.66.9Transaction mix73%27%Transaction growthrate (2018-2019)2.3%21.3%Average ticket size 34.10 61.48Annual spendper active card 7,611 5,09160%40%Volume mixCard-present vs. card-not-presentusage, 8CP18.6Card-present20182019Change3 “25,000 stores are predicted to close in 2020,” CNBC.com, June 9, 2020.8 16%-1%
EconomicsDebit interchange is a key driver of both DDA revenue and overall non-interest income for issuers. For regulatedissuers (those with 10 billion in assets), the key metric that drives debit revenue is the number of transactions;for smaller issuers that are exempt from Reg II’s interchange cap (those with 10 billion in assets), debit revenueis more heavily influenced by total debit spend due to higher average interchange rates.Exempt issuers receive higher interchange rates on a per-transaction basis. Their overall blended averageinterchange rate is 40.3 , whereas regulated issuers receive 23.6 per transaction on average. For exemptissuers, the interchange rate also varies dramatically between consumer and business cards, receiving anaverage interchange of 35.5 and 1.48 respectively.Due to these differences in interchange rates, exempt issuers receive gross revenue of 116 per active debitcard per year, whereas regulated issuers receive 74 per active card. Interchange revenue subsequently impactsdebit’s overall contribution to an issuer’s non-interest fee income. On an aggregate basis, debit interchangerepresents a material source of revenue for issuers, accounting for 6% of non-interest income for regulatedissuers and about 25% for exempt issuers (Figure 9).Figure 9Importance of debit interchange revenue, 2019Debit interchange contribution to non-interest income5%National Banks1%8%8%Regional Banks1%18%24%Community Banks9%32%27%Credit Unions15%34%6%Overall1%0%34%Reported Range9Weighted Average50%
Debit FraudFraud is an ongoing challenge for debit issuers. In 2019, issuers faced 4.2 billion in gross (attempted) fraudand ultimately incurred losses of over 1 billion on debit and ATM transactions.Fraud patterns vary significantly based on how a debit card is used – for example, CP versus CNP, and with orwithout cardholder verification. Also impacting these patterns is the fraud lifecycle flow. Factors such as thedecline rate, dispute denial rate and chargeback efficiency vary for different transaction categories.CP with PIN transactions are the most secure, accounting for 38% of POS transactions but only 5% of grossfraud cases. CNP transactions are the least secure, accounting for 27% of debit transactions but 70% of grossfraud cases. Although these claims may not necessarily translate to a high dollar value of net fraud losses forissuers, they still require substantial time and resources to process and decision appropriately. Hence, CNPtransactions, which have the highest incidence of gross fraud claims per million POS transactions (1,803),represent a major operational cost for issuers.When looking at denied claims, CP with PIN transactions have significantly higher denial rates from issuers (37%)than CP without PIN and CNP transactions (21% each). Because cardholders have to physically enter a PIN toauthenticate a transaction, they have a lower likelihood of proving PIN compromises and hence face a higherrate of denials from issuers.In terms of chargeback efficiency, chargeback rights are the most favorable to issuers on CNP transactions.Merchants have a higher liability for CNP transactions based on current network rules. As a result, issuers recovera greater percentage of losses from merchants on these transactions (51%). Conversely, PIN fraud significantlylimits an issuer’s chargeback rights (16% recovery).The type of transaction also has a significant impact on the average net loss rate experienced by issuers. CPwithout PIN and CNP transactions generally do not include cardholder authentication, and hence have highernet loss rates of 1.2 and 1.8 per transaction, respectively. CP with PIN transactions, on the other hand, benefitfrom enhanced security due to PIN authentication, leading to the lower average net loss rate of 0.6 pertransaction (Figure 10).Figure 10Gross vs. net fraud losses by transaction type, 2019POS: CP with
Debit interchange accounts for 25% of exempt issuers’ non-interest income Debit interchange is a significant driver of economics, both at the demand deposit account (DDA) level and for an issuer’s non-interest fee income. Issuers subject to Regulation II’s interchange restriction