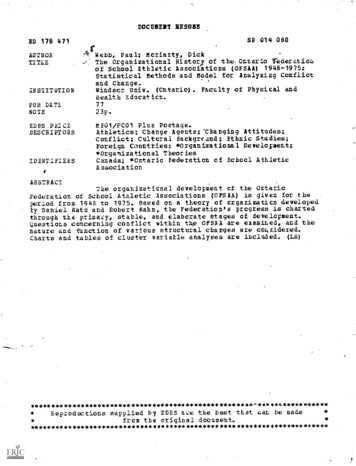
Transcription
DOCUSENT NEMOSP 014 080ED 178 471AUTHORTITLEINSTITUTION.V'Webb, Paul; Moriarty, DickThe Organizational Histou of the.Ontario Mderatioaof School Athletic Associations (OFSAA) 1948-1975:Statistical Methods and Model for Analyzing Conflictand Change.Windsor Univ. (Cntario). Faculty of Physical andHealth Education.PUB DATENOTE7723p.EDRS PRICEDESCRIPTORSMF01/PC01 Plus Postage.Athletics; Change Agents;Thanging Attitudes;Conflict; Cultural Backgrcand; Ethnic Studies;Foreign Countries; *Organizational Development;*Organizational TheoriesCanada; *Ontario Federation of School AthleticAssociationIDENTIFIERSABSTRACTThe organizaticnal development et the OntarioFederation of School Athletic Associations (OFSAA) is given for theperiod from 1943 to 1975. Based on a theory of organization developedty Daniel Katz and Robert Kahn, the Federation's progress is chartedthrough the primary, stable, and elaborate stages of development.Questions concerning conflict within the OFSAA are examined, and thenature and function of various structural charges are co4sidered.Charts and tables of cluster variable analyses are included. ************4***********Reproductions supplied by EDES al:e the best that can be madefrom the original ******************************
*Vr-4Nft-4-THE ORGANIZATIONAL HISTORY OF THE"ONTARIO FEDERATION OF SCHOOL ATHLETIC ASSOCIATIONS (DFSAA) 1948-1975:STATISTICAL METHODS AND MODEL FOR-ANALYZING CONFLICT AND CHANGEa"PERMISSION TO REPRODUCE THISMATERIAL HAS BEEN GRANTED BYTO THCEDUCATIONAL RESOURCESINFORMATION CENTER (ERIC)."1) S DEPARTMENT OF HEALTH,FM/CATION WELFARENATIONAL INSTITUTE OFEOUCTIONIpiS DOCuMk NT HAS BEEN REPRO-DUCED E XACTLY AS RECEIVED EROXIXT Hk PE RSON OR CAGAENIZAT1ON ORIGIN-POINTS OP viEIN OFI.OPINiONSATI D DO NOT NECESSARILY REPRE--TfNC. f T'sk #T ()F f IL 1AL NAT IONAL INST1TU k: OFch'( AT cON PON!) ION OR POI I( YbyPaul Webb, M.H.K. and Dick Moriarty, Ph.D.University of TJindsorTqindsor, Ontario, Canada2
1Times have changed and the realizition.has grown that there is aneed to have a greater understanding of Canada and its historicaldevelopment.In 1958there was the feeling that Canada lacked a nationalhistory and feeling of the past.lie have as yet no national history, and no genuine conEven our political biography.is sparsesciousness of th past.because Canadian statemen have succeeded in shrouding themselves.What is needed is positive direction in allin obscurity.fields in historicalwork, archives, libraries, publications,exhibitions, and commemorations.1.This resulted in a cause-effect situation.By 1977, there appearedto be a change in direction in this situation due to a greater interestin Canadian studies which hal; developed over the previous twenty years.There is probably no more active area of curriculum develop7In the,social science andment in Canada than Canadian studies.social studies areas there is substantially more Canadian contentand orientation than there was a few years ago. There has beena perceptible increase in the teaching of Canadian literature,music, and art and in interdisciplinary studies. Despite perennialeconomic and foreign ownership problems, there is a cultural boomin the production of Canadians in all the media.It is timely therefore to undertake a study of the organizationalgrowth and development of the Ontario Federation of School AthleticAssociations.The authors hope that a greater understanding may bedeveloped of this sporting orgasization in particular and other schoolsporting orgahizations in general which have their rocits in Canada.Statement of the ProblemThe purpcse of this study is to investigate and analyze, quantitatively,and oualitatively, the.organizational history of the Ontario Federationof School Athletic Associations (OFSAA).Furthermore, this study willattempt to determine whether OFSAA's organizational history follows thesame stages of growth or cycles of conflict asthe organizations studied3
by Daniel Katz and Robert Kihi,3and Ralph 1.14 Stogdell,4respectively.These studies weie based mainly on business and kovernment organizationstudies.Katz and Kahn5developed the concept that eath organization-passesthrough distinct stages of development -- the Primary stage, the Stablestage and Ae Elaborate stage.The Primary StageCommon people with a common goal working co-operatively for a coisponcause.A general grouping of,people coming together setting a goal andmeans for the organization.The major sub-system is Production or Service'for the primary beneficiaries of the organization.The Stable StageThe difference between the Primary and the Stable Stage is that anumbrella form of matagement,has now come into being.There is a needfor a reliable performance and effective co-ordination of roles.AManagement subsystem evolves centering on authority structure and/orstrong leadership;A Maintenance subsystem deve*lops for socialization,administering rewards and sanctions, and.mediating between the demandsof the member institutions and the requirements Imposed by the beightenedproduction structure.The interface of maintenance and tightenedproduction service clashes with individual needs and produces an informalstructure.The Elaborate StageAn Elaborate organization develops as a resat of the interactionof the management system with the environment leading to the developmentof Boundary and Adaptive subsystems.The Boundary subsystem is aimed at
procurement, disposal and public relations structures.The Adaptive sub-system conditions the organization to the changing eavironment throughgathering information, research and planning for future development.6After twenty years of intense empirical research on a wide rangeof organizations and leaders including economic (businesses), maintenance(hospitals), Rflph M. Stogdell and his colleagues in the Ohio StateLeadership Institute came to the conclusion that organizations and thoseinvolved in them are quite similar in time and over-time.7Stogdelland his associates confirmed the theory that:.Organizations, if they survive for any length of time,exhibit cyclical periods' of growth and decline. They oftenexperiehce difficulties and hardship in the early stages ofdevelopment, then exhibit a period of revitalization,reorganization and growing achievement. After reaching-aperiod of peak achievement, they begin to weaken and experienceUnder Extreme leterioration they eitherserioui difficulties.dissolve, are absorbed, or become rejuvenated and start a newcycle.8Significant Ouestions to be Lxvestigated1.Does OFSAA's organizational hlstory follaw the same patterns ofgrowth or cycles of conflict as the organizations studied by Katzand Kahn, and Stogdell?2.What were the significant problems encountered by the members ofOFSSA throughout its growth and developMent?3.Was organizational conflict present within OFSSA, and if so what orwho caused it?4.Did OFSSA change organizationally, and if so what caused the change?5.What contribution does the SIR qpdel and CAR methodology make to.cthe study of organizational history whcn applied to a secondaryschool athletic association such as OFSSA?541.
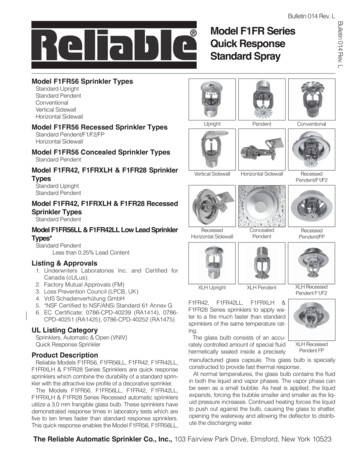
4Research ModelThe research model utilized for the organizational analysis in thestudy is a modification of the molar reSearch.model conceptualized byMoriarty in his study of the CIAUC.9This model can be regarded as:An holistic model incorporating as causal variables both the-humanistic, psychological, and socially induced behaviour, as10well as the technological and situationally expedient behaviov.The molar research model in Figure 1.0 (Molar Research Design)consists of three dimensions:rff1.The nanothetic, structural, situational dimension.2.Te idiographic,, lieople, personal3.The trends, conflict identification and management of changepositional dimension.dimension.Thenanothetic or organizational dimension examines the task,structure and control.The idiographic, personal dimension studies the-admtnistrator in terms of traitsthe situation, and behaviour as,decision-maker and group leader.External variables (society) andinstitutional 'Variables (associations and/or schools) are cbnsideredonly insofar as they affect the intraorganizational focus of attention,QFSSA.e,'An holistic molar longitudinal model does not lend itself to thesame Analysis And presentatirm techniques as a fragmented micKosectionalmodel analysis and presentation technique.11The comparative analysismodel lends itself to a two-axis analysis and presentation:Axis 1the vertical variable axis which fotuses on (1) ultimate goal(or mission); (2) the interaction of events such as task, structure andcontrol with (3) individual's and group's traits, slituation and behaviour;precipitating (4) problems, issues or obstacles in the form of conflict
5Nomotbetic - TinesSituational rganizational HistoryTime SequencesTime A.Time DTime CTime BTime NTask5. Social StressMedia8. RestrStructureontrol3.1. Ultimate Goal-2. Conflict/Proble7.9. Reali.4. Individuals diographic and GroupsPersonal - PositionalExternalInternalEvaluationFigure 1.0EvaluationMolar Research Design for Organizational History7
6behaviour frequently augmented by (5) social stress fram outside of the.organization and (6) constituent strain from within the organizationleading to (7) recommended alternate management techniques aimed at(8) realigned structure and (9) reorganized individuals and groups leading to (10) "change and trend.This is a cyclic process which returns atthis point to (1) ultimate goal.Axis 2 - the horizontal ttne sequence axis - deals with idhntification of eras or stages of organizational growth and development.This is achieved by analyzing the qualitative data in the foltwing manner:1.By looking at the long term growth or decline occurring within thedata2.Seasonal variation, or the more or less regular movement within thetwelve month period3.Cyclical movement or the swing from prosperity through recession,depression, recovery, and back again to prosperity4.Residual, accidental or random variations including such unusualdisturbances as wars, disasters, strikes, fads or other nonrecurringfactors.12T4quantitative dnta then gives the clusters of eras of development.This is achieved through cluster analysis.The vertical axis provides for analysis and presentation of threebasic clusters of organizational analysis:1.the chronicle of events such as task (or aims), ,structure (or-organization) and control (or administration)2.13analysis of inctividuals or groups in institutions in terms of traits(or characteristics), situation (or roles), and behaviour (orexpectations) and
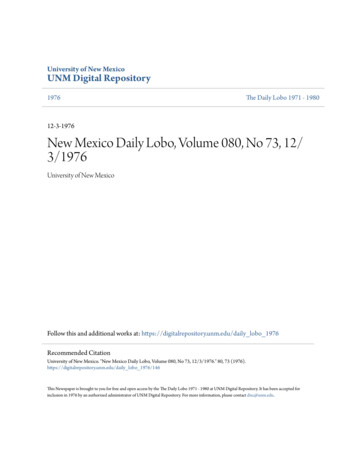
3.the relationship of ultimate goals (or mission) and means in terms.of-conflict resulting from social streas or constituent strainleading ultimately.to recommended changes and trends.Emphasis in the vertical axis as on ,the analysis of the interfaceof'organizatfonal events and institntion, individuals and groups, socialstress and conatituent strain (independent - predictor or drive variable)as they produce conflict, determine change and result in trends(dependent - criterion or reaction variables).14The horizontal.timeaxis provides for analysis and,presentation of the basis of clusters ofdata identifying eras or stages of growth and development with specificfocus on the present and future.15Selection of eras on the longitudinaltime sequence axis is based on:1.empirical observation of the constitution of the organization,movement of individuals and conflict areas and alSo2.organizational theory identifying cycles of conflict and patternsof growth and development.16Cluster AnalysisCluster analysis was the statisticaPresearch technique employedin determining the stages of growth of,OFSAA.tative meats of analS7zing the data.This provided the quantirThe variabys used were the numberof members of the Legislative Council, the number of sports, the numberof regions, the number of schools, the numbPr of school children anda deflated budget.The deflated budget represented the total revenuetaking into account the consumer price index, Lie., allowing for inflation.The variables and their values are given in Table 1:Variables).(The Cluster AnalysisFor example, in 1952 the number of members of the Legislative9
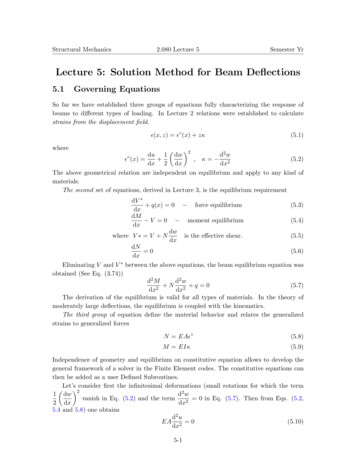
a-814VCouncil %/is twenty (20, the nuaber of sports was four (4). thanuaber of-regions was seven (7), thenumber of schools Was three hundred and fifty.-six (356); the number Of people .(Schobl children) ims one hundred'andfaltr-one thousand and.,ninetyone (141,041). and the deflated budget wassix thousand six hundred and fif.ty-two dollars ( 6652).A cluster is a'set.of entities which are alike, and entities fromdifferent clusters are not alike.17The clusser analysis techniquebegins by forming one cluster for each observati*on in the analysis.Thetwo closest clustersare combined into one cluster, then the two closestof the new set of clusters are combined into a cluster, and so forth.18The cluster analysis technique analyzed OFSAA with the years asthe dependent variable (criterion or reactor) and the number of membersof the Legislative Council, the number of sporis, the number of\regions,the number of schools, the number of school children and a deflatedbudget as the independent variables (drivejor criterion).map (see Figure 2:variables.The clusterCluster Map of OVSSA) showed the tlusters Of theseFor example, the biggest break in the cluster ma0 appearedbetween 1962 and 1963, followed by 1968-1969 and then'1957 and 1958.This enabl(ld the researcher to determine the stages of growth of OFSAA.With the cluster map is a cluster table (see Table ltAnalysis Variables).performed.The ClusterThis map is a sumnary of the cluster analysisFor each step, it' prints the number of clusters; tiae maximumdistance between two observations in a cluster, called the maximum diameterof a cluster; the number of distances within clusters (these are all lessthan the maximum diameter); the total number of distances less than themaximum diameter; and the ratio of the lcst two quantities.
aS T A.TiSTIC-4L4,LYSIS SYSTIYAv,aAirCLUSTER,ANALYSISMAXIMUM DISTANCENUMFIER nFWITtIIN A. 71937*70.655160 .5 1.1nooh9:58 TwOrs15Y. JuNE -10 1971sr St tr.mANALYSIST'AT 1 ST 1C.AL.3166667394?576770942417502654.208.0000000 .541673222.3.8o003U.750000.7697312131874.6 33 -412030605284352.0000053696253440. 'oiooa7MAVMUM.0504 ALL01-8796527616.00030.WONUMBER OF DLSTANCE5NUMBER 11F DISTANCESWITHIN 01 MAXIMUM0.00%1002410, 197711;P:9158 TI4.1175,4Y.2CLUSTER 11959554* 0* ****505*******0005*5#5**50005* 55.55********4*******5******555.512***********11s5 5****************5****Ivess*****41*******s***loso 550555***5*** 4555************10010**S00 0********105**05500 555 -,******************* . *05***09**v****57111196.'060**************6*5 *54********505**********************05055#1056 ***************Sev******** *551***** *if451Figure 2Cluster Map of OFSAA
*Vs Table 1THE CLUSTER ANALYSIs VARIABLESSTATISTICAL ANALYSIS SYSTEM9:59 THU0SOAY. JUNE 30. 1977DISTANCLS 11ITHIN A10 BETWEEN,CLUSTERSMAXIMUM f AVERAGE / MINIMUMNUMHER 0021646473209.905901748992.1005657231360.0001231 ATISTICALA.4.4 001112240.0009:58 1"!.UP.1)6v.ICLUSTER L 1ST I NGCLUSIC9COUNCILSPOPTS4.01 S5720.020.020.020.022.022.0ME .07.07.09.09.09.01 19661407176830. 030. 0A,6.052.052.052.09.09.09.09.09.012.01952;331I 9721i73.11741 .06711.011711 .074 .015.0433.0 ').0436026.0463735.0500807.14'.111c.51.19773
11If a specific uumber of clusters is given, the procedure will printthe minimum, average, and maximum distances within and between clusters;a listing of the observations within each; and the means of the variableswithin each cluster (see Table 1:The Cluster Analysis Variables).19For example, the first cluster has six years (points), a maximum distancewithin the cluster of 4026306304, an average distance of 1146038598400and a minimum distance of O.For the first computer program no specific number of clustei's wasspecified.The author analyzed the printout and found the biggedt breaksin the cluster map to be between 1962 and 1963, 1968 and 1969 and 1957and 1958 in that order.On this basis the stages of grawth weredetermined as 1952-1957, 1957-1962, 1963-1968 and 1968-1975 (see Figure 2:Cluster Map of OFSAA).The most notable break was between 1962 and 1963,followed by 1968 and 1969 and then 1957 and 1958.This quantitativsanalysis was substantiated by the audio interviews and content analysisbut was more definitive and discrete.The Stages of Growth of the Ontario Federation of SchoolsAthletic Associations (OFSAA) as Determined by Cluste
in determining the stages of growth of,OFSAA. This provided the quantir. tative meats of analS7zing the data. The variabys used were the number. of members of the Legislative Council, the number of sports, the number of regions, the number of schools, the numbPr of school children and a defla