Transcription
2020 Fact Book / Almanac
Table of Contents3 Academic Major Fields of Study6 Athletics9 Class Size12 Cohort Characteristics17 Comparative19 Enrollment23 Faculty25 Grading28 Graduates / Graduation30 Retention / Graduation Rates33 Online Enrollment34 Student Body Sociological Profile
3Academic Major Fields of Study Ten majors (with at least ten declared students in 2019) in the TUG program showed aone-year growth in enrollment of at least 10%:Criminal Justice Administration -97.0%(33 to 65)Nursing Intended (ASN) -72.2%(18 to 31)Communication Studies -32.0%(25 to 33)Biology -31.9%(72 to 95)International Business -30.0%(20 to 26)Accounting -21.1%(19 to 23)Theater Arts -18.2%(11 to 13)Sport Management -15.2%(33 to 38)Graphic Design -13.0%(23 to 26)Marketing -12.5%(24 to 27)14 TUG majors (with at least ten declared students in 2019) showed a one-year declineof at least 10% in enrollment at the end of spring 2020:English --56.0%(11 from 25)Nursing (ASN) --36.3%(65 from 102)American Sign Language --32.3%(21 from 31)Sociology --31.6%(13 from 19)Business Administration --27.7%(60 from 83)Exercise Science intended --25.0%(21 from 28)Political Science --23.1%(10 from 13)Chemistry --21.4%(11 from 14)Discipleship Studies --20.0%(12 from 15)Elementary Education --15.6%(38 from 45)Healthcare Management --14.3%(12 from 14)Economics/Finance --13.0%(20 from 23)Sport Education --11.1%(16 from 18)Nursing (BSN) --10.7%(92 from 103) Two TUG majors (Spanish Education, English as a Second Language) had no declaredmajors. Three majors (Birth-Kindergarten Education, World Languages, Literatures andCultures, Wealth Management) had one student enrolled while Philosophy and Theologyand Music Performance each registered two students. Three non-traditional undergraduate majors showed one-year increases:Nursing (Accelerated BSN) -200.0%(14 to 42)Elementary Education -113.3%(30 to 64)77.8%(18 to 32)Birth-Kindergarten Education - Eight non-traditional undergraduate majors had a one-year decrease in excess of 10%:Religious Studies --81.8%( 2 from 11)Criminal Justice --43.3%(34 from 60)
4 Business Administration --41.9%(36 from 62)Human Services --32.8%(84 from 125)Healthcare Management --22.5%(31 from 40)Nursing (RN-BSN) --20.2%(87 from 109)Accounting --16.9%(59 from 71)MIS / CISS --11.5%(23 from 26)The following graduate majors saw a one-year increase in excess of 10%:Business Administration (10-Month MBA) - 250.0%(32 to 112)Pastoral Care/Counseling (SOD – DMin) -42.9%(14 to 20)Business Administration (DBA) -41.7%(12 to 17)Pastoral Ministries (SOD – DMin) -25.0%(16 to 20)Sport Science -20.0%(15 to 18)Three graduate majors have realized a four-year increase in excess of 60%:Physician Assistant Studies -100.0%(52 to 104)Nursing (DNP) -86.2%(29 to 54)English -81.8%(11 to 20)Quotable“The CJAD major has some exciting opportunities waiting for students! Our Crime SceneInvestigation (CSI I & II) courses, taught by an experienced investigator, includes crime scenes laid outfor students to investigate, collect evidence, and solve crimes. A mock trial and scientific lab experiencecomplete the criminal justice process for these courses. Our legal courses are taught by a former policeattorney with first-hand experience of interacting with law enforcement officers. As students progressthrough the criminal justice curriculum, CJAD professors guide their educational journey of advisingthem in selecting courses in their areas of interest that might include terrorism, intelligence gathering,homeland security, cybercrime, international issues in public safety, organized crime, and much morethat will prepare students for a career in the 21st Century criminal justice system.”Dr. Bobbie Cox, Chair, Department of Public Service and Associate Professor of Criminal Justice“The College of Health Sciences faculty and staff are committed to staying abreast with trends inhealthcare education. We strive to co-create and implement programs that are competitive with otherstate and national Health Sciences programs. I am thankful for the high-performing teams within theCollege of Health Sciences and their willingness to seek “Joyful Work” daily!”Dr. Nicole Waters, Associate Provost of the College of Health Sciences“Several factors contributed to the increase in the DCP elementary education and BK programs:The implementation of the Teacher Assistants to Teachers Scholarship program, the excellentperformance of our candidates on teacher education exit examinations, the impeccable reputation ofthe GWU educator, and the knowledgeable and student-centered faculty and staff.Dr. Prince Hycy Bull, Dean/Professor School of Education
5Enrollment Count by Academic Major, CertificationTRADITIONAL UNDERGRADUATE USCATTRWLLCEDUCBUSNWLLCWLLCMAJORBiologyNursing BSNPsychologyCriminal Justice AdminNursing ASBusiness AdministrationExercise ScienceSport ManagementElementary EducationCommunication StudiesNursing Intended AAMarketingInternational BusinessGraphic DesignAccountingAmerican Sign LanguageExercise Science IntendedEconomics/FinanceEnglishComputer ScienceJournalismComputer Information SystemsSport EducationMusic EducationManagementSociologyTheatre ArtsDiscipleship StudiesChemistryHealthcare ManagementGlobal StudiesPolitical ScienceHistoryMusic w/ Emph Bus/Mus IndustryMathematicsPhysical Education & Health EdYouth Discipleship StudiesMissiologyMiddle Grades EducationMusicArt BAMusic CompositionWorship LeadershipBiblical StudiesSpanishArt BFAPhilosophy and TheologyMusic PerformanceAthletic TrainingWorld Langs, Lits & CulturesBirth‐Kindergarten EducationWealth ManagementSpanish EducationEnglish as a 2nd REDUCRELIRELIEDUCNON‐TRADITIONAL UNDERGRADUATE PROGRAMMAJORNursing RN‐BSNHuman ServicesElementary EducationAccountingNursing ABSNBusiness AdministrationManagementCriminal JusticeBirth‐Kindergarten EducationHealthcare ManagementComputer Information SystemsElementary Education LISCFire Service AdministrationOrganizational LeadershipChristian MinistriesReligious StudiesPhysical Ed & Health Ed SNBUSNBUSNRELINURSEDUCBUSNBUSNBUSNBUSNGRADUATE PROGRAMSMAJOREducational Leadership EDDSchool Administration CERTExecutive Leadership Studies MACurriculum & Instruction EDDBusiness Administration 10 Month MBAPhysician Assistant Studies MPASBusiness Administration MBANursing MSNOrganizational Leadership EDDTeacher Leadershp in Curr Inst MAAccounting MACNursing DNPPrimary Care Family Nurs Pract MSNPastoral Care and Counseling MDVPrimary Care Family Nurs Pract DNPPastoral Ministries MDVClinical Mental Health Cnslng MAPastoral Ministries DMNPast Care&Counslng/Member Care DMNSchool Counseling MAEnglish MAChristian Education MDVSport Education MABusiness Administration DBAMental Health Counseling MAInstructional Technology MAPrimary Care Family Nurs Pract CERTEnglish CERTCareer/Technical Education CERTWealth and Trust Management MWTMPsyc Ment Hea Nur Practitioner DNPIntercultural Studies MDVBiblical Studies MDVInternational Business IMBPastoral Ministries MDV/MAInternational Business CERTMarketing CERTBusiness Administration MSNReligion MAPost MSN‐Nurs Admin Certificat CERTTeacher Leadershp in Curr Inst CERTHuman Resource Management CERTEconomics CERTFinance CERTAccounting 54432221111111
6Athletics During the spring 2020 term, the average semester GPA for student athletes was 3.391,up from the 3.146 earned in spring 2019. The GPA for all women’s teams was 3.600,led by cross country at 3.896. The lowest women’s team, lacrosse, still averaged 3.440.Tennis set the pace in the men’s division with a semester GPA of 3.670. The overallmen’s average was 3.260. 74 athletes (up from 48 in 2019) earned a 4.0 GPA during the spring term. 40 werewomen, including seven of the 19 members of the swimming team and eight of the 28athletes that comprised the lacrosse squad. Soccer (7) led the way for the men.Currently, 20 athletes (11 men and 9 women) are carrying 4.0 cumulative GPAs. 93.2% of women athletes (152 of 163) earned a semester GPA of 3.0 or higher; 73.7%of men did so (199 of 270). Overall, 351 of GWU’s 433 athletes achieved this standard(81.1%).Men’s SportsAthletesSemester GPACumulative 4.000Basketball143.1064.0003.1243.550Basketball (JV)112.1374.0002.3094.000Cross tling293.3524.0003.2233.860Women’s SportsBasketballCross CountryGolfAthletesSemester GPACumulative 03.4794.000Volleyball153.6634.0003.5833.920
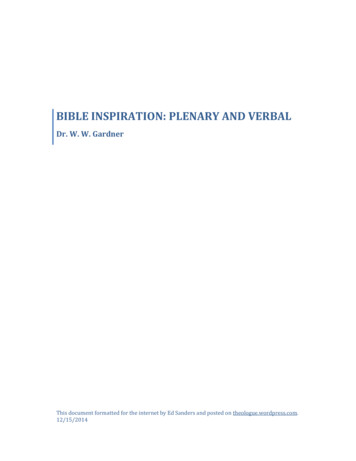
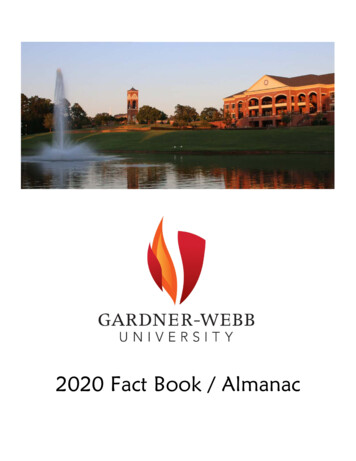
7 Gardner-Webb ranked ninth (down from fifth, 2018) in men’s sports in the Big SouthConference in the NCAA’s Graduation Success Rate 2019 report. Golf took first place;the next highest ranked team was baseball (4th). Gardner-Webb’s women finished fourth(up from fifth, 2018) despite having five of its seven teams—basketball, golf, soccer,tennis and volleyball—finish in a tie for first place. Overall, GWU finished fifth (up fromseventh, 2018). In the conference’s NCAA Federal Graduation Rates standings, Gardner-Webb’s menfinished eighth (down from seventh, 2018) while the women placed second (up fromfifth, 2018). Cross Country/Track was GWU’s highest-ranked men’s sport (second) whiletennis and volleyball set the pace in the women’s division with first place finishes. The one-year retention rate for athletes entering GWU in the fall of 2018 was 67.7%,the lowest mark in 15 years. Male athletes returned at a rate of 60.2%, the lowestpercentage since 2004. Women returned at a rate of 84.3%--nearly 20 percentagepoints higher than the 2017 cohort. Of those teams with at least four first-time athletes,men’s golf, men’s and women’s swimming, lacrosse, and softball realized a one-year,100% retention rate. The six-year graduation rate for athletes was 54.7%, down nearly eight percentagepoints from last year’s record of 62.5%. The rate for female athletes was 60.3%,down over 15 percentage points from the previous year. The men’s rate of 51.1% wasalso down; nearly six percentage points lower than the 2013 cohort. On the field, Gardner-Webb’s cumulative regular-season winning percentage in the 11head-to-head sports sponsored by the Big South Conference during the truncated 201920 year was 50.94%, up one percentage point from the previous year’s all-time record.This was good for fourth place in the league--GWU’s highest ranking in history. Radfordwas the top performer, winning 58.73% of its games followed by Campbell (58.49%)and Winthrop (53.61%). After three consecutive years at the top of the Big South,winning over 60% of its games, High Point fell to fifth in 2019-20 with a winningpercentage of 50.33. Presbyterian finished with the lowest winning percentage in theconference (35.34%). 2019-20 was only the third time in history that GWU’s conference winning percentagewas higher than its overall winning percentage. Three of GWU’s six teams that completed head-to-head regular seasons finished in thirdplace—men’s soccer, women’s soccer and men’s basketball. High Point (4) and Campbell(3) captured seven of the ten contested Big South championships. Since joining the Big South Conference prior to the 2008-09 season, Gardner-Webb’smost successful sport, based on win-loss percentage, is men’s basketball (51.4%),followed closely by women’s basketball (50.9%). Based on final conference positioning,and including both head-to-head and event sports, the most successful GWU team duringthe twelve-year period is women’s golf with an average annual final standing of 4.18.
8Gardner-Webb's Big South Conference Win-Loss 41.9343.3338.6241.8342.2536.113533.45302008-09 2009-10 2010-11 2011-12 2012-13 2013-14 2014-15 2015-16 2016-17 2017-18 2018-19 2019-20Conference W-L %Overall W-L %Quotable“Our student-athletes continue to embody what it means to be a STUDENT-athlete. We areincredibly proud of the amazing work that they do each semester. They took on a challenging situationthis past spring and made the most of it. The success of our student-athletes would not be possiblewithout the outstanding support of our faculty, staff, coaches, and administration at Gardner- Webb.”Carrie Drake Baker, Director of Academic Services for Student-Athletes“Academics have always been a big part of what I look for in our players. Great students typicallyhave great work ethic, are great teammates and make good decisions on and off the golf course. Theseare things that can be easily passed to our younger players and hopefully lead to better golf scores aswell.”Tee Burton, Head Golf Coach“It’s gratifying to see how well our student-athletes balance their academic responsibilities withthe athletic challenges that they look forward to. They attack both with a high level of excitement anddetermination. Our coaches do a great job understanding Gardner-Webb’s mission and recruitingstudent-athletes who will flourish in this environment and develop to their full potential.”Chuck Burch, Vice President for Athletics
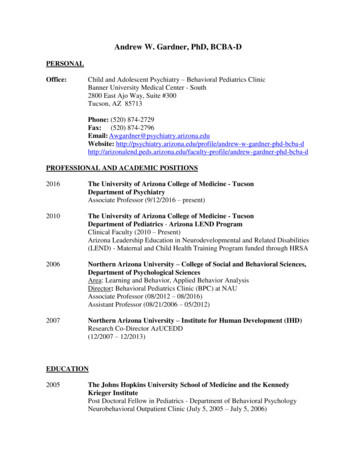
9Class Size The average class size for all programs was 12.18. Broken out by program, alongwith the department/school with the largest average section size:ProgramAvg. Section SizeLargest Avg Section/ ProgramTUG Core18.0824.50 BusinessTUG Upper Level10.9315.27 BusinessAll TUG12.8816.91 PsychologyNon-Traditional UG14.1726.40 Social SciencesGraduate10.0624.70 Physician Assistant Studies English contributed the highest percentage to the university’s core instruction,(14.84%), followed by Religious Studies (14.16%), Social Sciences (13.94%),World languages (12.99%), and Mathematics (9.71%). Business contributed the highest percentage to the University’s GOAL/DCPinstruction (27.27%) while Education covered 34.32% of the University’sgraduate level instruction. Four departments contributed over 50% of their resources to core instruction—World Languages (68.32%), English (58.00%), Health, Sport and PhysicalEducation (52.96%) and Social Sciences (50.41%). At the other end of the scale,Business contributed only 4.48%.Average Class Size - Five-Year 1712.8819.413.9112.5210.9310.910.0610.31Sp 20Sp p 17Sp 168CoreUpper Level TUGSp 18All TUGNon-Traditional UGGraduate
10Quotable“There exists a delicate balance between maximizing the size of classes from an administrativeefficiency standpoint and maintaining the University’s commitment to one-to-one faculty/studentexchange. Prospective students are told they will be more than just a number when they come to GardnerWebb. Our office tracks average class size on an annual basis, in part, so that this promise plays out for theentirety of the student’s academic career.”Ms. Lisa Kindler, Director of Institutional ResearchDepartmental Contribution to General Education Instruction - Spring 2020Music, 2.4Business, 4.4Psychology, 4.1Art,1.3Theater, 0.3English, 14.8CommunicationStudies, 6.3Health, Sport,Physical Ed, 7.6Religious Studies, 14.2Natural Sciences, 7.8Social Sciences, 13.9Mathematics, 9.7World Languages, 13.0
11Departmental Contribution to GOAL/DCP Instruction - Spring 2020Health, Sport,Physical Ed, 2.2Natural Sciences, 2.5Psychology, 0.7Art, 1.1World Languages, 0.5Music, 0.4English, 3.9Mathematics, 4.7Social Sciences, 5.3Business, 27.3Religious Studies, 8.2Nursing, 19.8Education, 11.1Public Service, 12.2
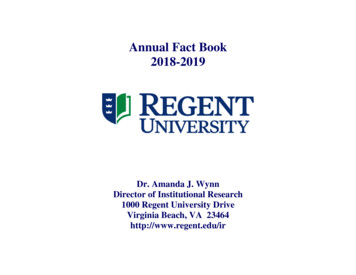
12Cohort Characteristics 139 North Carolina high schools were represented in the 2019 cohort, up from 130 in2018 and 124 in 2017. Schools that supplied four or more students to the 2019 FTFTcohort along with their most recent five year totals:201920182017201620151314796Crest HS910211717Burns HS810835Kings Mountain HS86478Thomas Jefferson CA65245Trinity HS51000Forest View HS43460East Forsyth HS40110Home School Crest’s number was an all-time low as was the number from Shelby High School (0). The total cohort of 402 was seven less than in 2018. It was the second lowest enteringclass on record since 2006. The percentage of females dropped by 2.4 percentage points to 54.2% after topping60% in 2017--the lowest percentage of females since the 2012 cohort. 39.1% of first-time students were athletes—the highest percentage ever and threepercentage points higher than the 2018 record. 58.7% of first-time men wereathletes, also topping 2018’s previous high of 55.1%. 54.2% of the cohort listed their ethnicity as “White,” down nine percentage pointsfrom 2018 and 15.6 percentage points from 2017’s record of 69.8%. A record 21.1%identified as “Black,” up 8.2 percentage points from 2018 and nearly ten percentagepoints from 2017’s all-time low of 11.3%. 5.2% described themselves as “Hispanic,”the highest percentage ever. 60.2% were from North Carolina, the lowest percentage ever.QuotableOver the past two years, we are seeing an increase in homeschool student enrollment. A trend thatis likely to continue given the current landscape. Students can experience small class sizes andpersonalized engagement with faculty, much like the homeschool learning environment.Expanding outside of our N.C. regional market was a specific recruitment effort. Targetedrecruitment travel, scholarship incentives, and key high school visits provided the foundation forincreasing enrollment outside of North Carolina. Students are choosing Gardner-Webb.Kristen Setzer, Vice President for Enrollment Management
13Gender Percentage Breakout - First-Time Full Time 220112010Ethnicity Percentage Breakout - First-Time Full Time Hispanic20.818.93.22.02.820122011201017.2
14State Percentage Breakout - First-Time Full Time 1620152014North Carolina20138.97.98.5201220112010South CarolinaAthlete Percentage Breakout - First-Time Full Time 525.830.2201820172016All Athletes20152014Male male Athletes201117.82010
15First-Year Cohort Characteristics and Retention 81444460494434494461Total 19.49617.38419.1HispanicOther/UnknownHome State%N%N%N%N%N%N%N%N%N%90NNorth Carolina60.224262.925860.423
MUSC Music w/ Emph Bus/Mus Industry 8 DIVN Pastoral Care and Counseling MDV 31 . MATH Mathematics 7 NURS Primary Care Family Nurs Pract DNP 31 . HSPE Physical Education & Health Ed 7 DIVN Pastoral Ministries MDV 23 . RELI Youth Discipleship Studies 6 PSYC Clinical Mental Health Cnslng MA 22 . BSN Accelerated .