Transcription
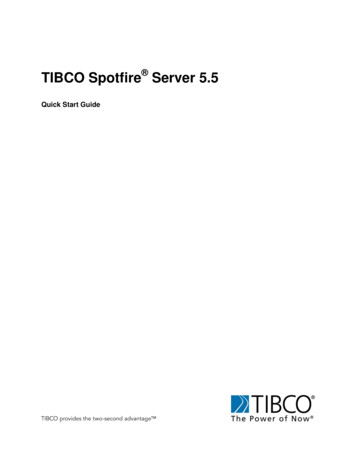
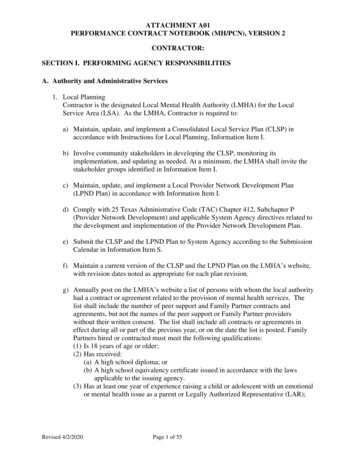
E-Notebook 2014With the launch of E-Notebook 2014, the latest versionof the market leader in electronic laboratory notebooks,PerkinElmer introduces the most user friendly, self-servicesolution for planning, capturing, recording, and analyzingscientific data. Integration with Inventory, Registration andChemACX has been updated, improved and brought into thelatest version of E-Notebook. Seamless integration with theTIBCO Spotfire data visualization and analysis software, madepossible by the Datalytix query tool, creates an environmentfor bench scientists to quickly and easily manipulate andaggregate data from different origins for thorough analysesacross experiments. As part of PerkinElmer’s productivity suite,E-Notebook 2014, TIBCO Spotfire , and Datalytix solutions letscientists do more with their data.E-Notebook 2014 Highlights I mproved Interface: If you’re still on E-Notebook versions12 or older, you’ll want to see the dramatically improvedlook, feel, and user experience of E-Notebook 2014. Thenew user interface looks like what you’d expect in a stateof-the-art software solution, with familiar design features(like ribbons and toolbars) and user actions (drag and drop)to ensure ease of use and greater user adoption. Enhanced Integration with Registration and Inventory:E-Notebook 2014 serves as your portal to these workflowtools for seamless product registration and inventorymanagement with fewer steps and mouse clicks. Invisible Enhancements: Changes were made to corecomponents that improve E-Notebook’s robustness andadaptability, including experiment size information andenhanced group security options. Upgrade Toolkit: A significant investment has beenmade in a tool for our services team to use and makemigrating to E-Notebook 2014 more efficient andless costly.Figure 1. This is a Ribbon menu control from an E-Notebook experiment.About E-NotebookE-Notebook is theindustry’s most widelydeployed electronic laboratorynotebook. Researchers in thepharmaceutical, biotech, chemical, food/flavor/fragrance, and petrochemicalindustries, as well as academic andgovernment institutions, rely onE-Notebook to enhance personalproductivity and improve data quality.Organizations protect intellectualproperty and create a shareablearchive with E-Notebook, fosteringcollaboration and innovation.E-Notebook 2014 focuseson significantly improving theuser experience and featuresmodernizations and updates foreasier use and greater productivity.Migrating to the newer solution ismore efficient and predictable witha new upgrade toolkit, developedexclusively for PerkinElmer Servicesto identify customization that mustbe carried over and accounted for inversion 2014.
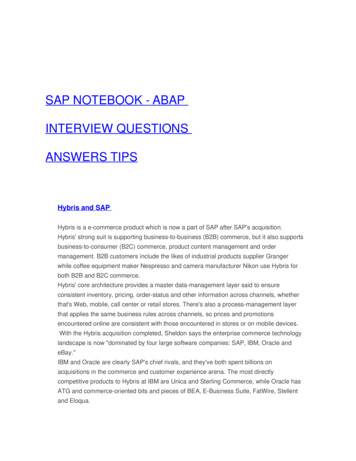
Tables: New tables enable users to get to data of interest morequickly through effective sorting, grouping, and filtering. Settingsare saved with the experiment for future use. Now, images aremore easily moved and stored within tables, too.Figure 2. Push directly to registration or print a barcode from inventory.Reading modes: While some users are comfortable workingwith tabs or sections, others want information presented in acontinuous, scrolling document. E-Notebook 2014 lets usersdecide and configure the presentation they prefer for most of thecontent. Users may also move sections up or down or collapsethem so they don’t clutter the screen.What's New in E-Notebook 2014Logging into E-Notebook 2014 provides a striking clue as to howimproved the electronic lab notebook (ELN) has become, especiallyfor users of version 11 and older. Gone is the stale gray interfaceof older versions. PerkinElmer brought in experts to create acompletely new look and feel for the E-Notebook solution,and the results can be noticed at all levels of the application –from new icons and splash screens to context-sensitive ribbontechnology. The overall effect is an easier and more intuitiveto work with E-Notebook solution. Ribbons provide betternavigation, table control is improved, and the autotext featurehas been enhanced.Figure 4. Tabbed versus continuous scroll modes showing where each section is.New Software Support: E-Notebook 2014 has been updatedto support the latest software that constitutes your workenvironment. You can now use the industry leading electroniclaboratory notebook on Microsoft Windows 8.1 with InternetExplorer 11 and Microsoft Office 2013 without compromisingyour modern environment.External editing: The new external editing function allows usersto select which part of the document they would like displayed inthe preview embedded in the notebook. All of the information isretained in the MS Word , Excel or PowerPoint even when onlya portion is displayed as a preview in the notebook. It is accessibleby switching into edit mode.Drag-and-drop: To reduce the number of mouse clicks, a newdrag-and-drop feature lets users search and find multiple fileson their desktop or network, then select and drag files intotheir experiment. This automatically generates appropriatesections for each of the associated documents. Any filesnot recognized by E-Notebook are stored as an attachment.E-Notebook recognizes Microsoft Office files, includingWord documents, Excel spreadsheets, and PowerPoint presentations, as well as PDF, ASCII, and image files. Dragand-drop extends to moving experiments around withinE-Notebook folders, copying an experiment or experimentsections between notebooks, and rearranging sections or tabsin an experiment.Improved Supplementary Data Management (SDM): Thenew SDM enables a laboratory with multiple instruments andusers with immediate, automatic access of all instrument outputfiles, images and PDFs within the E-Notebook experiments,allowing your scientists to reference, import or export most filetypes at their convenience.Figure 3. Drag-and-drop files from your computer to add files to an experimentin E-Notebook.2Figure 5. External editing mode in the E-Notebook allowing a user to edit achromatography protocol in Microsoft Word .
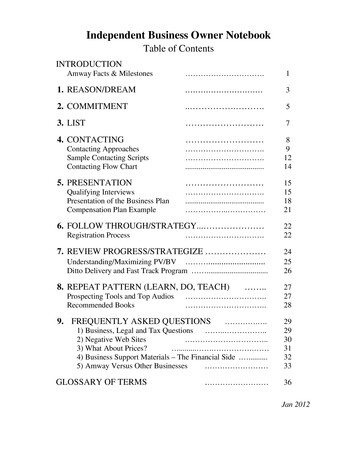
Structured data management: E-Notebook 2014 introducesa new, highly flexible method of capturing data so that it can bequeried and searched more easily. By defining a series of fieldsand, if required, calculations and curve fit models, E-Notebookconstructs a single table or series of hierarchical tables that storeand process raw data from a particular experiment or test. Oncethe section is built, it becomes part of the experiment. E-Notebookthen automatically loads, calculates, and displays all the data andresults. A comprehensive mapping wizard helps users map theirdata formats, visually and interactively, using templates that canbe reused for multiple experiments.Data validation: Once data is loaded, users can revise results,validate or invalidate data, and leave comments explaining theirwork. Through a simple workflow users decide what data getspublished or is readily viewable, yet all data remains withinE-Notebook for proof and audit control.they don’t need. After the upgrade, the second scan allowscustomers to check the database to ensure all customizations areaccounted for, and no inadvertent errors occurred inthe database.TIBCO Spotfire IntegrationThe TIBCO Spotfire visualization and analysis software integratesseamlessly with E-Notebook 2014 for a streamlined workflow.A new add-on called Datalytix enables bench scientists to pulldata using a simple workflow, from E-Notebook into TIBCOSpotfire for unprecedented views of aggregated datasets. Userscan look across all experiments, aggregate data, see trends, spotoutliers, and verify data quality. With the ability to pivot, zoom,re-plot, and otherwise manipulate the visualization of data, TIBCOSpotfire often helps users develop insights they might notsee otherwise.Figure 7. A Datalytix query for a specific substructure used in a primary screen.Figure 6. Data validation in the structured data management tool.Cross-experiment searches: Structured data capture enablesanalyses of results from multiple experiments, in multiplenotebooks from multiple users. Visualization tools withinE-Notebook allows users to render in several graphing styles.Upgrade ServicesPerkinElmer has created a set of tools for its Services team to easethe transition from E-Notebook v 11 and 12 to the latest version.The company has made a significant investment in developingthe upgrade toolkit (UTK) to enable the team to reduce migrationservices and associated costs and smooth the transition to thenewer software. Key to the UTK is an online diagnostic tool whichidentifies the customizations made to E-Notebook to determinethe carry-over required to 2014. This allows PerkinElmer to takethe guess work out of migrations. Both before and after theupgrade is completed, the database is scanned and all deviationsfrom the out-of-the-box E-Notebook configuration are flagged.Not only does this more reliably help predict the time and effort itwill take for a customer to upgrade, it also allows the customer tore-evaluate their customizations and ensure they are still relevant.This means customers no longer pay to migrate customizationsPerkinElmer’s vision for self-service science, where the enduser can easily configure the software and manipulate data inreal-time without helpdesk and IT requests, is being realizedwith improvements to E-Notebook and its integrations. TIBCOSpotfire , once thought of as an expert tool for informaticians,has become a much more user-friendly solution for scientists whowant to analyze and draw conclusions from the vast collection ofdata. PerkinElmer, in addition to developing enhancements forTIBCO Spotfire 's usability, has also lowered licensing costs forindividuals, making TIBCO Spotfire an accessible tool forevery scientist.Reasons to Upgrade to E-Notebook 2014 T he vastly improved look and feel, along with usability updates,make 2014 a pleasure to work with. T he ability to achieve more in fewer mouse clicks, becauseof reduced key strokes, makes users more productive. B etter integration with TIBCO Spotfire analysis andvisualization software creates a more streamlined workflowand delivers significantly more insight, faster. U pgrade Toolkit reduces the headaches and costs associatedwith software migration. T he support of a modern software environment allows theusers greater productivity with the latest informatics packagesat their disposal.3
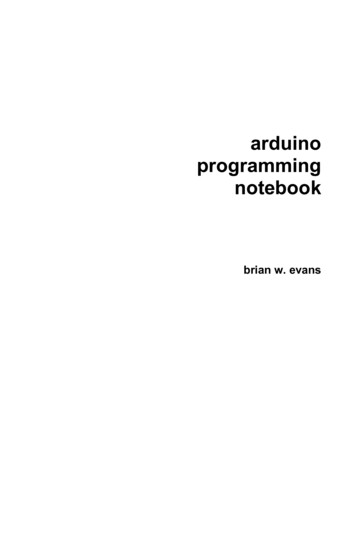
Figure 11. Register a compound to the temporary or permanent register fromwithin the E-Notebook.Figure 9. New look and feel demonstrated via the image section which can bedisplayed either in a table (above) or as a card view where thumbnails are shown(not pictured).E-Notebook 2014 for Chemistry: SuperiorRegistration and Inventory IntegrationScientists developing products can record their activities inE-Notebook and in a few easy steps register those products andphysical samples in PerkinElmer’s Registration and Inventoryapplications. New registration and inventory buttons enable usersto enter data and create hyperlinked files to these integratedapplications without leaving the E-Notebook client. For repetitiveworkflows, PerkinElmer has developed a “quick” registration andinventory process, while manual registration and inventory arestill available for more complex products including mixtures.With E-Notebook 2014, chemists can get all their work done in asingle application that pushes data into Registration and Inventoryprograms. In addition to time savings and increased accuracy, theintegration enhances traceability and protects the audit trail withsingle sign on to all three applications.The Registration workflow allows users to investigate theuniqueness of their product and register initial or subsequentbatches of a compound, creating a sample identification. TheInventory workflow creates a physical container of that materialwith an identifying barcode that informs users – and theircolleagues – what the product is, how much is available, whoowns/created it, and where it is stored. It also allows colleagueswith the right permissions to use those containers intheir experiments.Figure 12. Clicking on the barcode in E-Notebook allows you to view the containerholding the material in Inventory.As integrated applications, E-Notebook, Registration, and Inventoryserve as a centralized system that creates an end-to-end workflowwithin a single application. Researchers not only complete theirwork within this environment, but also have access to data, results,and other key information from peers within the organization.Sharing this information moves science forward, faster.Figure 10. Because Inventory and Registration are also integrated with our ChemACX Database, you can search over 3 million compounds from many differentvendors within the E-Notebook.Figure 13. IC50 Protocol in BioAssay comparing curves for three compoundsselected from a plate.4
E-Notebook 2014 for Biology:Featuring BioAssay FunctionalityFor biologists running screening assays, E-Notebook providesBioAssay functionality that loads structured data in a consistentmanner. New in 2014 are:Figure 14. Data from a Bradford protein assay captured in BioAssay. Thisscreenshot shows the ability to include calculations such as a correction applied tothe read value.Figure 15. Publish Table to TIBCO Spotfire button on a Ribbon menu control onan E-Notebook experiment.Figure 16. Primary screen data from E-Notebook visualized in TIBCO Spotfire . P rotocol versioning: Users can edit and update protocolswithout having to create a new version each time. Thisflexibility enables consistent collection and analysis byquerying all the data run in a single protocol, even as thatprotocol may evolve over time. M ore functions: Additional functions for calculations arenow available, such as pulling values from the previous or nextrow, or choosing the minimum and maximum over a datarange. This broadens the scientists’ ability to analyzedata within the E-Notebook. P rotocol selection: A new interface presents the availableprotocols, which users may sort in a variety of ways.This enhancement helps to ensure that the scientist willchoose the right protocol, particularly if lab-based. P ush data: Users can choose what data they want to show,for example, in TIBCO Spotfire visualization and analysissoftware. As part of the protocol, the scientist can determinewhat content will be accessible from TIBCO Spotfire forfurther analysis. With a connection between E-Notebook andTIBCO Spotfire established, more data can be aggregatedacross experiments for evaluation and analysis. TIBCO Spotfire analysis file (.dxp) templates can be dragged back into theE-Notebook for safe storage with the experiments andoptionally opened up to review the analysis when new datahas become available.USAPerkinElmer, Inc.940 Winter StreetWaltham, MA 02451 USAP: (800) 762-4000 or( 1) 203-925-4602www.perkinelmer.comJapanPerkinElmer, Inc.Pacific Marks Shinkawa 7F, 1-5-17Shinkawa, Chuou-ku, Tokyo, 104-0033www.perkinelmer.comFigure 17. HTS SAR (high throughput screen-structure activity analysis) data fromE-Notebook pushed to TIBCO Spotfire .ConclusionE-notebook 2014 is the latest version of the market leader inElectronic laboratory Notebooks. It is the most user friendly, selfservice solution for planning, capturing, recording and analyzingscientific data. Bench scientists quickly and easily manipulateand aggregate data from different origins through seamlessintegration with TIBCO Spotfire data visualization and analysissoftware. Made possible by the Datalytix query tool, do more withyour data. Do more experiments. Do more exploring. Make a newdiscovery. With E-Notebook 2014—Do more science.ChinaPerkinElmer, Inc.1670 Zhangheng RoadZhangjiang High-Tech ParkShanghai, 201203www.perkinelmer.comFor a complete listing of our global offices, visit www.perkinelmer.com/ContactUsCopyright 2013-2014, PerkinElmer, Inc. All rights reserved. PerkinElmer is a registered trademark of PerkinElmer, Inc. All other trademarks are the property of their respective owners.011430A 01
Spotfire for unprecedented views of aggregated datasets. Users can look across all experiments, aggregate data, see trends, spot outliers, and verify data quality. With the ability to pivot, zoom, re-plot, and otherwise manipulate the visualization of data, TIBCO Spotfire often h