Transcription
Analytics ExplorerHelping Exploration and Production (E&P)companies create business value throughdynamic data science and analyticsihsmarkit.com
OverviewWith recent market disruptions impacting oil prices andaccelerating long-term trends like Energy Transitionand Digital Transformation, E&P companies require newtechnologies to keep pace with this changing environmentand mitigate uncertainty and risk. Data science andanalytics has an important role to play in helping E&Pcompanies drive their digital strategies and enhance theircompetitive advantage, achieve return on investment (ROI),and increase operational efficiencies. When paired withdomain expertise, data science technology can help E&Pcompanies evolve their operations to become more agileand data-driven while reducing bias and risk for successfuldecision-making.
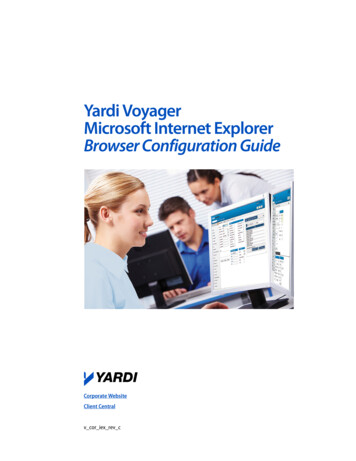
Analytics ExplorerIHS Markit Analytics Explorer is designed to help companies involved in exploration, development,and production activities leverage data science and analytics to help drive their business strategiesand make investment decisions based on predictive outcomes and probabilities. It is well-suited fororganizations managing a large portfolio of wells, assets, and reservoirs who are actively investingin digital transformation initiatives and have a strong desire to get the most out of their datainvestment to improve operational efficiency. Exploration decisions can be improved by integratingseismic attributes, geological maps and digital log data to identify new prospect areas usingadvanced predictive and clustering algorithms.Figure1. Analytics Explorer dashboard, powered by TIBCO Spotfire , visualization results from Principal Component Analysisand Self-Organizing Map techniques applied to seismic attributes workflows for facies delineation, resulting in more accurateinterpretations.E&P companies actively seeking data science solutions to automate processes and optimize assetteam workflows will benefit greatly from the many workflows incorporated in Analytics Explorer.These intuitive, guided workflows have been rigorously tested and validated to ensure maximumresults that are immediately insightful and actionable.
BenefitsAchieve next level collaboration with a cross disciplinary dataset allowing forreduced uncertainty and risk. The foundation of good data science is excellentdata quality. Utilizing Analytics Explorer, teams can quickly discover and comingledisparate datasets, and can then run advanced data mining and quality controlworkflows to easily visualize data and identify missing or incorrect data. Thishelps protect against decision-making based on low quality or sparse data, andensures data bias, orphaned or bypassed data doesn’t skew visualization results.By understanding the quality and quantity of data available, asset teams can betterassess the associated risk and probability of a successful outcome.Immediate Access to Data ScienceTraining predictive models and tuning up machine learning algorithms takes considerable time andresources, both of which are in short supply in today’s volatile E&P market. For more than threeyears, we have invested in the development of a state-of-the-art data science platform that has beenvalidated by customers and our strategic partners, TIBCO and The University of Texas. We havesimplified the access to advanced data science tools to geoscientists and engineers by incorporatingmultiple guided workflows to help asset teams gain immediate value from their data investment.CompatibilityAnalytics Explorer works not only with IHS Markit solutions but as a standalone application overlaidon your proprietary data housed in any SQL or Postgre SQL database. This allows your team tointegrate data to derive insights and understanding. Analytics Explorer has built-in connections withthe following IHS Markit solutions, services, and databases: Dynamic North America (DNA) Kingdom Harmony Enterprise Enterprise Data Management (EDM) for Energy EDIN SQL/Postgre SQL databasesReduces Interpretation BiasAnalytics Explorer allows geoscientists great flexibility with the ability to utilize more attributesin their interpretation workflows like never before due to the various multi-variate algorithmsembedded within the application. The results provide guidance by revealing which attributesgeoscientists should focus on for more reliable and unbiased interpretations. For example, manygeoscientists rely on smaller subsets of data or perhaps only utilize their favorite, well-understoodattributes to make drilling recommendations. By improving the access to a large quantity of highquality data, your team can statistically reduce risk and create new value through repetition.In addition, the algorithms and workflows incorporated in Analytics Explorer can be adjusted orimproved based on your proprietary knowledge of the basin, reservoir, well, etc. You can quicklyunderstand how the algorithm produced the result and will be able to rapidly interrogate anomaliesand visualize trends.
Visualization & Data AnalyticsAfter you’ve evaluated data completeness, accuracy and volume, and you’ve run a workflowutilizing one of our templates or one of your own, you’ll get the results in both table and visualdisplay formats. Through a dynamic connection between TIBCO Spotfire and Analytics Explorer,you’ll easily be able to toggle on and off attributes or datasets and understand their impact visuallythrough dashboards, charts, graphs and displays. You can utilize our out-of-the-box results orcustomize your displays to better align with your organization.Featured WorkflowsThe following analytics workflows are standard with Analytics Explorer:Production performance predictive maps:Understand key drivers in well performance,normalize engineering variables and includegeological data to generate production predictivemaps to identify sweet spots.Data imputation for missing geological data:Impute missing geological data such as digitallogs to reliably increase the amount of data foryour interpretation project to help you makebetter decisions with lower risk.Enhance geological workflows: Use withIHS Markit Kingdom , to augment geologicalcross-sections by integrating multiple data(chronostratigraphic, biostratigraphic,geochemistry, geomechanical, etc.) that issynchronized with your Kingdom geological tops.Geological and geophysical faciesAdditionally, you can combine multiple propertyclassification: Apply clustering algorithms onselect variables from digital logs, geological grids, grids to create quality index maps, play fairwayand seismic data to identify facies that are linked maps, and risk maps.to highly producing reservoirs.To Learn More Automated well spacing calculations: Analyzewells from either a select area of interest or for an If you’d like to find out more about Analyticsentire basin automatically, with resulting statistics Explorer, you can request a demo now or visitvisualized in plots in Spotfire indicating the ideal our website at ihsmarkit.com/analytics-explorer.well spacing.Completion optimization: Isolate the impactthat every engineering and completion variablemay have on production performance in modelingscenarios that include geological and physicalconstraints to get to the right completion strategy.
CUSTOMER CARENORTH AND SOUTH AMERICAT 1 800 447 2273 1 303 858 6187 (Outside US/Canada)EUROPE, MIDDLE EAST AND AFRICAT 44(0) 134 432 8300ASIA PACIFICT 604 291 3600JAPANT 81 3 6262 1887ECustomerCare@ihsmarkit.comIHS Markit (NYSE: INFO) is a world leader in criticalinformation, analytics and expertise to forge solutionsfor the major industries and markets that driveeconomies worldwide. The company delivers nextgeneration information, analytics and solutions tocustomers in business, finance and government,improving their operational efficiency and providingdeep insights that lead to well-informed, confidentdecisions. IHS Markit has more than 50,000 businessand government customers, including 80 percent of theFortune Global 500 and the world’s leading financialinstitutions. Headquartered in London, IHS Markit iscommitted to sustainable, profitable growth.Copyright 2021 IHS Markit. All Rights Reserved643364453-0521-VLAbout IHS Markit
advanced predictive and clustering algorithms. Figure1. Analytics Explorer dashboard, powered by TIBCO Spotfire , visualization results from Principal Component Analysis and Self-Organizing Map techniques applied to seismic at