Transcription
Quantopian Risk ModelAbstractRisk modeling is a powerful tool that can be used to understand and manage sources of risk ininvestment portfolios. In this paper we lay out the logic and the implementation of theQuantopian Risk Model (QRM), an equity risk factor model developed by Quantopian todecompose and attribute risk exposures taken on by arbitrary equity investment strategies. Bydefining sources of risk, it is possible to consider the residual or remainder term as a strategy’s“alpha”, or the portion of an investment strategy’s return that is derived from skill. Combinedwith some other tools, the QRM is used by Quantopian to evaluate quantitative trading strategieson the basis of observing that strategy’s portfolio holdings over time.IntroductionRisk management considers how we can consciously determine how much risk we are willing totake in order to attain a future gain. This process involves:1.2.3.4.5.Identifying sources of riskQuantifying exposure to those sources of riskDetermining the effects of those risk exposuresDeveloping a mitigation strategyObserving consequent performance and amending the mitigation strategy as neededRisk comes from uncertainty regarding a portfolio’s future losses and gains and differentindividuals and institutions will have differing amounts of tolerance to risk. We quantify the totalrisk of a portfolio over 𝑻 time periods as the standard deviation of that portfolio’s returns:𝑻𝟏𝛔 &(𝒓𝒍 𝒓 )𝟐 ,𝑻𝒍.𝟏Where:-𝒓𝒍 is the return on time 𝑙𝒓 is the average portfolio return over 𝑇 time periodsThis is a common definition of risk that captures sufficient information for our purposes. It treatsgains and losses symmetrically and can be used to evaluate each level of the portfolio, fromindividual assets to the portfolio itself. Standard deviation, also called volatility, gives us an ideaof how close we should expect values to fall relative to the mean. A common rule of thumb isthat around 68% of values lie within one standard deviation of the mean, 95% of values liewithin two standard deviations of the mean, and 99% of values lie within three standarddeviations of the mean. A population of observations with a low standard deviation will containindividual observations largely clustered around the population mean value, while a population
Quantopian Risk Modelof observations with a higher standard deviation can be expected to contain a larger number ofextreme values, both for gains and losses. This fits with common intuition about financialreturns. More extreme values go hand in hand with more volatile assets. They bring with themgreater chance of both profit and ruin.Evaluating risk is not only about evaluating the amount of potential loss. It allows us to setreasonable expectations for returns and make well-informed decisions about potentialinvestments. Quantifying the sources of risk associated with a portfolio can reveal to what extentthe portfolio is actually accomplishing a stated investment goal. If an investment strategy isdescribed as targeting market and sector neutrality, for example, the underlying portfolio shouldnot be achieving significant portions of its returns from a persistent long exposure to thetechnology sector. While this strategy may show profit over a given timeframe, understandingthat those profits are earned on the basis of unintended bets on a single sector may lead theinvestor to make a different decision about whether and how much capital to allocate.Quantifying risk exposures allows investors and managers to create risk management strategiesand refine their portfolio.Developing a risk model allows for a clear distinction between common risk and specific risk.Common risk is defined here as risk attributable to common factors which drive returns withinthe equity stock market. These factors can be composed of either fundamental or statisticalinformation about the underlying investment assets that make up the market. Fundamentalfactors are often observable fundamental ratios reported by companies that issue stock, such asthe ratio of book value to share price, or earnings per share. These factors are typically derivedfrom financial and macroeconomic sources of data. Statistical factors use mathematical modelsto explain the correlations between asset returns time-series without consideration of companyspecific fundamental data (Axioma, Inc. 2011).Some commonly-cited risk factors are the influence of an overall market index, as in the CapitalAsset Pricing Model (CAPM) (Sharpe 1964), risk attributable to investing within individualsectors, which give an idea of the space a company works within, as in the BARRA risk model(BARRA, Inc. 1998), or style factors, which mimic investment styles such as investing in “smallcap” companies or “high growth” companies, as in the Fama-French 3-factor model (Fama andFrench 1993).Specific risk is defined here as risk that is unexplainable by the common risk factors included ina risk model. Typically, this is represented as a residual component left over after accounting forcommon risk (Axioma, Inc. 2011). When we consider risk management in the context ofquantitative trading, our understanding of risk is used in large part to clarify our definition of“alpha”. This residual after accounting for the common factor risk of a portfolio can be thoughtof as a proxy for or estimate of the alpha of the portfolio.2
Quantopian Risk ModelFactor ModelsA common first introduction to factor modeling and the notion of common factor risk is theCapital Asset Pricing Model (CAPM). In the CAPM, we define an equilibrium relationshipbetween returns and common factor risk, using only a single common factor risk, the returns ofthe market itself. The CAPM expresses the returns of any individual asset like so:𝑬 [ 𝒓𝒊 ] 𝒓𝒇 𝜷𝑴𝒊 (𝒓𝑴 𝒓𝒇 )Where:-𝒓𝒇 is the risk-free rate𝒓𝑴 is the return of the market𝑪𝑶𝑽[𝒓𝒊 ,𝒓𝑴 ]𝜷𝑴𝒊 𝑽𝑨𝑹[𝒓 ] is the influence the market on the excess return of the 𝒊-th asset over themarket𝑴The CAPM decomposes the returns of individual assets into the portion of the returns explainedby the market at large and the portion of returns expected from a risk-free asset. This is asimplistic view of the market that does not hold up in empirical tests. Many improvements uponthe CAPM have been developed since its inception, such as the Fama-French three-factor model(Fama and French 1993), which extends from a single source of risk to include two additionalsources of risk, company size and company value. The Fama-French three factor model can beexpressed as:𝑺𝑴𝑩𝒓𝒊 𝒓𝒇 𝜷𝑴𝒓𝑺𝑴𝑩 𝜷𝑯𝑴𝑳𝒓𝑯𝑴𝑳 𝜶𝒊𝒊 @𝒓𝑴 𝒓𝒇 A 𝜷𝒊𝒊Where:- 𝒓𝑺𝑴𝑩 is the return from the risk premium of small market cap stocks over large marketcap stocks (SMB)- 𝒓𝑯𝑴𝑳 is the return from the risk premium of high book-to-market ratio stocks over lowbook-to-market ratio stocks (HML)- 𝜷𝑺𝑴𝑩is the risk exposure of 𝒓𝒊 to SMB𝒊𝑯𝑴𝑳- 𝜷𝒊is the risk exposure of 𝒓𝒊 to HML- 𝜶𝒊 is the unexplained return of asset 𝑖As a final example, Arbitrage Pricing Theory (APT) (Ross 1976) is a generalization of theCAPM and similar models, which allows us to measure the influence of more than one factorwhen considering the forces that drive returns.3
Quantopian Risk ModelAPT expresses the returns of individual assets using a multiple linear regression, a linear factormodel, like so:𝒓𝒊 𝜶𝒊 𝜷𝒊,𝟎 𝑭𝟎 𝜷𝒊,𝟏 𝑭𝟏 𝜷𝒊,𝒎 𝑭𝒎 𝝐𝒊Where:- 𝑭𝒋 , 𝒋 {𝟎, 𝒎} is the set of return streams of the common factors in our model- 𝜷𝒊,𝒋 , 𝒋 {𝟎, 𝒎} is the set of risk exposures of 𝒓𝒊 to each common factor risk- 𝜶𝒊 is the unexplained return of asset 𝑖- 𝝐𝒊 the idiosyncratic shock of asset 𝑖The factors in APT are return streams that are entirely dominated by single characteristics. In theFama-French model, our ways to explain returns are limited to the market, SMB, and HML,while with APT we can add as many factors as we want in order to account for the variouscommon factors that are relevant to us. APT forms the basis of the Quantopian Risk Model.ImplementationThe QRM is a multi-factor risk model which seeks to decompose each asset’s returns across a suiteof 16 individual fundamental factors. The 16 factors in the model are comprised of 11 sector factorsand 5 style factors. The QRM does not explicitly model a standalone market factor. The factorsincluded as common risk factors were chosen for their degree of independence from each otherwhile seeking to explain the returns of the largest number of assets in the market possible.The QRM design is by definition designed to model historical and current risk as opposed toserving as a risk forecasting tool.This section begins the technical implementation of the QRM.Notation GuideSummary of basic notational conventions:-Boldface lowercase letter indicates vector, e.g. 𝒂-Boldface uppercase letter indicates matrix, e.g. 𝑨-Boldface uppercase letter with subscript : , 𝒋 indicates the 𝒋𝒕𝒉 column of matrix 𝑨, e.g. 𝑨:,𝒋-Boldface uppercase letter with subscript 𝒊,: indicates the 𝒊𝒕𝒉 row of matrix 𝑨, e.g. 𝑨𝒊, 4
Quantopian Risk ModelMathematical ModelMathematically, the QRM has the following form,𝒏𝒓𝒊,𝒕 𝒎𝒔𝒆𝒄𝒕& 𝜷𝒔𝒆𝒄𝒕𝒊,𝒋,𝒕 𝒇𝒋,𝒕𝒋.𝟏𝒔𝒕𝒚𝒍𝒆 𝒔𝒕𝒚𝒍𝒆 & 𝜷𝒊,𝒌,𝒕 𝒇𝒌,𝒕 𝜺𝒊,𝒕 ,(1)𝒌.𝟏where:-𝒓𝒊,𝒕 is the return of asset 𝑖 on day 𝑡,𝒏 is the number of sector factors,𝒎 is the number of style factors,𝒕𝒉𝜷𝒔𝒆𝒄𝒕sector factor exposure1 of asset 𝑖 on day 𝑡2,𝒊,𝒋,𝒕 is the 𝒋-𝒕𝒉𝒇𝒔𝒆𝒄𝒕sector factor on day 𝑡,𝒋,𝒕 is the return of 𝒋-𝜷𝒊,𝒌,𝒕 is the 𝒌𝒕𝒉 style factor exposure of asset 𝑖 on day 𝑡,-𝒇𝒌,𝒕-𝜺𝒊,𝒕 is the residual term for asset 𝑖 on day 𝑡 in model (1)𝒔𝒕𝒚𝒍𝒆𝒔𝒕𝒚𝒍𝒆is the return of 𝒌𝒕𝒉 style factor on day 𝑡.The mathematical model (1) is derived from sub-model ��� & 𝜷𝒔𝒆𝒄𝒕𝒊,𝒋,𝒕 𝒇𝒋,𝒕 𝜺𝒊,𝒕 ,(1a)𝒋.𝟏and sub-model (1b)𝒎𝒔𝒕𝒚𝒍𝒆 𝒔𝒕𝒚𝒍𝒆𝜺𝒔𝒆𝒄𝒕𝒊,𝒕 & 𝜷𝒊,𝒌,𝒕 𝒇𝒌,𝒕 𝜺𝒊,𝒕 ,(1b)𝒌.𝟏where:- 𝜺𝒔𝒆𝒄𝒕𝒊,𝒕 is the residual term for asset 𝑖 on day 𝑡 in sub-model (1a).1Factor exposure is also called a factor loading. It measures the relationship between thedependent variable and the underlying factor.𝒕𝒉2For stock 𝑖, the 𝜷𝒔decsector.𝒊,b,c is zero if stock 𝑖 does not belong to the 𝒋5
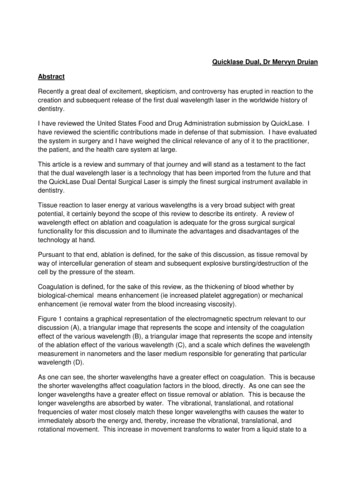
Quantopian Risk ModelSector FactorsSector factors are used to represent the influence of different sectors. The QRM defines sectorsusing sector classifications as defined by Morningstar (Morningstar, Inc. n.d.). Furthermore, theQRM uses sector ETF returns to represent the corresponding sector factor returns. The followingtable maps each sector to its index in the mathematical model (1), corresponding ETF, Morningstarsector code, Quantopian security identifier (SID), and variable name used in the Quantopian API,respectively.SectorSectorindex 𝒋ETFMorningstar codeSIDVariable namein the Quantopian APIMaterialssector1XLB101 - Basic LY102 - Consumer Cyclical19662consumer discretionaryFinancials3XLF103 - Financial Services19656financialsReal Estate4IYR104 - Real Estate21652real estateConsumerStaples5XLP205 - ConsumerDefensive19659consumer staplesHealth Care6XLV206 - Healthcare19661health careUtilities7XLU207 - Utilities19660utilitiesTelecom8IYZ308 - CommunicationServices21525telecomEnergy9XLE309 - Energy19655energyIndustrials10XLI310 - Industrials19657industrialsTechnology11XLK311 - Technology19658technologyEach sector factor's returns are known and every asset in Quantopian’s database is mapped to atmost one single sector. Therefore, only the sector factor exposures need to be estimated.6
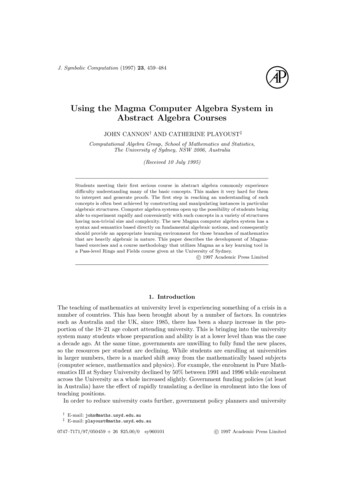
Quantopian Risk ModelStyle FactorsThe QRM includes 5 style factors: momentum, size, value, short term reversal, and volatility. Eachstyle factor is designed to replicate a traditional investment strategy. The following table mapseach style factor to its index in the mathematical model (1) and variable name in the QuantopianAPI.Style index 𝒌Variable name in theQuantopian APImomentum1momentumsize2sizevalue3valueshort term reversal4reversal short termvolatility5volatilityStyle factor nameStyle Factor DefinitionsMomentumThe momentum factor captures the difference in returns between stocks on an upswing (winnerstocks) and stocks on a downswing (loser stocks) over a trailing 11-month period.SizeThe size factor captures the difference in returns between large-cap stocks and small-cap stocks.ValueThe value factor captures the difference in returns between inexpensive stocks and expensivestocks.VolatilityThe volatility factor captures the difference in returns between high volatility stocks and lowvolatility stocks.Short-term reversalThe short-term reversal factor captures the difference in returns between stocks with strongrecent losses theoretically primed to reverse (recent loser stocks) and stocks with strong recentgains theoretically primed to reverse (recent winner stocks) in a short time period.7
Quantopian Risk ModelStyle Factor Metric FormulasThe style factor metrics are used to describe the style factors. Below, we provide themathematical definition for each style factor metric in the QRM.MomentumThe momentum metric of an asset 𝑖, MOMENTUM, on day 𝑡 is computed by calculating the 11month cumulative return from 12 months ago to 1 month ago3. The formula isg𝒄h𝒕g𝟏MOMENTUM f@𝟏 𝒓𝒊,𝒍 A,𝒍.g𝒄 𝟏𝟐h𝒕g𝟏Where:-𝒓𝒊,𝒍 is return of asset 𝑖 on day 𝑙𝑐 is the number of trading days in one month4SizeThe size metric of asset 𝑖, SIZE, on day 𝑡 is computed by calculating the 𝑙𝑜𝑔 of its company’smarket capitalization. The formula isSIZE 𝐥𝐨𝐠@ 𝑴𝒊,𝒕g𝟏 AWhere:-𝑴𝒊,𝒕g𝟏 is the market capitalization of asset 𝑖 on day 𝑡 153To avoid look-ahead bias, all the style factor metrics are lagged by one day.Here, the constant 𝑐 is set as 21.5The companies’ financial data used on Quantopian is Morningstar fundamental data accessedthrough the Pipeline API.48
Quantopian Risk ModelValueThe value metric of asset 𝒊, VALUE, on day 𝒕 is computed by calculating the ratio of thecompany’s stockholders’ equity and market capitalization. The formula isVALUE �,𝒕g𝟏 is the company’s stockholder’s equity of asset 𝑖 on day 𝑡 1Short-term reversalThe short-term reversal metric of
sectors, which give an idea of the space a company works within, as in the BARRA risk model (BARRA, Inc. 1998), or style factors, which mimic investment styles such as investing in “small cap” companies or “high growth” companies, as in the Fama-French 3-factor model (Fama and French 1993). Specific risk is defined here as risk that is unexplainable by the common risk factors included in a risk File Size: 215KBPage Count: 16