Transcription
HKEX Investor PresentationInvestor RelationsFeb, 2021
DisclaimerThe information contained in this document is for general informational purposes only and does not constitute an offer, solicitation, invitation orrecommendation to subscribe for or purchase any securities, or other products or to provide any investment advice or service of any kind. Thisdocument is solely intended for distribution to and use by professional investors. This document is not directed at, and is not intended fordistribution to or use by, any person or entity in any jurisdiction or country where such distribution or use would be contrary to law or regulation orwhich would subject Hong Kong Exchanges and Clearing Limited (“HKEX”) to any registration requirement within such jurisdiction or country.This document contains forward-looking statements which are based on the current expectations, estimates, projections, beliefs andassumptions of HKEX about the businesses and the markets in which it and its subsidiaries operate. These forward-looking statements are notguarantees of future performance and are subject to market risk, uncertainties and factors beyond the control of HKEX. Therefore, actualoutcomes and returns may differ materially from the assumptions made and the statements contained in this document.Where this document refers to Shanghai-Hong Kong Stock Connect and/or Shenzhen-Hong Kong Stock Connect (together, the “Stock Connect”programs), please note that currently, access to northbound trading is only available to intermediaries licensed or regulated in Hong Kong;southbound trading is only available to intermediaries licensed or regulated in Mainland China. Direct access to the Stock Connect is notavailable outside Hong Kong and Mainland China.Where this document refers to Bond Connect, please note that currently, access to northbound trading is only available to foreign investors thatare able to trade onshore bonds on the China Foreign Exchange Trade System & National Interbank Funding Centre.Although the information contained in this document is obtained or compiled from sources believed to be reliable, HKEX does not guarantee theaccuracy, validity, timeliness or completeness of the information or data for any particular purpose, and shall not accept any responsibility for, orbe liable for, errors, omissions or other inaccuracies in the information or for the consequences thereof. The information set out in this documentis provided on an “as is” and “as available” basis and may be amended or changed. It is not a substitute for professional advice which takesaccount of your specific circumstances and nothing in this document constitutes legal advice. HKEX shall not be responsible or liable for any lossor damage, directly or indirectly, arising from the use of or reliance upon any information provided in this document.
Agenda01 Key Performance and Growth Drivers02 Group Financial Update03 Strategic Plan 2019-202104 China Connectivity05 AppendixFinancial supplement & Market indicators
HKEX – Leading Vertically Integrated Exchange GroupHKEX GROUPFinancialsFY2019 Leading diversified exchange group in the Asian Time Zone HK’s only exchange group World’s leading IPO venue – ranked #1 in 7 of the past 12 years1 Pioneer in Mainland capital markets connectivity London Metal Exchange – globally leading base metals exchangePrimary & Secondary MarketsCash EquitiesEquity & UE:HK 16.3bnHK 19.2bnEBITDA:EBITDA:HK 12.3bnHK 14.6bnPAT:PAT:HK 9.4bnHK 11.5bnEPS:EPS:HK 7.49HK 9.11DPS:DPS:HK 6.71HK 8.17(90% payout)(90% payout)Post TradeMarket AccessPost TradeTechnologyMarket Data26%17%7%40%5%2020RevenueShare2Note: Figures for FY2020 (unless otherwise stated)1. From 2009 to 20202. Corporate items accounted for 5% of total revenue in 2020 and are not shown on this slide.4
2020 Key Highlights1 2 Financial Performance Record financial results for third consecutive year Record revenue and other income of HK 19,190mn with core business revenue up by 24%YoY, reflecting higher trading and clearing fees driven by record headline ADT Record Stock Connect revenue and other income of HK 1,926mn ( 91% YoY) Net investment income down by 18% YoY at HK 2,228mn, due to lower fair value gainsfrom collective investment schemes and lower interest income Profit attributable to shareholders at record high of HK 11,505mn ( 23% YoY)Business and Strategy Strong IPO market – #2 globally by IPO funds raised (HK 400.2bn, 27% YoY) and #4 bynumber of new company listings (154) Strong performance in Connect schemes – record high ADT across all channels Launched 38 MSCI Asia and Emerging Markets Index Futures, representing a major stepforward in the expansion of HKEX’s derivatives product portfolio LME demonstrated resiliency and adaptability, including a successful temporary migration oftrading activities from the Ring to electronic pricing since March Launched HKEX’s Sustainable and Green Exchange (STAGE), Asia’s first multi-assetsustainable investment product platform; Launch of HKEX Foundation5
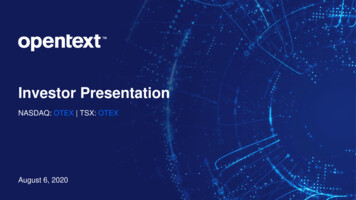
Core Business Well-Positioned for Organic and Structural GrowthABroad Product Ecosystem Attracting Diverse Mainland and International Investor BaseSecurities ADT(HK billion)CAGRDerivatives ADV(’000 contracts)FuturesCAGR Southbound Connect1,513 11.4%1,2041,069 Jumbo IPOs769 7621292019201820172016 After-hours Trading2015201420132021202033Transformational Growth from China’s Opening1CIPOs Driving ADT Growth Algo / Quant Investors870533 577 Global 71,133 Risk Management20212462020 10.8%106Options# of IPOsTotal IPO funds raised (US billion) New Economy ListingReformsD WVR150 091Secondary Listings100 Strong Pipeline of50 Mainland and3 A-share Inclusion inGlobal Benchmarks 51.6% 72.3%International Listings24426 5 10203 43 SB Connect Limited byInvestor Eligibility Cap10 13 1120212002020250 Continuing 017201620152014201312018317410015413812680 110 1226051.3 1436.6 40.130.0 33.9 25.24021.816.4201.30Biotech2018218CAGRCAGR 2017#72016#2Southbound ADT2(HK 2015Global fundraising rankNorthbound ADT2(RMB billion)3Focus on Revenue Growth and Cost DisciplineSource: HKEX, Dealogic.1. Shanghai-HK and Shenzhen-HK Stock Connect was launched in Nov 2014 and Dec 2016 respectively.2. Buy Sell ADT.3. 2021 YTD as of Jan 2021.6
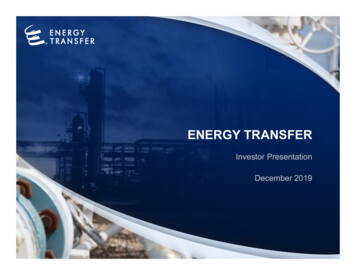
Diverse International Investor Base Attracted to Broad Product EcosystemAAlgo / Quant Participation in Cash ly low(circa. 10-20% of ADT)Due to Presence of stamp duty Minimal high frequency trading Single market structureStockConnectCBBCsAlgo / Quant Participation in Derivatives MarketDWsStocksA-shareDerivatives1Relatively high(circa. 40-60% of ADV)Driven by No stamp duty Market maker participation Capital efficiencyBondConnectOTCRecent initiatives and future focusIndexFuturesAsia & EMIndex Futures2ETPs1.2.CurrencyFutures Market microstructure enhancements: leading to better pricediscovery and trade efficiency Targeted marketing and client support: onboarding 10 clientseach year Incentives: driving increased volumes Product cross-selling: creating arbitrage opportunitiesHKEX signed a licence agreement with MSCI to introduce futures contracts on the MSCI China A Index, subject to regulatory approval and market conditions.HKEX signed a licence agreement with MSCI to introduce 39 futures and options contracts in Hong Kong based on a suite of indexes in Asia and Emerging Markets, subject to regulatoryapproval and market conditions (38 already launched since Sep 2020).7
New MSCI Suite – Growing Product Ecosystem to Connect Global TradesAHKEX MSCI Product Suite1NTRRegionalSingle countryMSCI AustraliaMSCI China FreeMSCI Hong KongMSCI IndiaMSCI IndonesiaMSCI JapanMSCI Japan (JPY)MSCI MalaysiaMSCI New ZealandMSCI PhilippinesMSCI SingaporeMSCI Singapore FreeMSCI TaiwanMSCI Taiwan 25/50MSCI ThailandMSCI VietnamMSCI AC Asia ex Japan2MSCI EM AsiaMSCI EM Asia ex ChinaMSCI EM Asia ex KoreaMSCI EM EMEAMSCI EM ex ChinaMSCI EM ex KoreaMSCI EM LatAmMSCI Emerging MarketsMSCI PacificMSCI Pacific ex JapanMSCI China FreeMSCI IndiaMSCI IndonesiaMSCI Japan (JPY)MSCI MalaysiaMSCI PhilippinesExpanding our product UNDERLYING Licenced a suite of MSCI indexes in Asia and EmergingMarkets to introduce 39 futures and options contracts (38already launched as of Sep 2020)Broadening and deepening LIQUIDITY Allow investors to Trade Asia, in Asia Complement existing HSI and HSCEI index futuresPrice ReturnSingle countryKey DynamicsRegionalMSCI Taiwan 25/50 MSCI Emerging MarketsMSCI ThailandMSCI Singapore Free(SGD)MSCI TaiwanMSCI VietnamOptionsEnhancing our COMPETITIVENESS Better capital efficiency Creating a competitive one-stop shop for China and AsianexposuresMSCI TaiwanReinforces Hong Kong’s role as the leading global market in the Asian Time Zone, with the broadest suite of MSCIderivatives products1. All contracts denominated in USD unless otherwise specified2. Started trading in HKEX since 20188
ANew MSCI Suite –ADV and Open Interest slowly building upADV (No. of Contracts)9,64310,0008,8109,6489,554Others1MSCI Indonesia NTR8,0006,0005,0724,000MSCI TH NTRSGX (FTSE Taiwan CappedMSCI China Free NTRproducts) while still recordingMSCI TW 25/50meaningful ADV sinceMSCI TWlaunch2,000 Encouraging capture of OI478250 Intense competition fromagainst global landscape0Jul-20 Aug-20 Sep-20 Oct-20 Nov-20 Dec-20 Jan-21(e.g. migration of large clientposition from Eurex in Oct)OI (No. of Contracts) Expect to see continuous94,847100,000Others177,66080,000MSCI TH NTR62,975 59,80660,000migration with upcoming rolls44,066MSCI Indonesia NTRMSCI TW NTRMSCI JP NTR40,000MSCI TW20,00003303,967Jul-20 Aug-20 Sep-20 Oct-20 Nov-20 Dec-20 Jan-211. Mainly from MSCI Malaysia NTR, India NTR and EM Asia NTR9
AETP – A Growing Contributor along with Market Structure Enhancements 6.4BADT2020 5.0B ADTCONTINUOUS QUOTING ANDNEW SPREAD TABLE (JUN)2019 4.5BADT2018DESIGNATED SPECIALISTSA-SHARE L&I PRODUCTS (JUL)INTRODUCE ICSD SETTLEMENTMODELMARKET MAKERSTAMP DUTY EXEMPTION (AUG)ACTIVE ETFS-2X INVERSE PRODUCTSOFCSTRUCTUREGREATERPRODUCT DIVERSITYHONG KONG/MAINLAND ETFCROSS-LISTING (OCT)MARKET MAKER BUY-INEXEMPTIONDEEPENEDLIQUIDITY POOLLOWERTRADING COSTSIMPROVEDMARKET QUALITYOur aspiration is to become Asia’s ETP Marketplace10
Strongly Performing IPO Market boosted by New Economy Issuers andSecondary ListingsB2020 Jan - Dec Fundraising SummaryHK 400.2bn50 New EconomyIPO Funds Raised(#2 globally)& Biotech Companies Listed raisingHK 257.4bn 27% YoY 67% YoYIPO Funds Raised by SegmentsNo. of IPO– Total– New Economy1– Biotech214 HKEX was delighted to host its first ever Southeast AsiaForum on 3 Dec 2020400.2 Dialogues with the Biotech Community with PhiRDA attracted 292,000 views HKEX Biotech Summit 2020 (Virtual) – receivedextensive interest from scientists, biotech entrepreneurs,investors, technology experts and policymakers Ongoing listing �s second-largest fund raising hub for biotechcompanies218IPO Funds Raised(HK bn)200 20182019202044.484.102017OthersSource: HKEX, as of Dec 2020.1.Include Non-18A Biotech companies2.Only include Chapter 18A Biotech companiesBiotechNew Economy Shortening of IPO settlement cycle Enhancing listing regime for overseas issuers Enhancing the bookbuilding and price discovery aspectsof IPOs (cornerstone investors, pricing flexibility,clawback mechanism)11
Jumbo IPOs Contributing to Increased Trading ActivityB28 Jumbo IPOs US 1bn (HK 7.8bn) since Jan 62728Company nameAlibaba Group - SWChina Tower - HBudweiser Brewing APACXiaomi Corporation - WJD.COM - SWMeituan Dianping - WJD Health InternationalNetease - SYum China - SChina Bohai Bank - HGDS - SWEvergrande PropertyESR Cayman Ltd.Tigermed - HChina Resources MixcNew Oriental - SBlue Moon GroupZTO Express - SWShimao ServicesNongfu Spring - HShenwan Hongyuan - HHansoh Pharmaceutical GroupTopsports InternationalPing An Healthcare &TechJiangxi Bank - HWuXi AppTec - HSmooreSunac ServiceIPO 201813/12/201810/07/202019/11/2020IPO size(HK 609.099.049.018.778.608.288.198.00Rising contribution to volumes from Jumbo IPOsCash Market ADT (HK bn) contributedby the Jumbo IPOs and related Structured Products ADT% of respective ADT% of single stock option 0%9.23.32018201920202021 YTDIn 2021, 19% of cash ADT and 18% of stock option ADV is contributed by the top 28 IPOs since 2018Source: HKEX, as of Jan 2021. S – Secondary listings; W – Weighted Voting Rights; H – H shares1. Ranked by IPO size.12
BContinuous Trading Volume Migration and ADR conversion fromSecondary ListingsHKEX Trading Share – 2020 YTDADR conversion to HK sharesAlibaba% ofTradingAlibabaNetEaseJD.com18.1%32.9%JD.com 560%16.5%SEHKNetEase 145% 73%12.5%8.8%22.5%5.1%5.1%2.5%FINRA Dec-2011/06/2020 Dec-20(IPO)18/06/2020(IPO)Dec-20Number of Hong Kong (freely traded) shares as % of total issued shares globallyStrong Boost to HK Markets TradingNASDAQ11.3%27.4%26.3%NYSE Arca7.8%7.2%7.8%Other USExchanges17.8%13.5%15.0%Alibaba,NetEase & JDMarket Total%Equities DWs CBBCs(HK bn)10.9129.58.4SSO(Volume, ‘000)24.8526.24.7ADT/ADV in HKEXAlibaba, NetEase and JD.com secondary listings have contributed 8% ADT YTD 2020 to Hong Kong market’s liquidity,with a clear trend of ADR conversion to HK sharesSource: HKEX, FactSet, as of 31 December 2020 (Quarterly update)Note: Alibaba is listed on NYSE, while NetEase and JD.com are listed on NASDAQ1. Based on total CCASS balance deducting the balance of main custodian bank as reference13
CTransformational Growth from China’s OpeningStock Connect1Bond ConnectNorthboundSouthboundTotal Foreign Participation in CIBM 2(RMB billion)(HK billion)(RMB billion)Portfolio ValueForeign Holdings in Chinese Bonds(US bn)Portfolio ValueForeignOwnership (%)3.4%CAGR2,340 2,461 79.7% 9668125 1864.0%3.5%5001,1389275316002,097 2,400Bond ConnectUS 535bnlaunch2,541CAGRInvestorsOnboarded01.5%YTD ADTRMB29.4bn1.0%0.5%0.0%3 Continuing portfolio diversification by Mainland andinternational investors Inclusion of Mainland bonds into global fixed incomeindices Inclusion of A shares into major global benchmarks Easier access to the Mainland bond market via moretrading platforms Increasing selection of new economy companies inSouthbound Stock Connect Increasing use of RMB globally and need to reinvestinto RMB assetsBenefiting from the increased capital flow into and out of Mainland China,in particular inbound flows driven by international index inclusionsSource: HKEX, Bond Connect, ChinaBond, SCH;1. Shanghai-HK and Shenzhen-HK Stock Connect was launched in Nov 2014 and Dec 2016 respectively.2. Foreign participation in CIBM was first allowed in 2010 when the PBOC rolled out a Pilot Scheme to allow foreign financial institutions to invest in CIBM.3. Data as of Jan 31st, 2021.14
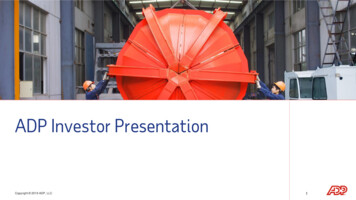
DFocus on Revenue Growth and Cost Discipline2016-20202013-2016 ADT re-rating Stock Connect – Shanghai Stock Connect – Shanghai Shenzhen After-hours trading Continuing growth in derivatives LME fee commercialisation Listing reforms and new economy issuers Launch of LME Clear Revamped investment income approachRevenue (HK million)EBITDA (HK 16,311201674%75%77%13,180201720182019 17.6% 8.8%10,085201573%CAGR19,19015,8678,72370% 14.6% 14201711,75712,2632018201914,6412020Reaping rewards from the structural growth initiatives that have already been implemented15
DFocus on Revenue Growth and Cost Discipline2016-20202013-2016 Reaping rewards of past investments andbenefiting from operating leverage Investment in growth initiatives to captureChina opportunities Increased cost discipline Upgrading core infrastructure to strengthentechnological foundation Investment in automation and operationalefficiencyOperating Expenses (HK million)Profit Attributable to Shareholders (HK million)Net ProfitMarginCAGR52%52%59%52%56%59%58%60% 7.1% 7.6%4,1102,7772,9583,2903,4553,566CAGR4,5494,048 8.2%11,5057,9562013201420152016201720182019 1201820197,40420172020Increased operating leverage from revenue growth, delivered by structural drivers combined with opex discipline1. If the impact of HKFRS 16 were excluded, 2019 Operating Expense would be HK 4,362 million and the 2016-2019 CAGR would be 8.1%.16
Sustainability is at our core, and is business criticalProgressing our financial markets and communities for the benefit of allTALENTRISKENGAGEMENTREPUTATIONOUR PEOPLEOUR MARKETS Swift COVID-19 response with timelydisclosure & AGM guidance andcommunications Ongoing promotion of ESG standards withthe updated ESG Guide, new e-Learningseries and updated ESG guidance letter andactive involvement in global ESGstandardisation engagement Promoting sustainable and green financewith the launch of STAGE and the LME’ssustainability plan Official launch of HKEX Foundation with theflagship 20m Charity PartnershipProgramme, 10m COVID-19 emergencyrelief donations and HKEX UniversityScholarship, as well as other ongoingdonations and e-volunteering activities forthe community Supporting employees’ wellbeing acrossthe Group, especially during COVID-19 Championing workplace diversity throughinternal training, advocacy and partnershipwith professional groups, universities andNGOsCULTUREOUR OPERATIONS Engaged the markets in adoptingsustainable business practices, e.g. e-IPOregime, LME passport Internal evaluations of board performance Ongoing enhancement of employees’awareness of our legal and complianceobligations Implementation of HKEX Future Workplaceand digitalisation of internal workflows toimprove efficiency and reduce paperconsumptionRecognised as a sustainability leader with the constituent status in various sustainability indexes,e.g., DJSI, FTSE4Good, Hang Seng Corporate Sustainability Index series17
Agenda01 Key Performance and Growth Drivers02 Group Financial Update03 Strategic Plan 2019-202104 China Connectivity05 AppendixFinancial supplement & Market indicators
Key Financial HighlightsRecord revenue and profit for third consecutive yearLow interest rate environment impacted investment income(HK )Total revenue & other income(2)Core business revenue(3)Net investment income 24% 18%-18% 16.3bn 19.2bn 13.6bn 16.9bn 2.7bn 2.2bn201920202019202020192020EBITDABasic earnings per sharePAT 22% 23% 19% 12.3bn 14.6bn20192020Margin(4)75%1.2.3.4.77% 9.4bn 11.5bn20192020 7.49 9.1120192020Dividend per share (full year) 22% 6.71 8.1720192020All percentage changes are computed based on amounts reported in financial statements.Represents gross revenue and other income before deducting transaction-related expenses (2020: HK 110mn; 2019: HK 51mn)Core business revenue represents total revenue and other income, excluding net investment income and HKEX Foundation donation income (2020: HK 106mn; 2019: Nil).EBITDA margin is calculated based on EBITDA divided by revenue and other income less transaction-related expenses.19
2020: Record Revenue and Profit for Third Consecutive YearReven
1. Shanghai-HK and Shenzhen-HK Stock Connect was launched in Nov 2014 and Dec 2016 respectively. 2. Buy Sell ADT. 3. 2021 YTD as of Jan 2021. Broad Product Ecosystem Attracting Diverse Mainland and International Investor Base IPOs Driving ADT Growth Transformational Growth from China’s Opening1 Southb