Transcription
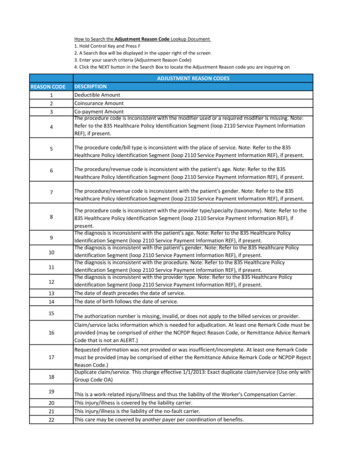
Maine Department of strictActon School DepartmentAlexander School DepartmentAppleton School DepartmentAuburn School DepartmentAugusta Public SchoolsBaileyville School DepartmentBancroft School DepartmentBangor School DepartmentBar Harbor School DepartmentBeals School DepartmentBeddington School DepartmentBiddeford School DepartmentBlue Hill School DepartmentBowerbank School DepartmentBremen School DepartmentBrewer School DepartmentBridgewater School DepartmentBristol School DepartmentBrooklin School DepartmentBrooksville School DepartmentBrunswick School DepartmentCalais School DepartmentCape Elizabeth School DepartmentCaratunk School DepartmentCarroll Plt School DepartmentCastine School DepartmentCaswell School DepartmentCharlotte School DepartmentCooper School DepartmentCoplin Plt School DepartmentCranberry Isles School DepartmentCrawford School DepartmentCutler School DepartmentDamariscotta School DepartmentDeblois School DepartmentEPSMaintOfEffortCalc updated06June2012.xlsMaintenance of Effort Adjustment Calculation for Step 6EPSSpecial EducationAllocationsprior toMaintenance ofEffort Adjustment(1)(2)EPS EstimateExcluding FederalRevenuesseeStep 62009-10 ActualState/LocalExpendituresfrom MEDMSFinancialEPSas ofAllocation 413,695 21,531 137,993 4,079,552 2,455,234 154,456 19,125 5,175,862 238,510 61,420 6,127 3,157,222 204,314 0 52,736 1,515,408 88,934 351,195 104,395 113,612 3,164,832 543,875 1,605,708 0 54,199 115,381 71,081 97,512 13,598 13,812 10,579 34,027 91,019 119,003 01/5/2011 770,176 31,896 201,894 6,069,527 3,356,823 301,552 6,086 5,433,396 578,396 67,657 0 4,922,810 405,033 0 126,460 1,902,035 12,634 418,081 224,058 142,890 3,694,475 948,795 2,403,026 0 14,065 113,063 8,045 152,216 0 0 35,708 12,634 51,102 141,765 0(3)Revised 6/06/12 due to update to Actual High Cost Out-of-District Adjustment(5)2009 Students w2009-10 ActualDisabilitiesState/Local(Excluding SACs2009-10 MedicaidExpendituresand StateRevenuesExclude MedicaidWards)from MEDMSFinancialCol. 210/1/2009as of1/5/2011 63,332 0 0 643,935 425,361 0 0 676,913 26,059 5,594 0 754,181 61,047 0 9,629 191,052 0 18,469 23,505 11,514 320,568 284,691 154,810 0 0 2,942 9,516 10,366 0 0 6,625 0 10,868 7,879 0(4)minusCol. 3 706,844 31,896 201,894 5,425,592 2,931,462 301,552 6,086 4,756,483 552,337 62,063 0 4,168,629 343,986 0 116,831 1,710,983 12,634 399,611 200,553 131,376 3,373,907 664,103 2,248,216 0 14,065 110,121 0 141,850 0 0 29,083 12,634 40,234 133,885 0EPS unt(7)(8)(9)Final Adjusted2010 PupilsPreliminaryExpenditures for(ExcludingAdjustedMOE - not greaterSACs and Expenditures forthan actualState Wards)MOEexpenditures(10)(11)Adjusted MOEBased on PerPupilExpendituresCol. 9minusLoss of HighCost OutDistrictStudentsseeMaint. OfCol. 410/1/2010Col. 6Col. 8divided byEPS Octobertimesno greater thanCol. 5 9,300.57 10,631.92 10,626.01 8,736.86 7,817.23 11,168.58 2,028.81 8,330.09 15,781.06 15,515.64 0.00 8,850.59 11,096.33 0.00 9,735.95 9,100.97 842.27 8,502.37 7,713.59 8,758.40 8,855.40 9,766.23 12,630.43 0.00 2,812.96 10,010.96 0.00 15,761.15 0.00 0.00 14,541.37 3,158.45 4,023.42 9,563.23 797417604861211237150Col. 7 613,838 31,896 233,772 5,329,485 3,064,354 290,383 4,058 4,773,142 662,805 93,094 0 3,708,397 366,179 0 77,888 1,729,184 10,950 382,607 161,985 131,376 3,356,197 722,701 2,222,956 0 11,252 80,088 0 189,134 0 0 29,083 9,475 28,164 143,448 0Col. 4 613,838 31,896 201,894 5,329,485 2,931,462 290,383 4,058 4,756,483 552,337 62,063 0 3,708,397 343,986 0 77,888 1,710,983 10,950 382,607 161,985 131,376 3,356,197 664,103 2,222,956 0 11,252 80,088 0 141,850 0 0 29,083 9,475 28,164 133,885 0Col. 1If Col. 9 is greater 200,143 10,365 63,901 1,249,933 476,227 135,927 0 0 313,828 643 0 551,175 139,672 0 25,151 195,574 0 31,411 57,590 17,764 191,364 120,228 617,248 0 0 0 0 44,338 0 0 18,504 0 0 14,883 0EffortDescription 0 0 0 0 19,251 0 0 0 0 0 0 51,006 0 0 0 0 0 0 0 0 11,001 0 0 0 0 0 0 0 0 0 0 0 0 0 0(12)(13)Sub-TotalFinal MOEAdjustmentCol. 10minusCol. 11 200,143 10,365 63,901 1,249,933 456,977 135,927 0 0 313,828 643 0 500,169 139,672 0 25,151 195,574 0 31,411 57,590 17,764 180,363 120,228 617,248 0 0 0 0 44,338 0 0 18,504 0 0 14,883 0PositivenumbersfromCol. 12 200,143 10,365 63,901 1,249,933 456,977 135,927 0 0 313,828 643 0 500,169 139,672 0 25,151 195,574 0 31,411 57,590 17,764 180,363 120,228 617,248 0 0 0 0 44,338 0 0 18,504 0 0 14,883 0Page 1 of 7
Maine Department of 1214215216217222223226227233DistrictDedham School DepartmentDennistown Plt School DepartmentDennysville School DepartmentDrew Plt School DepartmentEast Machias School DepartmentEast Millinocket School DepartmentEaston School DepartmentEastport School DepartmentEdgecomb School DepartmentFalmouth School DepartmentFayette School DepartmentGeorgetown School DepartmentGilead School DepartmentGlenwood Plt School Dept.Gorham School DepartmentGrand Isle School DepartmentGrand Lake Stream Plt School DeptGreenbush School DepartmentGreenville School DepartmentHarmony School DepartmentHermon School DepartmentHersey School DepartmentHighland Plt School DepartmentHope School DepartmentIsle Au Haut School DepartmentIslesboro School DepartmentJay School DepartmentJefferson School DepartmentJonesboro School DepartmentJonesport School DepartmentKingsbury Plt School DepartmentKittery School DepartmentLake View Plt. School DepartmentLakeville School DepartmentLewiston School DepartmentEPSMaintOfEffortCalc updated06June2012.xlsMaintenance of Effort Adjustment Calculation for Step 6EPSSpecial EducationAllocationsprior toMaintenance ofEffort Adjustment(1)(2)EPS EstimateExcluding FederalRevenuesseeStep 62009-10 ActualState/LocalExpendituresfrom MEDMSFinancialEPSas ofAllocation 228,829 0 83,070 0 241,046 228,488 179,507 98,883 194,794 1,857,845 97,193 145,705 27,020 0 2,812,988 97,682 0 307,589 137,013 148,126 817,768 0 0 136,932 22,711 106,774 703,684 428,426 105,075 74,569 0 1,431,512 0 0 7,843,9151/5/2011 365,338 0 61,304 0 227,294 392,436 212,474 527,725 371,938 2,698,195 162,732 168,942 0 0 3,878,443 2,089 0 217,667 353,181 221,492 802,368 0 0 221,590 17,436 93,209 999,317 539,368 101,217 108,731 0 2,363,036 0 0 9,739,837(3)Revised 6/06/12 due to update to Actual High Cost Out-of-District Adjustment(5)2009 Students w2009-10 ActualDisabilitiesState/Local(Excluding SACs2009-10 MedicaidExpendituresand StateRevenuesExclude MedicaidWards)from MEDMSFinancialCol. 210/1/2009as of1/5/2011 23,820 0 8,553 0 37,455 83,302 0 42,292 35,428 0 16,337 7,276 0 0 0 0 0 0 9,000 49,591 79,400 0 0 0 0 2,106 125,319 30,952 10,811 25,881 0 190,803 0 0 15,045(4)minusCol. 3 341,518 0 52,751 0 189,839 309,134 212,474 485,433 336,511 2,698,195 146,395 161,666 0 0 3,878,443 2,089 0 217,667 344,181 171,901 722,968 0 0 221,590 17,436 91,103 873,998 508,416 90,406 82,850 0 2,172,233 0 0 9,724,792EPS unt(7)(8)(9)Final Adjusted2010 PupilsPreliminaryExpenditures for(ExcludingAdjustedMOE - not greaterSACs and Expenditures forthan actualState Wards)MOEexpenditures(10)(11)Adjusted MOEBased on PerPupilExpendituresCol. 9minusLoss of HighCost OutDistrictStudentsseeMaint. OfCol. 410/1/2010Col. 6Col. 8divided byEPS Octobertimesno greater thanCol. 5 12,648.80 0.00 5,861.24 0.00 5,932.45 6,308.86 4,336.20 18,670.49 9,614.59 12,209.03 8,133.06 11,547.59 0.00 0.00 9,843.76 160.70 0.00 3,455.03 11,102.61 4,911.46 6,455.07 0.00 0.00 10,072.26 8,717.92 8,282.10 7,105.67 8,200.26 11,300.71 5,523.36 0.00 12,629.26 0.00 0.00 11100193189955812017700750Col. 7 328,869 0 35,167 0 261,028 264,972 221,146 504,103 269,209 2,515,060 121,996 92,381 0 0 3,346,878 2,089 0 193,482 266,463 181,724 716,513 0 0 191,373 26,154 149,078 703,461 451,014 90,406 66,280 0 2,235,379 0 0 9,447,660Col. 4 328,869 0 35,167 0 189,839 264,972 212,474 485,433 269,209 2,515,060 121,996 92,381 0 0 3,346,878 2,089 0 193,482 266,463 171,901 716,513 0 0 191,373 17,436 91,103 703,461 451,014 90,406 66,280 0 2,172,233 0 0 9,447,660Col. 1If Col. 9 is greater 100,040 0 0 0 0 36,484 32,967 386,550 74,414 657,215 24,803 0 0 0 533,891 0 0 0 129,450 23,775 0 0 0 54,441 0 0 0 22,588 0 0 0 740,720 0 0 1,603,745EffortDescription 20,150 0 0 0 0 0 0 0 0 0 0 0 0 0 0 0 0 0 0 9,441 0 0 0 0 0 0 0 0 0 0 0 0 0 0 5,449(12)(13)Sub-TotalFinal MOEAdjustmentCol. 10minusCol. 11 79,890 0 0 0 0 36,484 32,967 386,550 74,414 657,215 24,803 0 0 0 533,891 0 0 0 129,450 14,334 0 0 0 54,441 0 0 0 22,588 0 0 0 740,720 0 0 1,598,296PositivenumbersfromCol. 12 79,890 0 0 0 0 36,484 32,967 386,550 74,414 657,215 24,803 0 0 0 533,891 0 0 0 129,450 14,334 0 0 0 54,441 0 0 0 22,588 0 0 0 740,720 0 0 1,598,296Page 2 of 7
Maine Department of 9340342348353355357361364367DistrictLincoln Plt School DepartmentLincolnville School DepartmentLisbon School DepartmentFrenchboro School DepartmentLowell School DepartmentMachias School DepartmentMachiasport School DepartmentMacwahoc Plt School DeptMadawaska School DepartmentMarshfield School DepartmentMeddybemps School DepartmentMedway School DepartmentMilford School DepartmentMillinocket School DepartmentMonhegan Plt School DeptMoro Plt School DepartmentMount Desert School DepartmentNashville Plt School DepartmentNewcastle School DepartmentNew Sweden School DepartmentNobleboro School DepartmentNorthfield School DepartmentOrient School DepartmentOrrington School DepartmentOtis School DepartmentPembroke School DepartmentPenobscot School DepartmentPerry School DepartmentPleasant Ridge Plt School DeptPortland Public SchoolsLong Island School DepartmentPrinceton School DepartmentRangeley Plt School DepartmentReed Plt School DepartmentRobbinston School DepartmentEPSMaintOfEffortCalc updated06June2012.xlsMaintenance of Effort Adjustment Calculation for Step 6Revised 6/06/12 due to update to Actual High Cost Out-of-District AdjustmentEPSSpecial EducationAllocationsprior toMaintenance ofEffort Adjustment(1)(2)EPS EstimateExcluding FederalRevenuesseeStep 62009-10 ActualState/LocalExpendituresfrom MEDMSFinancialEPSas ofas ofminusEPS OctoberAllocation1/5/20111/5/2011Col. 3Report 0 134,771 1,426,418 4,210 86,116 185,881 63,724 19,012 540,752 53,171 13,529 128,915 486,618 459,823 12,872 0 112,562 0 52,799 98,132 211,456 13,127 0 352,223 81,898 173,256 111,483 147,468 26,956 7,879,106 94,803 95,801 40,120 42,546 108,951 0 346,073 1,885,344 4,582 28,380 238,725 72,284 0 581,238 26,812 276 221,146 718,267 790,079 42,228 0 311,313 0 68,760 105,971 268,364 12,279 4,930 521,859 0 301,343 76,936 184,196 0 12,483,685 56,549 102,666 35,175 10,960 64,199(3)(5)2009 Students w2009-10 ActualDisabilitiesState/Local(Excluding SACs2009-10 MedicaidExpendituresand StateRevenuesExclude MedicaidWards)from MEDMSFinancialCol. 210/1/2009 0 0 181,479 3,290 0 36,129 11,085 0 85,810 1,580 0 56,864 74,098 256,080 0 0 6,797 0 5,063 0 25,353 0 0 3,873 0 24,585 8,683 16,086 0 1,428,527 0 0 0 0 19,610(4) 0 346,073 1,703,865 1,292 28,380 202,596 61,199 0 495,428 25,232 276 164,282 644,169 533,999 42,228 0 304,516 0 63,697 105,971 243,012 12,279 4,930 517,986 0 276,757 68,254 168,110 0 11,055,158 56,549 102,666 35,175 10,960 inal Adjusted2010 PupilsPreliminaryExpenditures for(ExcludingAdjustedMOE - not greaterSACs and Expenditures forthan actualState Wards)MOEexpenditures(10)(11)Adjusted MOEBased on PerPupilExpendituresCol. 9minusLoss of HighCost OutDistrictStudentsseeMaint. OfCol. 410/1/2010Col. 6Col. 8divided byEPS Octobertimesno greater thanReportCol. 7Col. 4Col. 5 0.00 14,419.71 9,848.93 430.58 5,675.99 4,711.52 10,199.85 0.00 6,786.68 8,410.64 276.36 4,831.83 8,365.83 6,512.19 0.00 0.00 15,225.81 0.00 9,099.57 8,830.89 7,594.11 12,279.09 4,930.02 11,020.98 0.00 13,178.92 6,204.88 8,405.50 0.00 10,859.68 11,309.89 4,106.65 8,793.75 1,826.72 42029888223417 0 346,073 1,831,901 431 39,732 207,307 112,198 0 515,788 33,643 276 149,787 677,632 520,975 0 0 304,516 0 63,697 105,971 212,635 12,279 0 628,196 0 303,115 86,868 168,110 0 10,729,364 90,479 90,346 26,381 7,307 39,895 0 346,073 1,703,865 431 28,380 202,596 61,199 0 495,428 25,232 276 149,787 644,169 520,975 0 0 304,516 0 63,697 105,971 212,635 12,279 0 517,986 0 276,757 68,254 168,110 0 10,729,364 56,549 90,346 26,381 7,307 39,895Col. 1If Col. 9 is greater 0 211,302 277,447 0 0 16,714 0 0 0 0 0 20,871 157,551 61,152 0 0 191,955 0 10,898 7,838 1,179 0 0 165,763 0 103,501 0 20,642 0 2,850,258 0 0 0 0 0EffortDescription 0 0 0 0 0 0 0 0 0 0 0 0 0 0 0 0 0 0 0 0 0 0 0 0 0 0 0 0 0 7,325 0 0 0 0 0(12)(13)Sub-TotalFinal MOEAdjustmentCol. 10minusCol. 11 0 211,302 277,447 0 0 16,714 0 0 0 0 0 20,871 157,551 61,152 0 0 191,955 0 10,898 7,838 1,179 0 0 165,763 0 103,501 0 20,642 0 2,842,932 0 0 0 0 0PositivenumbersfromCol. 12 0 211,302 277,447 0 0 16,714 0 0 0 0 0 20,871 157,551 61,152 0 0 191,955 0 10,898 7,838 1,179 0 0 165,763 0 103,501 0 20,642 0 2,842,932 0 0 0 0 0Page 3 of 7
Maine Department of 5476481485487489491492493495DistrictRoque Bluffs School DepartmentSanford School DepartmentScarborough School DepartmentSeboeis Plt School DepartmentSedgwick School DepartmentShirley School DepartmentSouth Bristol School DepartmentSouthport School DepartmentSouth Portland School DepartmentSouthwest Harbor School DepartmentSurry School DepartmentTalmadge School DepartmentThe Forks Plt School DeptTremont School DepartmentTrenton School DepartmentUpton School DepartmentVanceboro School DepartmentVassalboro School DepartmentWaite School DepartmentWaterville Public SchoolsWesley School DepartmentWestbrook School DepartmentWest Forks Plt School DepartmentWestmanland School DepartmentWhiting School DepartmentWhitneyville School DepartmentWillimantic School DepartmentWinslow SchoolsWinthrop Public SchoolsWoodland School DepartmentWoodville School DepartmentYarmouth SchoolsYork School DepartmentBaring Plt School DepartmentMedford School DepartmentEPSMaintOfEffortCalc updated06June2012.xlsMaintenance of Effort Adjustment Calculation for Step 6EPSSpecial EducationAllocationsprior toMaintenance ofEffort Adjustment(1)(2)EPS EstimateExcluding FederalRevenuesseeStep 62009-10 ActualState/LocalExpendituresfrom MEDMSFinancialEPSas ofAllocation 68,964 4,361,707 3,215,291 0 149,551 40,483 93,115 70,175 3,799,790 147,015 251,189 26,601 0 107,674 197,654 13,902 30,352 525,306 0 2,121,571 0 3,307,831 0 0 41,458 55,944 27,240 1,095,094 880,520 150,590 74,693 1,134,864 2,134,269 70,420 53,3911/5/2011 82,771 4,545,227 5,002,997 0 220,270 3,197 185,651 71,119 6,059,925 479,222 327,572 1,516 0 218,022 522,401 0 32,190 1,330,079 21,543 3,069,700 2,317 3,480,625 0 0 41,794 15,025 4,737 2,060,638 1,070,881 210,805 0 2,124,360 3,508,217 38,896 0(3)Revised 6/06/12 due to update to Actual High Cost Out-of-District Adjustment(5)2009 Students w2009-10 ActualDisabilitiesState/Local(Excluding SACs2009-10 MedicaidExpendituresand StateRevenuesExclude MedicaidWards)from MEDMSFinancialCol. 210/1/2009as of1/5/2011 13,216 566,004 184,378 0 25,320 2,038 4,309 3,072 528,872 0 0 0 0 0 337 0 5,150 0 0 0 0 0 0 0 8,131 3,094 0 417,441 106,322 0 0 9,804 90,107 1,447 0(4)minusCol. 3 69,555 3,979,223 4,818,620 0 194,950 1,160 181,342 68,047 5,531,053 479,222 327,572 1,516 0 218,022 522,063 0 27,040 1,330,079 21,543 3,069,700 2,317 3,480,625 0 0 33,662 11,931 4,737 1,643,197 964,559 210,805 0 2,114,555 3,418,110 37,448 0EPS t(7)(8)(9)Final Adjusted2010 PupilsPreliminaryExpenditures for(ExcludingAdjustedMOE - not greaterSACs and Expenditures forthan actualState Wards)MOEexpenditures(10)(11)Adjusted MOEBased on PerPupilExpendituresCol. 9minusLoss of HighCost OutDistrictStudentsseeMaint. OfCol. 410/1/2010Col. 6Col. 8divided byEPS Octobertimesno greater thanCol. 5 8,694.39 6,621.00 12,988.19 0.00 7,498.08 289.93 16,485.65 7,560.80 11,793.29 15,974.06 19,268.93 1,516.00 0.00 9,910.09 20,079.36 0.00 5,407.98 14,457.38 10,771.47 9,592.81 0.00 9,306.48 0.00 0.00 6,732.50 5,965.62 4,736.72 9,336.35 7,906.22 8,432.21 0.00 19,223.23 13,248.49 9,362.01 30035215111528611124654Col. 7 95,638 4,038,810 4,584,831 0 172,456 1,160 197,828 83,169 6,038,164 463,248 443,185 3,032 0 208,112 843,333 0 16,224 1,113,218 0 3,117,663 0 3,378,252 0 0 20,198 29,828 9,473 1,409,789 909,215 236,102 0 2,133,779 3,259,129 46,810 0Col. 4 69,555 3,979,223 4,584,831 0 172,456 1,160 181,342 68,047 5,531,053 463,248 327,572 1,516 0 208,112 522,063 0 16,224 1,113,218 0 3,069,700 0 3,378,252 0 0 20,198 11,931 4,737 1,409,789 909,215 210,805 0 2,114,555 3,259,129 37,448 0Col. 1If Col. 9 is greater 591 0 1,369,540 0 22,905 0 88,227 0 1,731,263 316,233 76,383 0 0 100,437 324,410 0 0 587,913 0 948,129 0 70,421 0 0 0 0 0 314,695 28,696 60,215 0 979,692 1,124,860 0 0EffortDescription 0 2,675 0 0 0 0 0 0 0 0 0 0 0 0 0 0 0 0 0 0 0 0 0 0 0 0 0 0 0 0 0 0 0 0 0(12)(13)Sub-TotalFinal MOEAdjustmentCol. 10minusCol. 11 591- 2,675 1,369,540 0 22,905 0 88,227 0 1,731,263 316,233 76,383 0 0 100,437 324,410 0 0 587,913 0 948,129 0 70,421 0 0 0 0 0 314,695 28,696 60,215 0 979,692 1,124,860 0 0PositivenumbersfromCol. 12 591 0 1,369,540 0 22,905 0 88,227 0 1,731,263 316,233 76,383 0 0 100,437 324,410 0 0 587,913 0 948,129 0 70,421 0 0 0 0 0 314,695 28,696 60,215 0 979,692 1,124,860 0 0Page 4 of 7
Maine Department of 9530531532533535536537540541DistrictCarrabassett Valley School DepartmentBeaver Cove School DepartmentChebeague Island School DepartmentRSU 79/MSAD 01RSU 03/MSAD 03RSU 80/MSAD 04RSU 06/MSAD 06RSU 07/MSAD 07RSU 08/MSAD 08RSU 09/MSAD 09MSAD 10RSU 11/MSAD 11RSU 82/MSAD 12RSU 83/MSAD 13RSU 84/MSAD 14RSU 15/MSAD 15RSU 17/MSAD 17RSU 85/MSAD 19RSU 86/MSAD 20RSU 22/MSAD 22RSU 87/MSAD 23RSU 88/MSAD 24RSU 89/MSAD 25MSAD 27RSU 28/MSAD 28RSU 29/MSAD 29RSU 30/MSAD 30RSU 31/MSAD 31RSU 32/MSAD 32RSU 33/MSAD 33RSU 35/MSAD 35RSU 36/MSAD 36RSU 37/MSAD 37RSU 40/MSAD 40RSU 41/MSAD 41EPSMaintOfEffortCalc updated06June2012.xlsMaintenance of Effort Adjustment Calculation for Step 6Revised 6/06/12 due to update to Actual High Cost Out-of-District AdjustmentEPSSpecial EducationAllocationsprior toMaintenance ofEffort Adjustment(1)(2)EPS EstimateExcluding FederalRevenuesseeStep 62009-10 ActualState/LocalExpendituresfrom MEDMSFinancialEPSas ofas ofminusEPS October1/5/20111/5/2011Col. 3ReportAllocation 70,567 28,278 87,180 2,077,511 1,569,614 591,508 4,848,161 71,014 209,327 1,978,996 15,806 2,234,120 125,546 278,036 90,061 1,995,342 3,377,496 79,242 614,683 2,595,453 962,707 258,635 369,016 1,036,686 773,451 1,583,496 198,722 319,387 325,354 249,991 2,021,572 896,413 817,257 2,443,095 739,041 0 7,456 41,473 1,878,628 2,127,198 695,958 5,309,234 129,965 211,200 2,179,567 0 2,129,376 129,244 311,845 100,322 2,320,045 3,015,474 220,703 673,607 3,848,147 707,588 313,158 536,668 1,441,908 1,484,710 1,472,368 475,817 562,322 217,007 177,324 2,748,169 1,111,205 1,459,459 2,419,800 1,157,353(3)(5)2009 Students w2009-10 ActualDisabilitiesState/Local(Excluding SACs2009-10 MedicaidExpendituresand StateRevenuesExclude MedicaidWards)from MEDMSFinancialCol. 210/1/2009 0 1,974 0 0 0 30,000 505,421 0 35,617 250,000 0 354,647 0 67,791 55,421 235,505 455,579
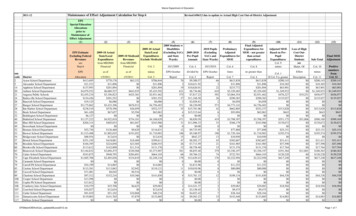
53 Brewer School Department 1,515,408 1,902,035 191,052 1,710,983 188 9,100.97 190 1,729,184 1,710,983 195,574 0 195,574 195,574 54 Bridgewater School Department 88,934 12