Transcription
PerformanceMetrics in AnnualIncentive Plans2014
About EquilarEquilar is the leading provider of executive compensation and corporate governance data for corporations,nonprofits, consulting firms, institutional investors, and the media. As the trusted data provider to 70% of theFortune 500, Equilar helps companies accurately benchmark and track executive and board compensation, Say onPay results, and compensation practices.Equilar's award-winning Equilar Insight product suite is the gold standard for benchmarking and trackingexecutive compensation, board compensation, equity grants, and award policies. With an extensive database andmore than a decade’s worth of data, the Equilar Insight platform allows clients to accurately measure executiveand board pay practices. With Equilar’s Governance Center, companies can better prepare by analyzing historicalvoting results and modeling pay for performance analyses to ensure successful Say on Pay outcomes.Equilar Insight’s Governance Center provides a comprehensive set of tools including: Institutional Shareholder Services (ISS) Simulator Glass Lewis Modeler Pay for Performance Analytics SolutionEquilar’s C-Suite mapping technology within the Equilar Atlas platform identifies pathways to executives andboard members at target companies. With over 350,000 executive and board member profiles, Equilar Atlas is thepremier executive resource for identifying new business opportunities. Equilar regularly publishes proprietaryresearch reports and articles on the most pertinent issues and trends in executive compensation and corporategovernance.Featured InEquilar, Inc.1100 Marshall StreetRedwood City, CA 94063Phone: (650) 241-6600Fax: (650) 701-0993E-mail: info@equilar.comwww.equilar.com
ContentsIntroduction 4Plan Types 5Metrics Overview 5Common Financial Metrics 6Performance Leverage 7Year-Over-Year Changes 8Disclosure Examples 8Clearly disclosed metrics 9Discretionary 10Payout adjustment 10 2014 Equilar, Inc. The material in this publication may not be reproduced or distributed in whole or in part without thewritten consent of Equilar, Inc. This report provides information of general interest in an abridged manner and is not intendedas a substitute for accounting, tax, investment, legal or other professional advice or services. Readers should consult withthe appropriate professional(s) before acting on information contained in this publication. All disclosure examples in thisreport are reformatted to fit this document, and certain sections of sample texts may be bolded to add emphasis. If you havequestions or comments regarding this publication, please email info@equilar.com.
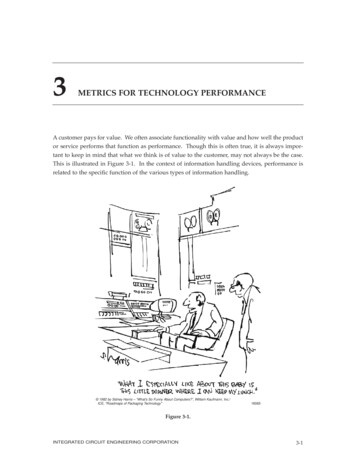
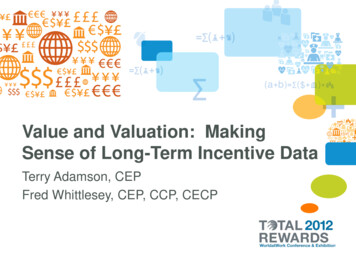
IntroductionAs companies face more pressure to align pay and performance, variable pay constitutes an increasinglylarge portion of executive pay packages. The incentive plans that define the conditions attached to this payare important tools for companies to reward effective management, and annual non-equity incentive plans inparticular are a critical means of delivering cash payouts to executives and setting appropriate short-term goals.Companies utilize a number of different strategies to set performance goals, from allowing discretion of thecompensation committees to choosing from a wide array of quantitative financial metrics.In order to illustrate how companies use performance metrics, Equilar analyzed a random sample of 50companies from the S&P 500 that filed their proxies between January 1 and April 30, 2013. The data spans thetwo most recent fiscal years and concerns annual incentive plans for CEOs who have served in that capacity forboth years. The analysis focused on companies that had plans with concrete financial metrics, rather than oneswith discretionary plans.In this sample of companies, service was the most prevalent industry, with 16 companies. The financial industryfollowed with eight, and the healthcare and technology industries each had six companies. The following graphshows the industry breakdown of the 50 companies analyzed in this article.Performance Metrics in Annual Incentive Plans 4
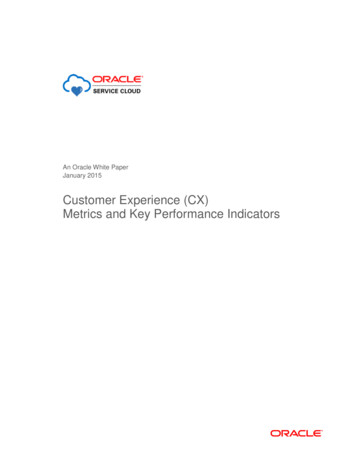
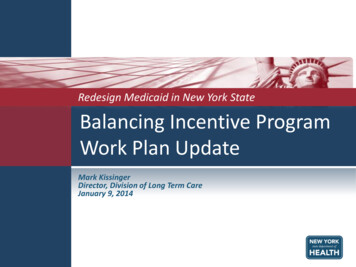
Plan TypesThere are two general types of annual cash incentive plans: those based on financial or market-based metrics,and those that require compensation committee discretion. Of the sample companies, 72.0% had a quantitativeplan that included at least one financial or market-based performance metric. At companies with these plans,executives must achieve pre-established metric targets in order to receive cash payouts. Discretionary plans,on the other hand, do not have strictly measurable financial goals, and the final payout of the plans depends onjudgments made by each company’s compensation committee. Of the companies in this analysis, 24.0% utilizeddiscretionary plans. Only two companies out of the 50 observed had no annual cash incentive plan.Metrics OverviewAcross all companies, having two or three financial metrics was most common. Below is a chart of the number ofcombined financial and market-based metrics these 50 companies used in the last two fiscal years.Performance Metrics in Annual Incentive Plans 5
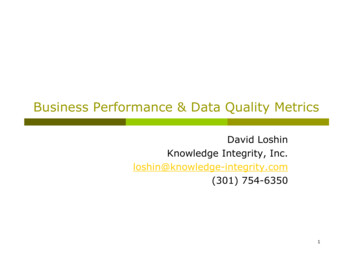
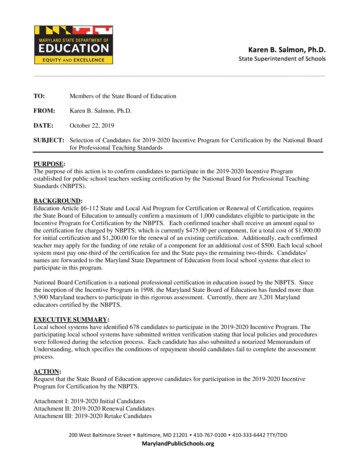
Common Financial MetricsThe most commonly used financial metric in our sample was revenue. Revenue accounted for 20.2% of all thefinancial metrics implemented within the various annual incentive plans over the two fiscal years, ranging from20.0% to 50.0% overall. Earnings per share (EPS) and operating income followed as the second and third mostcommonly used financial metrics, respectively. Although operating income was less common than revenue andEPS, it tended to be weighted more heavily than revenue or EPS, with an average weighting of 52.0%. Overall, atotal of 19 companies used revenue or operating income as one of their financial metrics in either year, and 15companies used EPS. Below are two charts detailing how many times the three most common financial metricswere used across both years, as well as the minimum, average and maximum weightings for each.The following is an industry breakdown showing the most commonly used financial metrics for all the sectorsincluded in this article. The percentage breakdown column represents the number of companies that used eachmetric in their annual incentive plans during either fiscal year divided by the total number of companies that usedthe metric in either fiscal year.Performance Metrics in Annual Incentive Plans 6
Most CommonSectorPercentage BreakdownFinancial MetricBasic MaterialsEPS50.0% (2 of 4)Consumer GoodsEVA, Revenue66.7% (2 of 3)FinancialEPS37.5% (3 of 8)HealthcareRevenue100.0% (6 of 6)Industrial GoodsEPS, Cash Flow60.0% (3 of 5)ServicesOperating Income50.0% (8 of 16)TechnologyOperating Income66.7% (4 of 6)UtilitiesNet Income50.0% (1 of 2)Performance LeverageOne of the most important decisions of plan design is where to set performance goals relative to a given year’sannual budget (i.e., target performance). The minimum performance that yields a payout is referred to as “thethreshold,” while the highest level of performance beyond which no additional incremental payments are madeis “the maximum.” Companies strive to strike a balance between setting sufficiently rigorous targets that satisfyshareholders and having realistic goals that are achievable for the executive team and aid in retaining talent.In addition, the company must consider the volatility of performance and the potential effects of unforeseeableevents. The result of these considerations is the range of performance for various metrics that determine therange of payouts. The range of performance is referred to as “performance leverage,” where more narrow rangesmay cause more volatile payouts, while broader ranges are potentially too lenient.We calculated both the performance and payout leverages for each metric when it was disclosed. Performanceleverage includes both the minimum performance as a percentage of the target and the maximum performanceas a percentage of the target. The charts below show the performance leverage for the five most common metricsin the analysis.Minimum Performance LeverageMetricMinimum25th PercentileMedian75th PercentileMaximumRevenue75%92%95%98%98%Operating Income41%80%88%95%97%EPS25%88%90%91%98%Cash Flow79%82%90%93%97%Net Income65%87%90%95%95%Performance Metrics in Annual Incentive Plans 7
Maximum Performance LeverageMetricMinimum25th PercentileMedian75th ing ash Flow107%111%118%120%122%Net Income100%105%108%110%154%Year-Over-Year ChangesNo company in our analysis switched from a discretionary plan to a financial/market-based plan or vice versa. Ofthe 36 companies in our sample that implemented financial/market-based annual cash incentive plans, only sixadjusted their metrics from the last fiscal year to the current fiscal year. There was not an obvious pattern acrossthe six companies that made changes in the most recent fiscal year, though three of the six companies switchedto the use of operating income from other metrics, such as net income and revenue. Two companies switched tonet income, one from operating income and the other from EPS. The last company switched from economic valueadded (EVA) to earnings before interest, taxes, depreciation and amortization (EBITDA).Metric Used Last Fiscal YearMetric Used This Fiscal YearNet Income and RevenueOperating IncomeRevenueOperating IncomeNet IncomeOperating IncomeOperating IncomeNet IncomeEPSNet IncomeEVAEBITDADisclosure examplesClearly disclosed metrics TE Connectivity Ltd. (TEL)DEF 14A filed on January 15, 2014This table is an example of an annual incentive plan with clearly outlined metric weightings and goals. Thecompany provides information regarding achievement levels of each metric in comparison to executives’ targets,as well as the overall payout percentage per metric.Performance Metrics in Annual Incentive Plans 8
Corporate LevelPerformance Measure (% weighting)PerformanceTargetResultsEPS (20%)101%103%105%107%Operating Income (20%)105%105%110%120%Free Cash Flow (20%)102%110%115%120%OI Margin (20%)107%111%118%120%Key Performance Indicator Metric (20%)100%105%108%110%% to TargetBonus Score**127.2%Corporate Level Earned Award: Spectra Energy Corp. (SE)DEF 14A filed on March 21, 2013“The amounts set forth below show the target amounts for achieving the threshold, target and maximumlevels established for each financial goal as well as the actual result. For each category, achievement of thethreshold, target and maximum amounts would result in the payment of 50%, 100% and 200%, respectively,of the target level. For instance, the short-term incentive payment for an executive associated with our SpectraEnergy Transmission EBIT results was calculated as 25% of such executive’s target cash incentive opportunitymultiplied by the actual percentage achieved, which was 101.99%. Actual Spectra Energy Ongoing EPS for 2012was 1.43 which was below the 1.70 threshold primarily as a result of lower than expected commodity prices,resulting in no payment for EPS results.2012 Target STI Payment MeasuresMeasuresPercentageSpectra Energy Ongoing EPS101%Spectra Energy Transmission EBIT105%Spectra Energy Transmission ROCE102%Environmental, Health and Safety Scorecard107%Operational and Capital Project Scorecard100%The Environmental, Health and Safety Scorecard achieved a payout percentage of 133.20% and the Operationaland Capital Project Scorecard achieved a payout percentage of 115.30%.”In addition to performance targets, this company also provides the threshold and maximum values for eachmetric. Then, the final payout percentages are determined by directly comparing each metric’s target levels toactual performance results. Note that this company’s plan has a combination of both measurable financial goalsPerformance Metrics in Annual Incentive Plans 9
and qualitative, non-financial goals.DiscretionaryMeasuresSpectra Energy Ongoing EPSSpectra Energy Transmission EBIT(in millions)Spectra Energy Transmission ROCEPercentageThresholdTargetMaximumActual 1.70 1.90 2.20 1.430% 1,762 1,834 1,975 1,836.8101.99%10.2%10.6%11.4%10.7%112.50%Achieved Franklin Resources (BEN)DEF 14A filed on January 23, 2014“Accordingly, early in the fiscal year, the Compensation Committee established a maximum bonus pool underthe KEIP funded in an amount equal to 1.25% of PBOI for the year, approved the participation of Mr. G. Johnsonand granted him a maximum target award under the KEIP equal to 40% of the pool. Although the Committee’sdecisions are not dictated by a specific formula, the profitability of the firm, as reflected in PBOI, is thedetermining performance-based measure in establishing award maximums for Mr. G. Johnson and the othernamed executive officers.[ ]The Committee believes that this bonus structure is in the best interests of stockholders because it enables themost prudent use of Company assets by maximizing the deductibility of performance-based compensationwhile empowering the Committee to pay only those amounts it determines are necessary to appropriatelycompensate executives.”This company utilizes an annual incentive plan in which the company’s operating income levels limit themaximum amount that the CEO can earn. Although the company does not have a specific set of metrics withdistributed weightings, its bonus plan structure still ties the bonus payouts to overall company performance.Payout adjustment MeadWestvaco Corp. (MWV)DEF 14A filed on March 20, 2013“While the weighted payout based on actual 2012 company performance against these goals exceeded targetperformance and reached the 128% performance level, it was management’s recommendation, with which theCommittee concurred, to adjust payouts to the 110% of target performance level.” MeadWestvaco Corp. (MWV)DEF 14A filed on March 21, 2012“While the weighted payout based on actual 2011 company performance against these goals exceeded targetperformance and reached the 183% performance level, it was management’s recommendation, with whichthe Committee concurred, to adjust payouts to the 155% of target performance level (subject to adjustment forPerformance Metrics in Annual Incentive Plans 10
individual executive performance).”In both fiscal years 2012 and 2011, this company’s management team recommended lowering the final payoutpercentage, even though the company performance resulted in a higher percentage bonus payout, accordingto the formula. The proxy goes on to say that the committee overseeing payouts agreed to implement themanagement team’s suggestion and that an adjustment to the final payout percentage was made beforeindividual performance was taken into account.For more information, please contact Aaron Boyd at aboyd@equilar.com. Aaron Boyd is the Director ofGovernance Research at Equilar. The contributing authors of this article are Chelsea Park, Senior ResearchAnalyst, and Aubrianna Zhu, Research Analyst.Performance Metrics in Annual Incentive Plans 11
Related Content LinksReports2014 Realizable Pay 1012014 Compensation andGovernance OutlookInnovations in CD&ADesign: A ProxyDisclosure AnalysisSay on Pay Peer GroupTurnaround ChangesInputs Matter—AComparison of DiversePeer Group and PayModels2014 S&P 1500 PeerGroup ReportArticlesAdvances inCD&A DesignVideosBehind The Numbers Say on PayClawbacks 101Ownership Guidelines 101Performance Metrics in Annual Incentive Plans 12
www.equilar.com
Equilar, Inc. 1100 Marshall Street Redwood City, CA 94063 Phone: (650) 241-6600 Fax: (650) 701-