Transcription
Value and Valuation: MakingSense of Long-Term Incentive DataTerry Adamson, CEPFred Whittlesey, CEP, CCP, CECP
Presentation Outline This is Important if Statement of the ProblemHistory of LTI ValuationAccounting Fair ValueSurvey ValuesProxy Statement ValuesProxy Advisory Firm ValuesRe-Emerging MethodologiesEmerging Effects on ValueYour Next Steps
This is Important if You reference survey data and/or proxy data in yourcompensation analyses, and Your compensation market data includes LTI data, and Your company grants LTI to the positions you areanalyzing, or Your company does not grant LTI to the positions you areanalyzing, or A proxy adviser or institutional shareholder hasquestioned your executive or equity compensationprogram (in the say-on-pay process), or Your CEO is the subject of unfavorable headlines forbeing “overpaid”
Statement of the Problem Long-term incentive compensation represents asmall to significant portion of total compensationdepending on Position Industry Location Form of organization Company pay philosophyUnlike cash compensation, LTI values are subject toa wide variety of conflicting methodologies
Statement of the Problem Accountants and the SEC have a unified approach to LTIvaluation These are increasingly being challenged as “pay value”Corporate compensation practitioners use LTI marketdata represented in a wide range of value Data is often combined/averaged like base salary and totalcash compensation data Various forms of LTI are, in turn, combined into dollardenominated valuesCorporate governance advocates assess LTI value as anelement of their analyses Each has its their valuation method
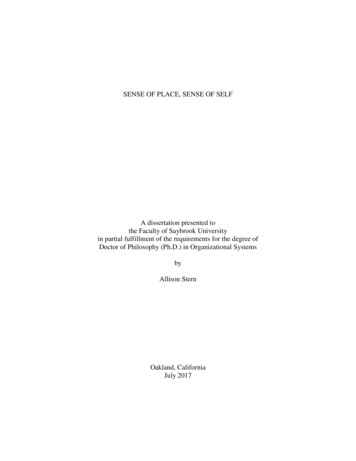
Survey Valuation MethodologiesMethod of Calculating Pay Value of Equity rmOptionsStock/UnitsSharesLTIFirm ABlack-Scholes value100% of FMVFair valueExcluded100% of FMV100% of FMV at targetExcludedProprietary calculationFirm BBlack-Scholes valueindividual company valueFirm C1-Black-scholes2-Binomial3-NPV*Growth 10%*Discount rate 4.5%*Period 5100% of FMV100% of FMV at targetExcludedFirm DNPV 45% of FMV*Growth 10%*Discount rate 6%*Period 5NPV 75% of FMV*Growth 0%Discount rate 6%Period 5Target less a discount:2-year period 85%3-year period 80%4-year period 75%5-year period 70%Target less a discount:2-year period 85%3-year period 80%4-year period 75%5-year period 70%Firm ERisk-Adjusted PV*Growth 12%*Discount rate 12%*Period 5100% of FMVplus option value1-Target value2-Fair valueIncludedFirm FRisk-Adjusted PV*Growth 12%*Discount rate Rf*Period 3PV of RAPVplus option value*Growth 12%*Discount rate Rf*Period 31-Target value1-Target value
A Brief History of Valuation 1980s Grant Value Grant Value Multiple Allowed LTI-to-LTI comparisons (if all options) Allowed crude pay mix comparisons No “total compensation” calculation possible Note: At that time, SEC disclosure rules did notrequire a total compensation figure
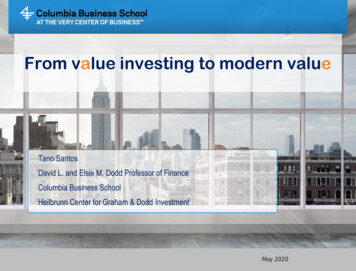
Grant ValueStock Options(a)Base Salary(b)FMV on Grant Date(c)(c1)(c2)(c3)Number of shares- Minimum- Target- Maximum(d)Strike price(e)Grant Value(f)Grant Value MultipleRestricted StockPerformance Shares 250,000 15.0012,00012,0006,00012,00018,000 15.00(c) * (d)(c) * (b)(c2) * (b)(e) / (a)n/an/a 180,000 180,000 180,0000.72
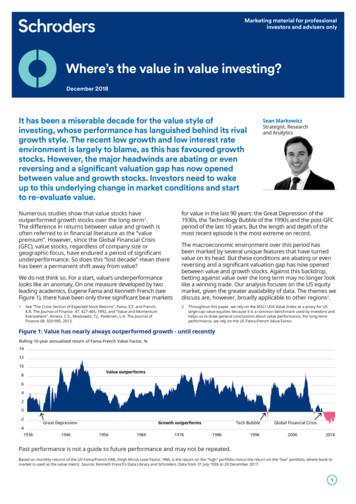
A Brief History of Valuation (continued) 1990s Gain Value Allows for comparison and addition to cashcompensationDriven by 3 controversial assumptions Growth rate Discount rate Time periodProxy statement table 5% and 10% growth rate
Gain ValueGrant PriceStock OptionEnd PriceValue 15.00 30.17 11.89Restricted Stock 15.00 30.17 23.64Performance Shares 15.00 30.17 23.64AssumptionsGrowth RateDiscount RateYearsPerformance vs. Target 15.00FMV15%5%5100%Grant PriceStock OptionEnd PriceValue 15.00 30.17 7.54Restricted Stock 15.00 30.17 15.00Performance Shares 15.00 30.17 15.00AssumptionsGrowth RateDiscount RateYearsPerformance vs. Target 0.00FMV15%15%5100%
A Brief History of Valuation (continued) 1990s FAS123: Optional accounting fair value (footnoterequired) endorsing (without naming) BlackScholes and driven by: VolatilityExpected Life (not full term)Risk-free Interest RateDividend YieldAny discount/premium from fair market valuefor strike price
Black-Scholes ValueMARKET PRICE AT DATE OF GRANTFUTURE DIVIDEND YIELD (3% 0.03)STRIKE PRICEVOLATILITYRISK-FREE RATE (8% 0.08)TERM (IN YEARS) 40.002.20% 40.000.4501.75%4.5VALUE OF OPTION 13.03 13.03
A Brief History of Valuation (continued) Proxy Statement – Summary Compensation Table Pre-1993: Total cash compensation, number of stockoptions 1993: value of RS and PS but # of options 2004: values of all forms of LTI (except cash) 2007: Grant date fair value and “total comp” plus cashLTI in NEIP Fair value accrued in that year for all years’ grants2010: Back to grant date fair value
A Brief History of Valuation (continued) The Past Decade ISS Burn Rate table 1995: FAS123 Option pricing model endorsed by FASB 1997: Share Value Transfer method released 2004: FAS123R Binomial model endorsed as preferred method2005: SAB107 adds some shortcuts Expected Life (T V)/2
Topic 718 RequirementsValuation – Traditional Models Illustration comparing closed-form Black-Scholes model with atraditional binomial model (present value of future cash flows)Traditional Binomial S5,331.250%S5,415.625%S5,53.125%S4,0 σ t ()SXrδln/ 2 d1 σ t2 ,3S4,4* Simplification such that there is an equal probability of downward and upward movements. This is generally not the case as theprobability of upward and downward movements are governed by the volatility, the dividend yield, and the discount rate.
Topic 718 RequirementsValuation – Monte Carlo Simulation Principles of Monte Carlosimulation are akin to The Price IsRight game Plinko Future stock prices are randomlysimulated up or down at each timeperiod Plinko right or left at each peg Ending price used to determinewhether award vests and the value ofthat award Process is repeated to ensure a widedistribution of results Fair Value Vesting Percentage x Simulated Price x Present Value- Simple average of all simulation results
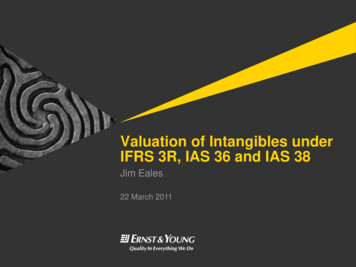
ISS Valuation vs. AccountingAdobe Systems DEF14A 3/1/2012
WorldatWork’s Model Initiated comment in 2009 with goal of a standardizedvaluation method to be used by all Cover story in April 2011 Workspan - great deal of interestby practitioners and several large survey firms At the end of 2011, several firms were attempting toimplement the WorldatWork/GEO standard LTI model intheir data collection systems for 2012, but they failed tomeet their own deadlinesWorldatWork anticipates that at least one or two firms willagain attempt to include a standard LTI model for 2013 Association is actively encouraging further discussion,toward a standard LTI valuation model that be in addition to(not replace) other models
Re-emerging Methodologies Intrinsic value Realized value What the award is actually worth but when?What the award was worth when exercised (options),vested (RS and PS), or paid (cash LTI)Realizable value What the award would be worth (right now) if fullypaid out Captures intrinsic value Eliminates bias of unexercised options
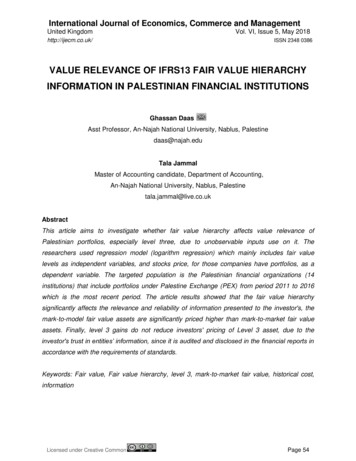
Intrinsic Value: Proxy Statement TableCitigroup DEF14A 3/8/2012Equity Value TableNameVikram PanditJohn GerspachJohn HavensBrian LeachManuelMedinaMoraYearValue of Stock AwardsShown in SummaryCompensation TableValue of Option AwardsShown in SummaryCompensation TableCombined EquityAward Value atDecember 30,2011Difference betweenCombined EquityValue and Stockand Option AwardValues 2011201020092011 ,327,3745,400,000 7,839,581002,039,836002,719,7810434,3802,039,836 432,8052,830,159 09 3,998,9397,450,9119,328,010 2,719,7810361,984 2,191,9184,893,7796,911,154 (4,526,802)(2,557,132)(2,778,840)
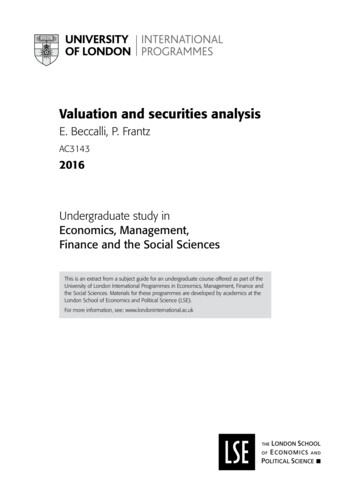
Intrinsic Value: Proxy Statement ChartCEO Equity GrantsGrant Date Fair Value vs. Intrinsic Value as of 12/31/2011
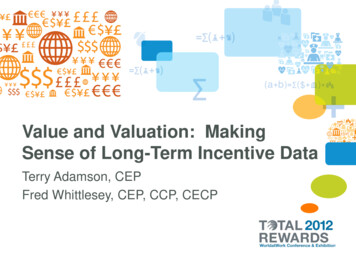
Realizable Pay: Supplemental Filing
Emerging Effects on Value Performance features Stock ownership guidelines Introduced in reaction to RSUs PSUsExtended to stock optionsIntroduced in early 1990sEmbedded in proxy advisory voting guidelinesClawbacks Introduced in Sarbanes-OxleyEnhanced in TARPExtended in Dodd-Frank – awaiting SEC rules
How Do These Affect Value? Performance features Typically viewed as a discount by participants Reported at target in GPBA (with a footnote for max) Often create an accounting expense greater than targetStock ownership guidelines Typically viewed as a discount by participants No models consider in LTI value Often moot due to one-time RSU grants accompanying new guidelines Which are often excluded from proxy and survey values!Clawbacks Typically viewed as a discount by participants Unquantifiable due to uncertain circumstances and timing
Emerging Effects – Relative TSR Sample fair value result based on the following:-3-year performance period-Assumes 20 current price, 3% risk-free rate, and no dividend yield-Payout based on percentile rank Summary of simulation results Note that this result is 115% of face!
Emerging Effects – Absolute TSR3-year performance period; RSU vests if the stock price exceeds the Stock PriceHurdle Assumes 20 current price, 3% risk-free rate, and no dividend yieldVolatility 30%40%50%60% 20 13.35 (-33%) 13.66 (-32%) 14.09 (-30%) 14.56 (-27%)Stock Price Hurdle 30 40 7.28 (-64%) 3.68 (-82%) 9.13 (-54%) 6.00 (-70%) 10.55 (-47%) 7.92 (-60%) 11.71 (-41%) 9.52 (-52%) 50 1.83 (-91%) 3.97 (-80%) 6.02 (-70%) 7.83 (-61%) But what about Market Stock Units? Those are Absolute Performance Shares Expect Market Stock Units to be approximately 120% of face, depending on terms
Emerging Effects – Truncated Terms and Caps Shorter Contractual Terms of 7 Years or less became popular in 2006Volatililty30%40%50%60%70%80% 10 Years33.0%41.4%49.2%56.5%63.2%69.2%7 Years / Reduction-14.0%-13.1%-12.4%-11.7%-11.0%-10.2%Look for Capped Options to come next Volatility30%40%50%60%70%80%Discount Achieved at Various Cap .01%-20.34%-25.71%-35.51%-53.66%
Emerging Effects - Clawbacks ASC Topic 718 does not allow for a reduction for claw-backs IFRS 2 requires a reduction in the valuation of Claw-backs Companiesare only going to reduce the fair value of equity for the probabilityof violating non-compete or non-solicit provisions, not for misconduct Simplistic Example: Requires assumptions about termination, the probability ofcompetition, and the length of the non-compete provision. The example belowreflects a 1-year non-competeTermination RateProbability of 5%-11.3%-15.0%20.00%-5.0%-10.0%-15.0%-20.0% Discount 1 – (Termination Rate)*(Probability of Competing) Longer non-competes would get greater reductions in fair value
What To Do? Confirm your current internal methodologies Stock options and SARs Time-vested stock grants (e.g., RSUs) Performance-vested stock grants (e.g., PSUs) Multi-year Non-equity Incentive awards (e.g., Cash LTI) Confirm your survey and consultant methodologies Reverse engineer and normalize valuesNote how vastly different this new analysis is from anythingyou’ve done before! Compared to proxy tables Compared to consultant’s analyses
Then Determine your Compensation Committee consultant’smethodologiesResearch your Compensation Committee members’other Board memberships, and repeatEducate your CEO/CFO/GC/VPHRProvide empirical and analytical support for yourexecutives’ trip to the Compensation CommitteeDevelop a position on LTI competitiveness, and theimpact on total compensationManage those numbers behind-the-scenes to beinstantly prepared for a say-on-pay challenge, lawsuit,stock price crash, employee whining, etc.
Contact InformationFred Whittlesey, CEPPrincipal p.comwww.compensationventuregroup.comBlog: payandperformance.blogspot.comTerry Adamson, CEPPartnerAon Hewitt Consultingtadamson@radford.com215.255.180231
Base Salary 250,000 (b) FMV on Grant Date 15.00 (c) Number of shares 12,000 12,000 (c1) - Minimum 6,000 (c2) - Target 12,000 (c3) - Maximum 18,000 (d) Strike price 15.00 n/a n/a (e) Grant Value (c) * (d) 180,000 (c) * (b) 180,000 (c2) * (b) 180,000 (f) Grant Value Multiple (e) / (a) 0.72