Transcription
RenkoBar IndicatorMetaTrader Master Edition
Table of contents1.Overview32.Using the Renko indicator42.1Adding the indicator to a chart42.22.2.12.2.2NotesM1 dataMultiple Renko blocks per chart .82.3.9Indicator settingsRenko block sizeColoursContinuousLinesOn top of chartAlertsRounding the starting priceMaximum number of blocksBase period for Renko data55566666672.42.4.12.4.22.4.32.4.42.4.5Offline chartsIdentifier for the offline chartContinuous updates of the offline chartMissing blocks in the offline chartRenko tailsDeleting old offline charts8991010102.5TSV/CSV log file112.6Setting the start time for the Renko blocks112.7Warning: using Renko data in MT4 backtesting12
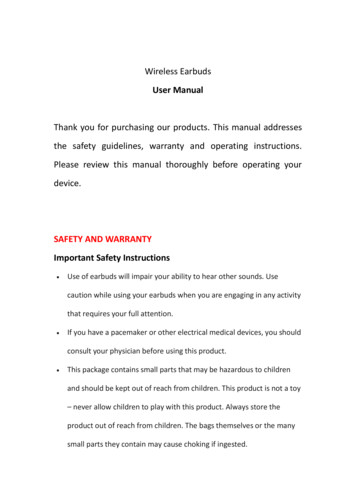
1. OverviewThe Renko bar indicator draws Renko blocks on a normal MT4 time-based chart.The blocks can either be drawn as continuous, or as separated elements whenevera new Renko block is completed. (The blocks have varying widths, or gaps betweenthem, because Renko bars are not time-based and have varying durations).The indicator can also be used to create an offline MT4 chart containing onlythe Renko blocks – a more traditional Renko chart which is not time-based like anormal MT4 chart: Swissquote Bank Ltd MetaTrader Master Edition Renko Bar Indicator3 Contents
2. Using the Renko indicator2.1 Adding the indicator to a chartYou add the Renko indicator to a chart in the usual MT4 way, either by draggingit from the Navigator onto a chart, or by double-clicking on it in the Navigator.You can also use standard MT4 features such as adding the indicator to your list ofFavorites, or assigning a Hotkey to it.Some options in the indicator need the “Allow DLL imports” setting to be turnedon, in the “Common” tab of the indicator settings:2.2 Notes2.2.1 M1 dataThe indicator calculates the Renko blocks from M1 data, regardless of thetimeframe of the chart on which you use the indicator. Therefore, you need asmuch M1 data in your MT4 platform as possible, and you may need to useTools / History Center in MT4 to download extra M1 data.If you only have 5 days of historic M1 data, then Renko bars will only be drawn forthe last 5 days even if you are looking at e.g. an H1 chart which goes back muchfurther. Swissquote Bank Ltd MetaTrader Master Edition Renko Bar Indicator4 Contents
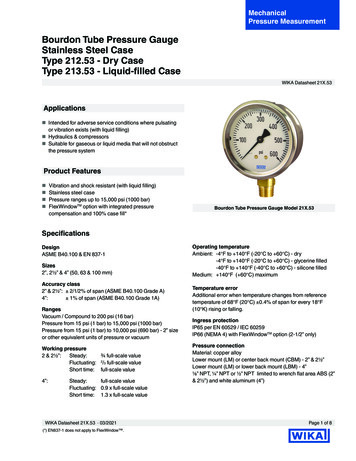
2.2.2 Multiple Renko blocks per chart candleDuring each time-based candle on the MT4 chart, e.g. an H1 candle, there can beanything between zero and many new Renko blocks.In the following example the chart timeframe is very long (H4) and the Renkoblock size is very small (5 pips). As a result, there are lots of Renko bars during eachchart candle, creating many red and blue Renko blocks which are overlaid.A chart such as this is unreadable because the H4 timeframe simply is not suitablefor looking at a Renko block size as small as 5 pips. You should use a lower charttimeframe for such a Renko size.2.3 Indicator settings2.3.1 Renko block sizeYou set the Renko block size as a number of pips, e.g. 20, rather than a priceamount such as 0.0020.The indicator will automatically calculate a pip size based on the number of digitsin the instrument’s price. For example, if prices are quoted to 1DP, e.g. 2048.7,then the indicator will use a pip size of 0.1, and a setting of e.g. 20 pips wouldmean a price change of 2.0.On some non-forex symbols such as equity indexes, you may want to change thepip size. For example, prices may be quoted to 2DP such as 13456.00, but youmay want to use a pip size of 1.00 instead of the default 0.01. The indicator has anadditional setting which lets you specify your own pip size.2.3.2 ColoursYou can set the colours for the up and down Renko blocks on the chart. Thesecolours are also used for the optional lines which show where a new Renko blockwill start. Swissquote Bank Ltd MetaTrader Master Edition Renko Bar Indicator5 Contents
2.3.3 ContinuousA Renko block obviously has variable duration in time. When drawn on top of atime-based chart such as a normal MT4 price chart, the Renko blocks will thereforehave varying widths.You can choose either to draw the Renko blocks as continuous bars, or only toshow separate blocks at the point that each new Renko bar is formed. Examples ofthese options are shown above.2.3.4 LinesBy default the indicator displays lines which show the prices at which a new Renkoup or down block will start. You can change the style of these lines, e.g. fromdashed to solid, or you can turn the lines off completely.2.3.5 On top of chartYou can choose to draw the Renko blocks as semi-transparent rectangles on top ofthe price bars, instead of in the background.2.3.6 AlertsYou can turn on pop-up alerts in MT4 which tell you whenever a new Renko blockhas been formed.2.3.7 Rounding the starting priceBy default the start and end prices for each block will be set so that they are amultiple of the block size. For example, if the block size is 10 pips (0.0010) thenthe prices at which blocks start and end will always be a multiple of this, e.g.1.2340, 1.2350, 1.3890, 2.2670 etc.You can turn off this rounding, and instead base the start and end of the Renkoblocks on the first price in the M1 history. For example, if the opening price of theM1 data is 1.23743 and the block is 0.0010 (10 pips) then the start and end pricesof all the Renko blocks will be x.xxx43, e.g. 1.23843, 1.23943, 2.41543 etc2.3.8 Maximum number of blocksYou can limit the maximum number of blocks which the indicator will draw on thechart. This can help to save memory on low-powered computers. (Please note thatthis setting does not affect how much data is created in an offline chart.) Swissquote Bank Ltd MetaTrader Master Edition Renko Bar Indicator6 Contents
2.3.9 Base period for Renko dataAs explained above, the indicator builds the historic Renko data from M1 prices inthe MT4 platform. This is, in fact, configurable: you can choose to use a differentbase period such as M5.The advantage of a higher time period such as M5 or M30 is that the historic datamay go back further in time than M1, and it may be possible for the indicator todraw more historic Renko blocks.The disadvantage is that the Renko blocks will be less accurate during periods ofhigh volatility. For example: Renko block size is 10 pips (0.0010) A single historic bar covers several Renko blocks, e.g. low price was 1.2056 andhigh was 1.2128 The range inside this bar was 0.0072, and therefore there were 7 Renko blockswhich were formed during this single price candle in the MT4 history data. (Infact, there could have been many more than 7 if the price bounced up and downduring the bar.) However, the indicator can only see the historic high and low, and it is impossiblefor the indicator to know in what order the blocks were formed Therefore, under circumstances such as this, the indicator has to guess andsimplify the Renko block history. (It is possible for this to happen even on M1data, but using higher timeframes makes the problem more frequent.) Swissquote Bank Ltd MetaTrader Master Edition Renko Bar Indicator7 Contents
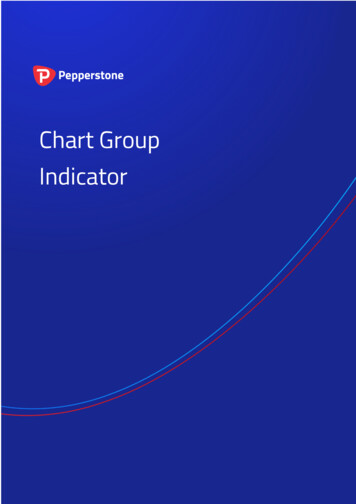
2.4 Offline chartsIn addition to drawing the Renko blocks on a normal MT4 time-based chart, theindicator can also be used to generate an offline MT4 chart showing only theRenko blocks. This creates a more traditional Renko chart which is not time-basedlike a standard MT4 chart:“Offline”, in MT4 terminology, means that the price data for the chart is not beingprovided directly from the broker’s server. The offline chart will neverthelesscontinue to update for as long as the indicator is running, and you should be ableto use most EAs and indicators on such an offline chart. Swissquote Bank Ltd MetaTrader Master Edition Renko Bar Indicator8 Contents
2.4.1 Identifier for the offline chartYou tell the indicator to create an offline chart by entering any non-zero numberof your choice, e.g. 1234 or 7777. The only restriction is that you cannot use anumber which corresponds to the minutes in a normal MT4 chart (1, 5, 15, 15, 30,60, 240, 1440, 10080, 43200).You can then view the offline chart by using File / Open Offline in MT4, andselecting the special chart which the indicator has created, e.g. “EURUSD,M1234”The offline chart continues to update with new prices and blocks for as long as theRenko indicator is running on the main price chart. If you close the normal MT4chart which has the Renko indicator on it, then the offline chart will stop updating.2.4.2 Continuous updates of the offline chartBy default the indicator will continuously update the offline chart, drawing thecurrent price and an “in-progress” bar since the last Renko block, and updating theoffline chart with all new completed Renko blocks.Please note that these updates require the “Allow DLL imports” setting to beturned on.You can also turn off these continuous updates. If so, the offline chart will only beupdated when each new Renko block completes, and you will need to do a manualrefresh of the chart to see the changes. Swissquote Bank Ltd MetaTrader Master Edition Renko Bar Indicator9 Contents
2.4.3 Missing blocks in the offline chartMT4 charts cannot display more than one candle per minute. If the market wasvery volatile and/or your block size is very small, then there can be multiple Renkoblocks per minute and the offline chart will only be able to show one of them.In the following example there is a gap – a missing down block – because therewere two Renko blocks within the same minute, and MT4 can only display one ofthem:(You can use the TSV/CSV log to check the actual history if MT4 is unable torepresent it in full.)2.4.4 Renko tailsYou can choose to include “tails” in the Renko blocks on the offline chart. Theseshow the movement in the opposite direction while a Renko block was forming,and can help to indicate the strength of a move and the likelihood of a reveral:2.4.5 Deleting old offline chartsWhen you no longer need an offline chart, you can delete it by using File / OpenData Folder in MT4, going to the history\ broker-server directory, and deletingthe file such as EURUSD1234.hst. Swissquote Bank Ltd MetaTrader Master Edition Renko Bar Indicator10 Contents
2.5 TSV/CSV log fileYou can tell the indicator to write a log of the Renko history in CSV or TSV format.You enter a filename, such as “audusd.tsv”, and the file is created in the MQL4\Filesarea. You can then open it using File / Open Data Folder in MT4, and going to theMQL4\Files subdirectory.Please note: if you open the TSV/CSV file in an application such as Microsoft Excel,the indicator cannot continue to update it while it is open in Excel. It is best to takea copy of the file, and then open that copy in Excel.2.6 Setting the start time for the Renko blocksYou can set a start time for the Renko blocks by drawing a vertical line on thechart, and using the object properties to set the name of the line to “RenkoStart”:The indicator will not draw any Renko blocks before this line. The start time alsoaffects the history which is written to any offline chart or TSV/CSV log file. Swissquote Bank Ltd MetaTrader Master Edition Renko Bar Indicator11 Contents
2.7 Warning: using Renko data in MT4 backtestingUsing various third-party tools, it is possible to feed custom price data into theMT4 strategy tester. For example, you can take an offline chart (the .hst file)created by the Renko indicator and use that in MT4 backtesting. Using Renko dataas the input for backtesting is quite popular in the MT4 community.However, you should not do this. You will get unrealistic, very favourable results.It is possible to write an EA which places 100% winning trades when backtestedon Renko data rather than normal price data (because the presence or absence of agap between the current bar-open price and the last bar-close price tells you whichdirection the price is about to move in).More generally, EA results will tend to be unrealistic even if the EA is notdeliberately trying to exploit the price clues in the Renko data. For example,measures of volatility will increase when a Renko reversal is happening (because ofthe gap between last-close and current-open), and an EA which uses volatility asone of its strategies will in effect be looking at a characteristic of the Renko datarather than real price information which it would have had historically in real life.The content of this guide is purely informative and does not constitute an offer or a recommendation to trade a specific product and is not to be understood as apiece of advice of any sort, in particular regarding trading, tax and legal questions. The information or opinion regarding a product expressed in this guide do not takeinto consideration the investment objectives, the assets, the experience or the knowledge of a single investor. Swissquote Bank Ltd and its employees shall in no eventbe liable for damages or losses arising directly or indirectly from decisions made on the basis of the content of this guide. The content of this guide was producedby Swissquote Bank Ltd as per the current date and may be subject to change without prior notification. Although the content of this guide has been obtained fromand is based upon sources that Swissquote Bank Ltd believes to be reliable, Swissquote Bank Ltd assumes no responsibility for the quality, correctness, timelinessor completeness of the content of this guide. This guide may not be reproduced in part or full without the written prior consent of Swissquote Bank Ltd. Forextransactions are highly speculative, involve an extreme degree of risk and are generally suitable only for persons who can assume and sustain a risk of loss in excessof their Forex margin. Forex transactions may, by their nature, generate losses that are in theory unlimited. In the absence of prior intervention, the loss could greatlyexceed all the client’s assets deposited with the Swissquote Bank Ltd. Swissquote Bank Ltd MetaTrader Master Edition Renko Bar Indicator12 Contents
www.swissquote.comGeneva - Zurich - Bern - London - Dubai - Malta - Hong Kong
The range inside this bar was 0.0072, and therefore there were 7 Renko blocks which were formed during this single price candle in the MT4 history data. (In fact, there could have been many more than 7 if the price bounced up and down during the bar.) However, the indicator can