Transcription
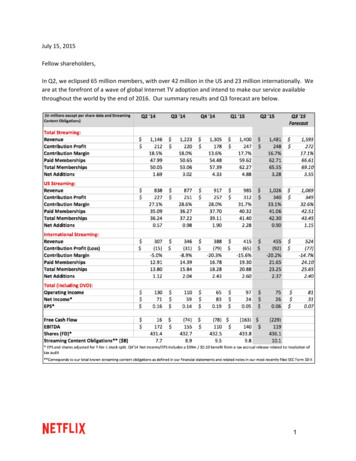
July 15, 2015Fellow shareholders,In Q2, we eclipsed 65 million members, with over 42 million in the US and 23 million internationally. Weare at the forefront of a wave of global Internet TV adoption and intend to make our service availablethroughout the world by the end of 2016. Our summary results and Q3 forecast are below.1
Q2 Results and Q3 ForecastWe added a Q2 record 3.3 million new streaming members, compared to 1.7 million in the previous yearquarter. As a reminder, the quarterly guidance we provide is our actual internal forecast at the time wereport and we clearly under-forecast in Q2 (forecast was 2.5 million net adds). We strive for accuracy inthe forecast and our Q3 estimates are based on everything we know up to today.We gained 0.9 million members in the US and added 2.4 million members internationally in Q2. Webelieve the higher than anticipated level of acquisition was fueled by the growing strength of ouroriginal programming slate, which in Q2 included the first seasons of Marvel’s Daredevil , Sense8,Dragons: Race to the Edge and Grace and Frankie as well as season 3 of Orange is the New Black. USrevenue growth was also driven by a 5% year over year increase in ASP due to uptake in our HD2-stream plan. We continue to target a 40% US contribution margin by 2020, even though we arerunning ahead of plan given stronger than expected top line performance and lower content and otherstreaming costs. We are forecasting Q3 US net adds of 1.15 million, slightly higher than the year agoperiod.Our international segment is growing at a rapid pace. We did not add additional markets in Q2 but sawcontinued improvement across existing markets, including a full quarter of additions from our successfulMarch 24, 2015 launch in Australia/New Zealand. We project Q3 international net adds of 2.4 million.International revenue grew 48% year over year, despite an - 83 million impact from currency ( 5% ASPgrowth x-F/X). As we expected, international losses increased sequentially with a full quarter ofoperating costs in AU/NZ. We expect this trend to continue in the second half as we launch additionalmarkets (Japan in Q3 and Spain, Italy and Portugal in Q4) and prepare for further global expansion in2016, including China as we continue to explore options there.EPS for Q2 amounted to 0.06 after adjustment for our 7-for-1 stock split (EPS would have been 0.42using pre-split share count). We remain committed to running around break-even globally on a netincome basis through 2016, and to then deliver material global profits in 2017 and beyond.ContentWe are making great progress shifting to exclusive content and expanding our original content, whichdifferentiates our service, drives enjoyment for existing members and helps motivate consumers to joinNetflix.In Q2, we launched our largest number to date of high profile Netflix original series. On April 10,Marvel’s Daredevil debuted to strong audience engagement, particularly for a new show. Grace andFrankie, the bittersweet comedy starring Lily Tomlin and Jane Fonda which launched on May 8, also hasfound a broad and appreciative audience around the world. Both series have already begun their secondseason of production.2
Our global expansion extends to our content strategy as well. Sense8, the mind-bending cinematicthriller from the Wachowski siblings and J. Michael Straczynski that debuted June 5, is an ambitious,truly international show with talent behind and in front of the camera from multiple countries.Similarly, on August 7, we will launch in all territories our first non-English language original, Club deCuervos, a family comedy set in the world of futbol from Mexican filmmaker Gaz Alazraki, and on August28, Narcos , a gripping account of the roots of the cocaine trade, shot in Colombia and starring the greatBrazilian star Wagner Moura as Pablo Escobar.The original documentary Chef’s Table and our latest DreamWorks Animation series Dragons: Race tothe Edge are among our most viewed new originals to date. They are the perfect example of what westrive for in our original programming; an elevated version of popular genres that reach a large audienceglobally.We closed the quarter with season 3 of Orange is the New Black, which went live on June 11 and set offa social media shockwave around the world. On the following Sunday, Netflix members globally watcheda record number of hours in a single day, led by Orange, despite the season finale of HBO’s Game ofThrones and game five of the NBA finals also falling on that Sunday. Global enthusiasm for the thirdseason of Orange underlines our ability to create franchise properties that bring new members to Netflixas well as delighting current ones. Nearly ninety percent of Netflix members have engaged with Netflixoriginal content, another indicator that we are on the right path.We anticipate that as our global content spend approaches 5 billion in 2016 on a P&L basis (over 6billion cash), we will devote more investment to originals both in absolute dollars and percentage terms.This includes not only series, documentaries and stand-up but also original feature films.We are moving into the original film business in order to have new, high-quality movies that our globalmembers can find only on Netflix. As with series, we’ve chosen to take a portfolio approach covering awide variety of genres and based around creators with great track records and stories they arepassionate about. The first of our films, Beasts of No Nation, a gripping war drama from theaward-winning director Cary Fukunaga ( True Detective) and starring award-winning Idris Elba (Mandela,Luther, The Wire) will be available to all Netflix members and in select theaters in October. In June, weannounced War Machine, a provocative satirical comedy starring Brad Pitt, which will be exclusivelyavailable to Netflix members and in select theaters next year. The release schedule for our slate oforiginal films can be found here .ProductIn June, we unveiled the new Netflix website, our first major update in over four years. The newexperience has been built from the ground up to make it faster and easier for our members to discovergreat content to watch. The UI is a richer and more visual experience with improved title art and abetter details view. It also works more like an app and less like a series of linked web pages. Earlyfeedback has been positive from both members and the media, and retention should benefit.3
In support of expanding our service globally, we are focused on adding more languages, optimizing ourpersonalization algorithms for a global library in local markets, and expanding support for a range ofdevice, operator and payment partnerships. We are also placing a greater emphasis on optimizing formobile, which is the main means for Internet access in many emerging markets where we will beexpanding in the future.Strong Net NeutralityCharter Communications made net neutrality history today by committing to open and freeinterconnection across the Charter/TWC network, if their pending merger is approved. This moveensures that all online video providers can aggressively compete for consumers' favor, without selectiveand increasing fees paid to ISPs. Charter's interconnection policy is the right way to scale the Internet. Itmeans consumer will receive the fast connection speeds they expect. The Charter/TWC transaction,with this condition, would deliver significant public interest benefits to broadband consumers, and weurge its timely approval.CompetitionWe compete with linear TV, PPV, video piracy, other Internet networks, video gaming and many othersources of entertainment. The recent Sandvine results from North America show that, looking at just theInternet networks segment, we continue to improve faster than others. Note that this data measurespeak megabits, not peak viewing hours, so YouTube, for example, with more modest average videoquality, is underrepresented in terms of hours.4
DVDOur DVD-by-mail business in the US continues to serve 5.3 million members and provided 77.9 millionin contribution profit in Q2. The broad selection of titles, including new release movies and TV shows,remains appealing to a core user base and means that the tail on this business should be quite long.Free Cash Flow & CapitalFree cash flow in Q2 amounted to - 229 million, compared with - 163 million in Q1. As we havepreviously detailed, our investment in originals is working capital intensive, which results in higher cashspent upfront relative to content amortization, and, we anticipate this trend to continue given ourincreased investment in originals. At the end of Q2, gross debt totaled 2.4 billion, which represented4.6x LTM EBITDA and we ended the quarter with 2.8 billion in cash & equivalents and short terminvestments.ReferenceFor quick reference, our eight most recent investor letters are: April 2015 , January 2015 , October 2014 ,July 2014 , April 2014 , January 2014 , October 2013 , July 2013 .SummaryWe’re pleased to see the growing momentum of our original programming driving strong growth in theUS and abroad. With our first set of international markets having achieved contribution profitability,we’ll be making our first foray into Asia this Fall with our Japan launch, and are gearing up to offer ourservice around the globe.Sincerely,Reed Hastings, CEODavid Wells, CFO5
July 15th, 2015 Earnings InterviewReed Hastings, David Wells and Ted Sarandos will participate in a live video interview today at 1:30 p.m.Pacific Time at youtube.com/netflixir . The discussion will be moderated by Mark Mahaney, RBC CapitalMarkets and Rich Greenfield, BTIG Research. Questions that investors would like to see asked should besent to mark.mahaney@rbccm.com or michael@moffettnathanson.com.IR Contact:Spencer WangVice President, Finance & Investor Relations408 540-3700PR Contact:Jonathan FriedlandChief Communications Officer310 734-2958Use of Non-GAAP MeasuresThis shareholder letter and its attachments include reference to the non-GAAP financial measures of netincome on a pro forma basis excluding the r elease of tax reserves , free cash flow and EBITDA.Management believes that the non-GAAP measures of net income on a pro forma basis excluding therelease of tax reserves provides useful information as these measures exclude effects that are notindicative of our core operating results. Management believes that free cash flow and EBITDA areimportant liquidity metrics because they measure, during a given period, the amount of cash generatedthat is available to repay debt obligations, make investments and for certain other activities. However,these non-GAAP measures should be considered in addition to, not as a substitute for or superior to, netincome, operating income, diluted earnings per share and net cash provided by operating activities, orother financial measures prepared in accordance with GAAP. Reconciliation to the GAAP equivalent ofthese non-GAAP measures are contained in tabular form on the attached unaudited financialstatements.Forward-Looking StatementsThis shareholder letter contains certain forward-looking statements within the meaning of the federalsecurities laws, including statements regarding US contribution margin growth; international expansion;content launches; product improvements; content spend, including investments in originals; lifespan ofour DVD business; member growth domestically and internationally, including net, total and paid;revenue; contribution profit (loss) and contribution margin for both domestic (streaming and DVD) andinternational operations, as well as consolidated operating income, net income, earnings per share andfree cash flow. The forward-looking statements in this letter are subject to risks and uncertainties thatcould cause actual results and events to differ, including, without limitation: our ability to attract newmembers and retain existing members; our ability to compete effectively; maintenance and expansionof device platforms for streaming; fluctuations in consumer usage of our service; service disruptions;production risks; actions of Internet Service Providers; and, competition, including consumer adoption ofdifferent modes of viewing in-home filmed entertainment. A detailed discussion of these and other risksand uncertainties that could cause actual results and events to differ materially from such6
forward-looking statements is included in our filings with the Securities and Exchange Commission,including our Annual Report on Form 10-K filed with the Securities and Exchange Commission on January29, 2015. The Company provides internal forecast numbers. Investors should anticipate that actualperformance will vary from these forecast numbers based on risks and uncertainties discussed aboveand in our Annual Report on Form 10-K. We undertake no obligation to update forward-lookingstatements to reflect events or circumstances occurring after the date of this shareholder letter.7
Netflix, Inc.Consolidated Statements of Operations(unaudited)(in thousands, except per share data)Three Months EndedSix Months EndedJune 30,2015March 31,2015June 30,2014June 30,2015June 30,2014 1,644,694 1,573,129 1,340,407 3,217,823 nology and )(32,293)1,100(31,421)RevenuesCost of revenuesGeneral and administrativeOperating incomeOther income (expense):Interest expenseInterest and other income (expense)8722,501Income before income taxes40,49038,426117,37278,916206,316Provision for income taxes14,15514,73046,35428,88582,183Net income 26,335 23,696 71,018 50,031 124,133Basic 0.06 0.06 0.17 0.12 0.30Diluted 0.06 0.05 0.16 0.12 0.29Earnings per share:Weighted-average common shares 49Diluted436,097433,809431,441434,958431,1418
Netflix, Inc.Consolidated Balance Sheets(unaudited)(in thousands, except share and par value data)As ofJune 30,2015AssetsCurrent assets:Cash and cash equivalentsShort-term investmentsCurrent content library, netOther current assetsTotal current assetsNon-current content library, netProperty and equipment, netOther non-current assetsTotal assetsLiabilities and Stockholders' EquityCurrent liabilities:Current content liabilitiesAccounts payableAccrued expensesDeferred revenueTotal current liabilitiesNon-current content liabilitiesLong-term debtOther non-current liabilitiesTotal liabilitiesStockholders' equity:Common stockAccumulated other comprehensive lossRetained earningsTotal stockholders' equityTotal liabilities and stockholders' equity December 640,767171,396242,1889,654,861 400,00060,0937,622,786 1,200,880(38,120)869,3152,032,0759,654,861 0(4,446)819,2841,857,7087,056,6519
Netflix, Inc.Consolidated Statements of Cash Flows(unaudited)(in thousands)June 30,2015Cash flows from operating activities:Net incomeAdjustments to reconcile net income to net cash (used in) provided byoperating activities:Additions to streaming content libraryChange in streaming content liabilitiesAmortization of streaming content libraryAmortization of DVD content libraryDepreciation and amortization of property, equipment and intangiblesStock-based compensation expenseExcess tax benefits from stock-based compensationOther non-cash itemsDeferred taxesChanges in operating assets and liabilities:Other current assetsAccounts payableAccrued expensesDeferred revenueOther non-current assets and liabilitiesNet cash (used in) provided by operating activitiesCash flows from investing activities:Acquisition of DVD content libraryPurchases of property and equipmentOther assetsPurchases of short-term investmentsProceeds from sale of short-term investmentsProceeds from maturities of short-term investmentsNet cash (used in) provided by investing activitiesCash flows from financing activities:Proceeds from issuance of common stockProceeds from issuance of debtIssuance costsExcess tax benefits from stock-based compensationPrincipal payments of lease financing obligationsNet cash provided by financing activitiesEffect of exchange rate changes on cash and cash equivalentsNet (decrease) increase in cash and cash equivalentsCash and cash equivalents, beginning of periodCash and cash equivalents, end of period 26,335Non-GAAP free cash flow 23,696 71,018Six Months EndedJune 30,June 30,20152014 50,031 4501,113,608604,965 2,293,872 2,454,777 1,214,244 2,293,872 1,214,244June 30,2015Non-GAAP free cash flow reconciliation:Net cash (used in) provided by operating activitiesAcquisition of DVD content libraryPurchases of property and equipmentOther assetsThree Months EndedMarch 31,June 30,20152014Three Months EndedMarch 31,June 30,20152014 (181,343) (127,382) (19,786)(22,906)(27,538)(13,036)(639)225 (229,306) (163,099) Six Months EndedJune 30,June 30,2015201456,024 (308,725) (20,981)(42,692)(19,869)(40,574)1,129(414)16,303 (392,405) 1092,383(35,895)(33,203)1,42424,709
Netflix, Inc.Segment Information(unaudited)(in thousands)As of / Three Months EndedJune 30,2015Domestic StreamingTotal memberships at end of periodPaid memberships at end of periodRevenuesCost of revenuesMarketingContribution profitInternational StreamingTotal memberships at end of periodPaid memberships at end of periodRevenuesCost of revenuesMarketingContribution profit (loss)Domestic DVDTotal memberships at end of periodPaid memberships at end of periodRevenuesCost of revenuesContribution profitMarch 31,2015As of/ Six Months EndedJune 30,2014June 30,2015June 1,05736,24435,085 1,025,913612,69173,427339,795 984,532582,52989,551312,452 838,225546,22364,727227,275 2,010,4451,195,220162,978652,247 19,30413,80112,90723,25121,64913,80112,907 454,763 415,397 307,461 870,160 (156,923)(50,261)5,3145,2195,5645,4706,2616,167 164,01886,09577,923 173,20088,59484,606 194,721101,92892,793 5,3145,2196,2616,167337,218174,689162,529 399,075208,753190,322ConsolidatedRevenuesCost of revenuesMarketingContribution profitOther operating expensesOperating incomeOther income (expense)Provision for income taxesNet income 1,644,694 1,573,129 1,340,407 3,217,823 13
EPS for Q2 amounted to 0.06 after adjustment for our 7-for-1 stock split (EPS would have been 0.42 using pre-split share count). We remain committed to running around break-even globally on a net income basis through 2016, and to then de


![Shareholders’ Agreement of [Company name] company. 1 .](/img/1/startup-founders-sha-sample.jpg)