Transcription
Housing: Upstate-styleCDPA Planners Toolbox Luncheon on HousingCorianne P. Scally, Ph.D. & Adam Yagelski, MRP
Today’s PresentationHousing Policy Trends: GovernanceHousing Policy Trends: DeliveryHousing in Upstate NY & the Capital RegionAffordable Rental Housing & NIMBYVacancies, Abandonment & Demolition inAlbany, NY
Housing Policy Trends: GovernanceFederalDecentralization ofdecision-making (vertical)StateLocalRise of networkedgovernance (horizontal)PublicPrivateNonprofit
Governance: Today’s Housing lHybrid Organizations
Housing Policy Trends: DeliveryDECREASINGDirect Market incentivesFlexibilityPeople-basedNonprofitization
Delivery: Federal Housing ProgramsPlace-basedProject-basedPublic housing &HOPE VILIHTCBlock grantsCDBG; HOME;HOPWA; NSPPeople-basedTenant-basedvouchersHCV; MTO; HOPE VIHomeowner-basedincentivesPre & Post-purchasecounselingTax deductionsFinancing: FHA,VA
Delivery: New York State –Place-basedNYS Public Housing (21,000 units left)Rent regulations (940,000 units protected)Mitchell-Lama (73,000 units left)Housing Trust Fund (16,000 units)Affordable Housing Corporation (51,200homeownership units)State Low Income Housing CreditState Historic Tax CreditsPilot Workforce Housing Inclusionary Zoning (LI)Source: NYS HCR, 2010
Delivery: New York State - People-basedHomeowner-based incentivesPre- and post-purchase counselingForeclosure prevention counselingTax incentivesSTAR exemptionFinancingFirst-time homebuyers through SONYMAparticipating lenders
Delivery: Local Housing Regulations,Infrastructure & ProgramsRegulations/InfrastructureLand useZoningBuilding codesPhysicalInfrastructurePublic ServicesProgramsHousing trust fundsLand banksLand trustsPILOTs/Tax breaksFast-track permittingFee waivers
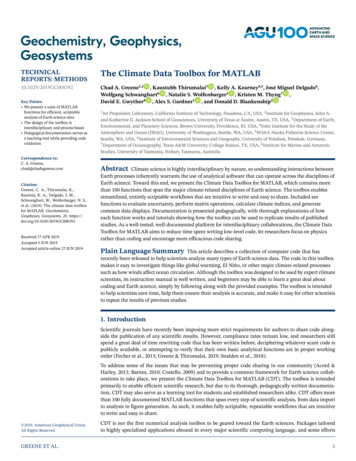
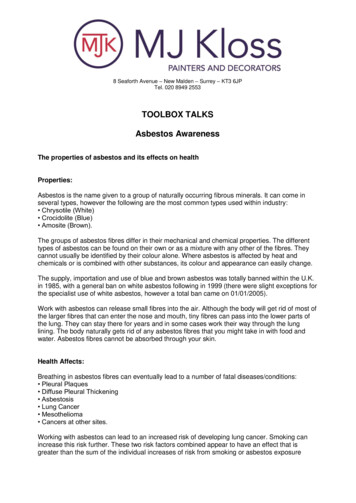
Housing in Upstate No BustSource: Federal Reserve Bank of New York, March 2010
BUT No Boom EitherMany units sit vacant and abandoned, or facedemolition, discarded by the market
YET Housing affordability is still a problemHigh poverty High unemployment Aging housing stockUpstaters report difficulty paying rent ormortgage (45%), utilities (70%);transportation costs (55%)Sources: Bureau of Labor Statistics;, 2012 Cornell Community & Regional DevelopmentInstitute, 2011
BUT Affordable housing is not alwayswanted, especially rental housingSo I asked: Why do some communities supportstate-assisted affordable rental housingdevelopment, while others do not?Case Studies/Matched Pairs in New York StateSimilarities (1990): geographic region, populationsize and change, income, poverty, raceDifference (1992-2009): Low Income Housing TaxCredit (LIHTC) apps & awards (high vs. low activity)
Case Selection CriteriaSelectionCriteriaMunicipalityNew YorkStateNACapital urgh(High)Poughkeepsie(Low)Socio-demographic ,45428,844Median HHIncome 32,965 25,152 24,316 22,224 27,606Poverty Rate13%18%15%27%15%% Black27%21%9%35%31%LIHTC Applications & Awards (Excluding New York City)Project AppsProject AwardsUnits ts Awards19,68660440372Sources: 1980 & 1990 Decennial Census; 1992-2009 NYS Project Database319
The Nuances of NIMBYHousingLegaciesDevelopmentEnvironmentPolitics &Perceptions Subsidized housing history Regional inequalities Regulations & incentives Conditions & costs Developer commitment & capacity Household fearsLocal official concernsMarket historiesRegional tensions
Legacies: Subsidized Housing HistoryProgramVouchersPublicHousingSection 8NC/MRLIHTC (9%)LIHB (4%)HTFYear2000201020002010Capital DistrictMid-HudsonAlbany Schenectady Newburgh 6040000402223700580658532121025132126Sources: HUD Picture of Subsidized Housing; NYS Database; Consolidated Plans; Interviews
Legacies: Regional InequalitiesHistories of regional inequalities in thedistribution of affordable rental housingperpetuate vicious cyclesExisting distributions easiest to perpetuateAvailable solutions highlight tensions withincompeting goals
Environment: Regulations & IncentivesCapital DistrictAlbanySchenectadyLot Sizes &SetbacksTwo-familyZoningZoning for3 unitsInclusionaryZoningPermitting &FeesProperty ie
Environment: Developer CapacityDeveloper capacity varies based on:Opportunities givenOther developers in the marketRehab/historic preservation requires moreDeveloperCapital dsonNewburghPoughkeepsie
Community rket
Implications for Policy & Practice: NYSOvercoming Legacies Facilitate regional solutionsOvercoming Environment Fund higher-cost rehab in weak markets Foster developer commitment & capacityOvercoming Perceptions Increase program & project transparency Monitor, evaluate & respond to outcomes
Implications for Policy & Practice:Local GovernmentOvercoming Legacies Maintain positive trajectory of subsidized units Deal effectively with abandonment & foreclosureOvercoming Environment Plan comprehensively and “smartly” for housing Foster positive relationships with developersOvercoming Perceptions Encourage diverse neighborhoods
Demolition of Vacant and AbandonedBuildings in Albany, N.Y.Adam Yagelski, MRP
Metropolitan Restructuring & Abandonment Metropolitan RestructuringAbandonmentBuilt environment responded to these changes in specificways, and increased levels of abandonment and vacancyresulted.Defined: Vacancy, delinquency, lack of investment “transactional vacants” vs “problematic vacants”(Keenan et al., 1999) When has a unit been withdrawn from the housingmarket? (Wilson and Margulis, 1994)From symptom to cause of disinvestment (Accordino andJohnson, 2000)Management techniques (Cohen, 2001): code enforcement,tax foreclosure, eminent domain, cosmetic improvements
Demolition Removal of abandoned buildings is also amanagement strategy. Private demolition versus “abandonment”—orpublic—demolition (Bender, 1979) Intersection of social and material forces In Albany:Weak housing marketLargely abandonment demolitionComplicated tax foreclosure processIncreasing levels of vacancy and abandonment
Problematizing DemolitionRemoval of buildings from the building stock disruptsthe “collective memory” (Page, 1999) written into thebuilt environment.Demolition of the built environment can beunsustainable from an energy and materialsthroughput perspective.Demolition removes potentially viable—andpotentially affordable—units from the housing stock.In weak housing markets, it is the result of policydecisions, the effects of which may be inequitable.
Research QuestionsIs demolition even with respect to the extent of vacancyand abandonment in Albany?Do neighborhood socio-economic factors matter?Is demolition determined largely by building physicalcharacteristics and level of maintenance, or do otherfactors, such as local policy and housing submarketindicators, play a role?
Data and methodCensus tract data (LTDB)Vacant buildings data (N 719)Sources2002 UAlbany PlanningStudio2002-2010 ORPTS parcelassessment dataMapping and logistic regression
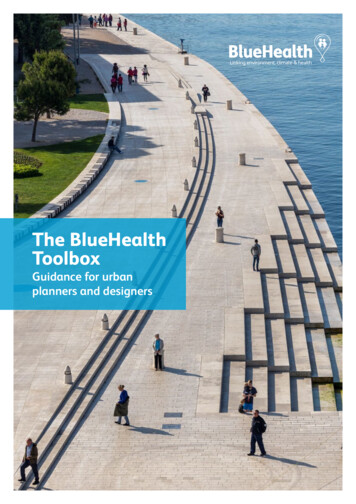
Annualized Demolition StatisticsCumulative PercentageNumber 22% demolished20 demolitions/year; over 50% demolished after four yearsinfluence of external economic forces
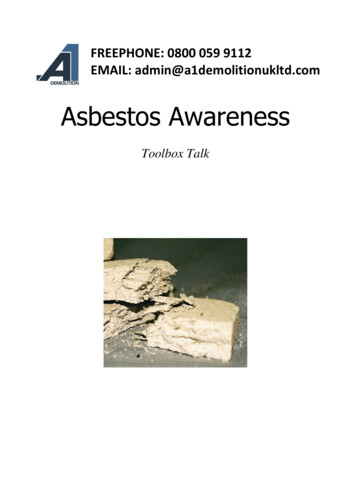
387 Elk Street171 Sheridan Avenue329 Sherman Street14 Teunis Street
Vacant Property& Demolitions
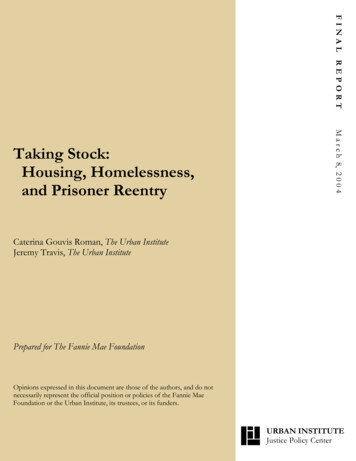
Surveyed VacantDensityDemolitionDensity
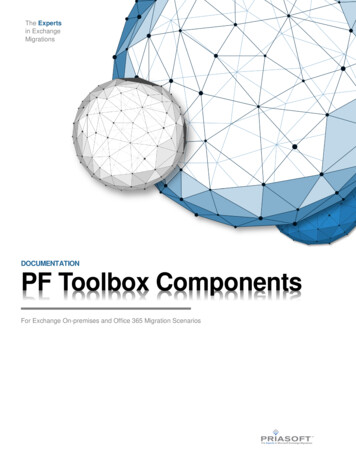
Number (N 26) & Rate of Demolitions0.450.40Rate of Demolition0.350.30R² r of Surveyed Vacant Buildings140160180200average demolition rate of 14% for tracts with surveyedvacant buildings (n 16)moderate to strong correlation but over 35% of variancenot explained
Table 1. Average tract-level indicators and incidence of demolition and vacancy, City of Albany.*n 11; **n 5; ***n 10Tract data cleave along the lines of demolition versus nodemolition on socio-economic indicators.Not shrinking!population increaseincrease in OHU densityOHU shows density gradient:No vacantsVacants and demolitionVacants all standing
Regression ResultsFull model (N 719)Increase demolition probabilityboardingframe constructionsingle-family residenceinclusion on Albany County vacantbuilding list (2002)public ownership (2002)ownership change (2002-2010): privateto publicDecrease demolition probabilitylocation on a principal urban arterialhistoric district location2002 tax assessed valueConditions model (n 483)Increase demolition probability single-family residence public ownership (2002) ownership change (2002-2010):private to public Poor foundation Average and poor window sills Average, poor, deteriorated windowglassDecrease demolition probability historic district location 2002 tax assessed value Poor condition, street-facing wall offrame buildings
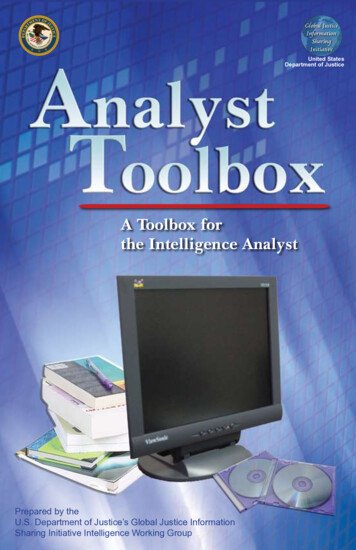
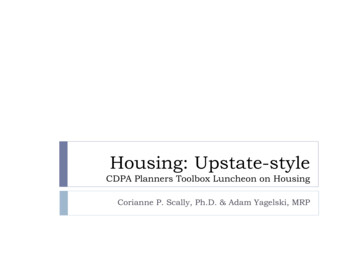
LITIONPUBLICOWNERSHIPFigure 6. Conceptual model of relationship betweeneconomy, ownership, abandonment, and demolition.
UpshotDemolition is uneven, socially and spatially.Public ownership, historic districts, assessed value, andsingle-family residence best explain demolition propensityacross models.Conditions variables associated with demolition are notnecessarily associated with major structuraldeterioration.Are “the worst” buildings being taken down?Close association of window glass condition withdemolition indicates that modest levels of interventionand investment can potentially have large effects ondemolition.
Policy recommendationsThe results demonstrate the viability and utility ofimplementing a regular building condition survey to assess levels ofbuilding maintenance and inform stewardship practices.Continued salience of city-county foreclosure relationship ( )These results indicate that policy and potentially advocacy are working(e.g. historic districts).Supports recent initiatives to redirect funds toward rehabilitation andaway from demolition.Continued salience of city-county foreclosure relationship (-)Need to “break the cycle” of demolition in Albany“Broken windows”Democratize the distribution as well as collection of data on vacancyand tax foreclosures
Financing: FHA, VA. Delivery: New York State –Place-based NYS Public Housing (21,000 units left) . First-time homebuyers through SONYMA participating lenders. Delivery: Local Housing Regulations, Infrastructure & Programs . “transa