Transcription
Acta Chiropterologica, 17(1): 171–177, 2015PL ISSN 1508-1109 Museum and Institute of Zoology PASdoi: 10.3161/15081109ACC2015.17.1.014Estimating colony size of the wrinkle-lipped bat, Chaerephon plicatus(Chiroptera: Molossidae) at Gomantong, Sabah, by quantitative image analysisDONALD A. MCFARLANE1, 5, GUY VAN RENTERGEM2, ANNEMIEKE RUINA1, JOYCE LUNDBERG3,and KEITH CHRISTENSON41KeckScience Center, The Claremont Colleges, Claremont, CA 91711, USANA c9 3803919, Koningin Astridstraat 57, 9800 Deinze, Belgium3Department of Geography and Environmental Studies, Carleton University, Ottawa, ON K1S 5B6, Canada42026 Peach Orchard Drive Apt. 23, Falls Church, VA 22043, USA5Corresponding author: E-mail: dmcfarlane@kecksci.claremont.edu2The Gomantong cave system, Kinabatangan, Sabah (Malaysia) hosts one of the largest bat colonies known from north Borneo. Thenightly exodus of Chaerophon plicatus from this site is an economically valuable tourist attraction, and must impose significantcontrols on the regional ecology. Monitoring ecosystem health requires monitoring bat population size, but no quantitativeassessments for the Gomantong colony are available in the literature. Traditional censusing techniques (based on packing densityand roost area or on roost exodus counts) yield notoriously unreliable results. Here we have applied innovative image analysis andcounting techniques to videographic, photographic and terrestrial laser scanning data obtained in July 2012. The colony exits ina consistent stream along a narrow exit trajectory. The laser scanning of the large cave entrance allowed precise measurement of batposition. Video data provided 0.02-second time resolution. Average flight speed was calculated (10.38 0.85 m/sec), bat exit ratewas estimated at three minute intervals (peaking at 14,000 bats/minute) and then summed over the 40 minutes of bat flight. Theresultant colony size estimate of 275,625–276,939 (95% confidence interval) individuals of C. plicatus in Gomantong Caves in 2012demonstrates that the technique is viable, provides a realistic basis for ecosystem management, and can be repeated to monitorecosystem change. The estimated insect consumption by the colony of this size is 927 191 metric tons of insects per year over anestimated 270 km2 area, a very important component in maintaining ecosystem stability in the Gomantong Forest Reserve and theKinabatangan Wildlife Sanctuary, as well as pest control over the large agricultural tracts of the region.Key words: Borneo, Kinabatangan, bats, caves, colony size, image analysis, terrestrial laser scanningINTRODUCTIONChaerophon plicatus (family Molossidae, subfamily Molossinae) is a widely distributed batthroughout lowland South Asia and Southeast Asia,from India east to the Philippines and south toLombok (Heaney et al., 1998; Molur et al., 2002).The species is a facultative cave-dweller, and in suitable locations forms very large cave colonies. Innorthern Borneo, spectacularly large colonies arewell-known from Simud Hitam Cave (GomantongForest Reserve, Sabah — Fig. 1) and Deer Cave(Mulu National Park, Sarawak). A formerly verylarge colony, now much reduced, occupies NiahCave (Niah National Park, Sarawak — Medway,1958; Struebig et al., 2010). Foraging areas havenot been explicitly measured for this species, butby analogy to the North American member of thesame subfamily — Tadarida brasiliensis (Ammerman et al., 2012) which has measured nightlyforaging ranges averaging 41 km around the Carlsbad Caverns (New Mexico) colony (Best andGeluso, 2003).It can be presumed that major C. plicatuscolonies are top insect predators over very largeexpanses of lowland rainforest and agriculturalmosaics. These colonies feed on some nine kg ofinsect prey per 1,000 bats per night (based onmass scaled feeding rates of T. brasiliensis fromKunz et al., 1995; C. plicatus mean body mass of15.5 g from Leelapaibul et al., 2005 versus 12.3 gfor T. brasiliensis from Wilkins, 1989), and theiraccumulated guano supports rich subterraneanecosystems (Chapman, 1983) including a numberof endemic species (Ng, 1991; McFarlane et al.,2009).
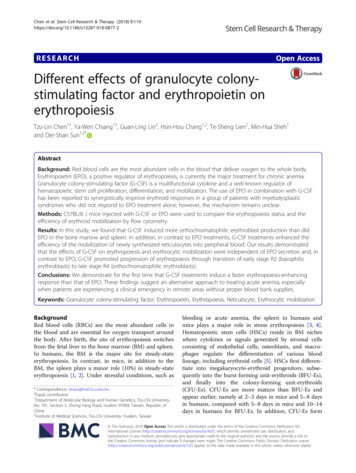
172D. A. McFarlane, G. Van Rentergem, A. Ruina, J. Lundberg, and K. ChristensonTechniques for censusing bat colonies are reviewed in Kunz et al. (2009). Large cave roostingcolonies of molossid bats, especially T. brasiliensiswhich forms very large colonies across the American southwest, have traditionally been countedeither by assessments of roost (cave ceiling) areamultiplied by packing density, or by roost exoduscounts (usually photographic — e.g., Humphrey,1971 or videographic — e.g., Miller et al., 1988).These types of assessments have a long history, beginning around 1937 (Allison, 1937), but have beenfraught with problems. For example, early estimatesof ca. 25 million T. brasiliensis in the summerbreeding colony within Eagle Creek Cave, Arizona,were exaggerated by an order of magnitude, apparently due to the cave being recorded as 96 m inlength, rather than the correct 57.3 m (McFarlaneand Keeler, 1990). A more realistic colony size assessment in 1969 led to an erroneous but widelyread and influential report on the apparent 99.9%collapse in colony size (Cockrum, 1970). Similarly,an unrealistic estimate of the density of the flightcolumn leaving Carlsbad Caverns (New Mexico,USA) produced a much-quoted but quite erroneousestimate of nine million individuals in 1936 (Allison, 1937). As demonstrated by Betke et al. (2008)and Hristov et al. (2008), the correct figure can beshown to be between 600,000 and 800,000. Indeed,Betke et al. (2008) have shown that in the five majorT. brasiliensis caves they studied with thermal imaging counts, all had significantly overestimatedcolony sizes reported in early reports, in some casesFIG. 1. Location map showing the Gomantong caves and their relationship to the Kinabatangan protected areas
Estimating colony size of Chaerephon plicatus at Gomantong, Sabahby more than an order of magnitude. Quantitativeimage analysis (e.g., Hallam et al., 2010) providesa new level of precision for large bat colony assessment, and is applied here to generate the first truecolony size estimate for a Bornean cave.The Gomantong caves have an informally reported bat diversity of 12 species (Abdullah et al.,2007), the majority of which are present in smallnumbers or do not co-roost with C. plicatus. Thecolony of C. plicatus which roosts at Gomantonghas been described in popular media as numbering‘600,000–2 million’ (Abdullah et al., 2005), but hasnever been quantitatively assessed. Here we providethe first such assessment, based on replicable photographic methods, and briefly consider the impact ofthe colony on the local environment.MATERIALS AND METHODSGomantong Forest Reserve is a 51 km2 lowland dipterocarpforest that is the largest intact component of the 260 km2Kinabatangan Wildlife sanctuary. Most of the remainder of theLower Kinabatangan River drainage area has been convertedto oil palm cultivation. The central feature of the Gomantong Forest Reserve is a 228 m high limestone hill containingthe Gomantong caves. Simud Hitam (5.530550N, 118.071734E)is the lower of the two main caves, which total some 2.03 kmsof passage. A large colony of C. plicatus roosts in a blindending fissure passage, locally named Hagob Kabilau (Wilford, 1964), within Simud Hitam cave, Gomantong (Fig. 1).Significant numbers of C. plicatus do not roost elsewhere atGomantong, and the Hagob Kabilau roost is shared with onlycomparatively small numbers of Rhinolophus philippinensisand Hipposideros cervinus. This colony begins exiting the roostapproximately an hour before sunset (18:26 hrs local time), fliesin an anti-clockwise spiral pattern within the ‘Great Lighthole’,and finally leaves the lighthole in a consistent stream passingeast of the Lobing Payau entrance (Fig. 2). The bat flight wasrecorded as high-definition video in both July 2012, and againin July 2014. Cameras used were a Sony HDR-HC1E andCanon Legria Hv40, 1080i (2012), and a Canon XA20 1080p(2014), the latter providing the highest resolution, non-interlaced, 50 frames per second recording. Cameras were positioned to silhouette the bats against the sky, and artificial illumination was not required. The 2014, 1080p, data were used forbat speed calculations, but did not record the full bat flight.Research was conducted under the auspices of the ForestryDepartment (Sabah), and the Sabah Biodiversity Center.Geometry, physical access and the large scale of the caveentrance precluded precise determination and scaling of thecamera-to-bats position in the field. However, Simud Hitamcave was documented by terrestrial laser scanning (TLS) in2012, with additional work in 2014, using a Faro3D TLS scanner operating a 1/4 resolution and producing centimeter-scaleresolution (McFarlane et al., 2013). By matching the 2014 videoframe imagery to the TLS 3D triangulated irregular network(TIN) mesh model in Blender v2.73 software (www.blender.org) the video camera locations were matched to the TIN model.Blender was then used to circumscribe a virtual ‘flight box’ ofprecise dimensions through which the exiting bat stream passes173(Fig. 3). The 1080p, 50 frames/second recording rate providesa sequence of time slices of 0.02 s in duration. Individual batscan be traced through successive frames imaging a 5.0 m long‘flight box’ (up to 5.3 m for more distant trajectories dueto perspective), to derive transit time. We used a Monte-Carloapproach to determine random flight distances in the range5.0–5.3 m for 100 simulations, and calculated flight speed as:V 1/(T/D)where T is the transit time (frames per second) and D the randomized flight box length.To then assess the number of bats exiting the cave per unittime, stills from the video footage from 2012 were scaled usingthe wingspan of the bats visible in high-resolution still photography of the same scene. Wilkins (1989) measured the forearmlength of T. brasiliensis to be 42.3 2.8 mm, with a wingspanof 300.6 mm. Chaerophon plicatus has a forearm length of40–43.5 mm (Payne and Francis, 1985); we assume an in-flightwingspan of 300 mm for C. plicatus in this study, consistentwith a value of 317 13 mm given by Leelapaibul (2003) forthe species in Thailand. Scaled video images were used to establish a virtual flight box, and the bat exit rate was calculated as:Ex Nbats/(Lpath/Fspeed)where Ex is the exit rate in bats/second, Nbats is the number ofbats observed in the counting frame, Lpath is the length of theflight path enclosed in the counting frame, and Fspeed is the flightspeed of the bats.Recording was started approximately 10 minutes before thestart of the bat exodus (18:15 hrs local time) and continued forsome ten minutes after the end of the exodus (19:15 hrs localtime). Exit rate was averaged for three consecutive frames, atthree-minute intervals during the entire bat flight (ca. 40 minutes). For the final estimate of total bat colony size, we combined flight speed error and bat counting errors according tostandard error propagation theory (Zar, 2010) to derive a meanand standard deviation on bat exit rate for each minute of thetotal flight, and totaled these to find colony size.RESULTSCamera to center-of-bat-flight-column distancewas determined to be 41.94 m. Flight speed for 12individual bats passing though the 5.0–5.3 m virtualflight box was 10.38 0.85 m/s ( 1SD), whichis marginally faster though entirely consistentwith very precise measurements of 9.38 0.02 m/s( 1SD) for the slightly smaller T. brasiliensisimaged exiting a Texas cave reported by Theriaultet al. (2010), and somewhat slower than the estimated 11 m/s (no quoted SD) reported for T. brasiliensis by Best and Geluso (2003). Exit rategenerally rises with time, peaking 40 minutesinto the flight and then dropping precipitously tozero (Fig. 4). Standard error of the mean exitrate varies from 18 to 202 bats/minute. The meanestimate of the size of the bat colony exiting thecave on 17th July 2012 was 276,282 335 ( 1 SE),or 275,625–276,939 individuals (95% confidencelimits).
174D. A. McFarlane, G. Van Rentergem, A. Ruina, J. Lundberg, and K. ChristensonFIG. 2. Three dimensional model of Simud Hitam, showing the bat flight path (data from terrestrial laser scanning — McFarlane etal., 2013) aligned with plan view of the cave (modified from cartography by GVR)
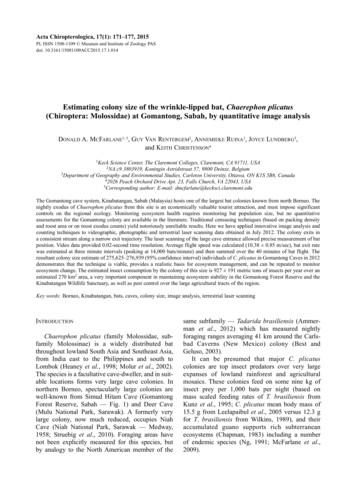
Estimating colony size of Chaerephon plicatus at Gomantong, Sabah175FIG. 3. Virtual ‘flight box’ developed from terrestrial laser scanning model, seen in vertical (upwards) view of the Great Light Hole,Simud Hitam. A — denotes the camera’s position, B — swiftlets in flight, and C — bats exiting the virtual flight boxCurrent state-of-the-art bat exodus countingtechniques involving thermal imaging devices canprovide extremely accurate counts under suitableconditions (e.g., Hristov et al., 2008). However,they are limited by the high cost of the devices( Euro 40,000) and low resolution (typicallyaround 15% of the resolution of standard 1080pvideo) which constrains their use to situations inwhich the devices can be placed in relatively closeproximity to the cave entrance. Our technique utilizes low cost ( Euro 1,000) universally-availabledigital video or camera equipment which has theadded benefit of high resolution and greater flexibility in camera placement. In this study we utilizedterrestrial laser scanning data to retrospectively determine camera-to-bat distances, but this information could equally well be obtained with a simplelaser distance meter ( Euro 100). The limitations ofour technique are lower counting precision ( 1%),and potential problems with imaging when the batflight extends into complete darkness, as is commonin smaller bat colonies.The colony size estimate presented here is basedon a single day’s bat flight. Hristov et al. (2010)have shown that cave molossid counts can show significant variation between days, especially whenweather conditions are unfavorable and fewerbats leave the roost. However, on 17th July 2012, we16,000Exit rate me (minutes)FIG. 4. Exit rate of C. plicatus at Gomantong, 17th July 2012,plotted with a three-point moving average against elapsed time.Local time at 0 minutes bat flight was 18:23 hrs
176D. A. McFarlane, G. Van Rentergem, A. Ruina, J. Lundberg, and K. Christensonexamined the interior of the roost thoroughly afterthe bats had left and determined that the colony hadfully exited, so that our estimate is not compromisedby an incomplete exodus.Our quantitative count of the C. plicatus colonyin Simud Hitam is substantially smaller than widelydisseminated anecdotal estimates ranging as highas two million individuals. In this respect, our results mirror comparable studies of T. brasiliensisin the southwestern USA which have been routinely overestimated in almost all cases (McCracken,2003; Betke et al., 2008). Nevertheless, the significance of the Simud Hitam colony should not beunderestimated.The colony of ca. 790,000 T. brasiliensis inCarlsbad Caverns, USA (Hristov et al., 2010) areknown to forage over an area of some 2.5 103 km2(based on a 41 km linear foraging radius reported byBest and Geluso, 2003, and conservatively assuming a semi-circular range centered on the cave).The Simud Hitam C. plicatus colony can thereforebe confidently assessed to be one of the dominantinsectivores over the entire 270 km2 of the Kinabatangan Wildlife Sanctuary (Fig. 1), one of Sabah’smost important biodiversity refugia, and well beyond over primarily oil-palm (Elaeis guineensis)plantations. The role of birds and/or bats in regulating herbivorous insect pests in these plantations hasbeen experimentally demonstrated and may maintain palm fruit yields 9–26% higher than in bird/bat-excluded plots (Koh, 2008). The role of insectivorous bats as pest control agents in oil palm agricultural systems has not yet been examined, but mustbe presumed to be substantial, as is the case withT. brasiliensis and cotton agriculture in Texas, USA(Cleveland et al., 2006) and rice cultivation in Thailand (Wanger et al., 2014) and the Mediterranean(Puig-Montserrat et al., 2015).A number of studies address food consumptionby insectivorous bats. Kunz et al. (1995) reportnightly gross food intake for T. brasiliensis as59.4 12.38% of pre-ingestion body mass. Usinga mean body mass of 15.5 g for C. plicatus (Leelapaibul et al., 2005), gross nightly insect consumption is predicted to be 9.2 1.9 kg live mass/1,000 bats, equivalent to some 927 191 metric tonsper year.Further counts of the Simud Hitam C. plicatuscolony in future years, taken with due attention tothe determination of counting error, are warranted toestablish a baseline for monitoring the ecologicalhealth of the Kinabatangan Wildlife Sanctuary. Thetechnique presented here has general applicabilityto C. plicatus colonies elsewhere in Southeast Asia,provided that the physical geometry of the caveentrances permit accurate scaling of the imagery.ACKNOWLEDGEMENTSWe thank Datuk Sam Mannan and Valeria Linggok of theSabah Forest Department, and the staff of the Sabah Biodiversity Council for permission to conduct multidisciplinary studiesat Gomantong. Manfred Buchroithner, Cristin Petters, BenjaminSchroeter and Warren Roberts provided invaluable field support. We gratefully acknowledge the assistance of the NationalGeographic Society (grant #9413-13) without which this projectwould have been impossible.LITERATURE CITEDABDULLAH, M. T., I. V. PAUL, and I. HALL. 2005. A frightfulstairway to cave bats in Borneo. Bats, 23 (3): 11–13.ABDULLAH, M. T., L. S. HALL, O. B. TISSEN, A. TUUGA, andS. CRANBROOK. 2007. The large bat caves of MalaysianBorneo. Bat Research News, 48: 99–100.ALLISON, V. C. 1937. Evening bat flight from Carlsbad Caverns.Journal of Mammalogy, 18: 80–82.AMMERMAN, L. K., D. N. LEE, and T. M. TIPPS. 2012. First molecular phylogenetic insights into the evolution of freetailed bats in the subfamily Molossinae (Molossidae, Chiroptera). Journal of Mammalogy, 93: 12–28.BEST, T. L., and K. N. GELUSO. 2003. Summer foraging range ofmexican free-tailed bats (Tadarida brasiliensis mexicana)from Carlsbad Caverns, New Mexico. The SouthwesternNaturalist, 48: 590–596.BETKE, M., D. E. HIRSH, N. C. MAKRIS, G. F. MCCRACKEN, M.PROCOPIO, N. I. HRISTOV, S. TENG, A. BACCHI, J. REICHARD,J. W. HORN, et al. 2008. Thermal imaging reveals significantly smaller Brazilian free-tailed bat colonies than previously estimated. Journal of Mammalogy, 89: 18–24.CHAPMAN, P. R. J. 1983. Species diversity in a tropical caveecosystem. Proceedings of the University of Bristol Spelaeological Society, 16: 201–213.CLEVELAND, C. J., M. BETKE, P. FEDERICO, J. D. FRANK, T. G.HALLAM, J. HORN, J. D. LÓPEZ, G. F. MCCRACKEN, R. A.MEDELLÍN, A. MORENO-VALDEZ, et al. 2006. Economicvalue of the pest control service provided by Brazilian freetailed bats in south-central Texas. Frontiers in Ecology andEnvironment, 4: 238–243.COCKRUM, E. L. 1970. Insecticides and guano bats. Ecology, 51:761–762.HALLAM, T. G., A. RAGHAVAN, H. KOLLI, D. DIMITROV, P. FEDERICO, H. QI, G. F. MCCRACKEN, M. BETKE, J. K. WESTBROOK, K. KENNARD, et al. 2010. Dense and sparse aggregations in complex motion: video coupled with simulationmodeling. Ecological Complexity, 7: 69–75HEANEY, L. R., D. S. BALETE, M. L. DOLLAR, A. C. ALCALA,A. T. L. DANS, P. C. GONZALES, N. R. INGLE, M. V. LEPITEN,W. L. R. OLIVER, P. S. ONG, et al. 1998. A synopsis ofthe mammalian fauna of the Philippine Islands. Fieldiana:Zoology (N.S.), 88: 1–61.HRISTOV, N. I., M. BETKE, and T. H. KUNZ. 2008. Applicationsof thermal infrared imaging for research in aeroecology.Integrative and Comparative Biology, 48: 50–59.HRISTOV, N. I., M. BETKE, D. E. H. THERIAULT, A. BAGCHI, and
Estimating colony size of Chaerephon plicatus at Gomantong, SabahT. H. KUNZ. 2010. Seasonal variation in colony size ofBrazilian free-tailed bats at Carlsbad Cavern bas
nightly exodus of Chaerophon plicatusfrom this site is an economically valuable tourist attraction, and must impose significant . Kinabatangan Wildlife Sanctuary, as well as pest control over the large agricultural