Transcription
Current and Future Costs of RenewableEnergy Project Finance AcrossTechnologiesDavid Feldman,1 Mark Bolinger,2 and Paul Schwabe11 National Renewable Energy Laboratory2 Lawrence Berkeley National LaboratoryNREL is a national laboratory of the U.S. Department of EnergyOffice of Energy Efficiency & Renewable EnergyOperated by the Alliance for Sustainable Energy, LLCThis report is available at no cost from the National Renewable EnergyLaboratory (NREL) at www.nrel.gov/publications.Contract No. DE-AC36-08GO28308Technical ReportNREL/TP-6A20-76881July 2020
Current and Future Costs of RenewableEnergy Project Finance AcrossTechnologiesDavid Feldman,1 Mark Bolinger,2 and Paul Schwabe11 National Renewable Energy Laboratory2 Lawrence Berkeley National LaboratorySuggested CitationFeldman, David, Mark Bolinger, and Paul Schwabe. 2020. Current and Future Costs ofRenewable Energy Project Finance Across Technologies. Golden, CO: NationalRenewable Energy Laboratory. sti/76881.pdf.NREL is a national laboratory of the U.S. Department of EnergyOffice of Energy Efficiency & Renewable EnergyOperated by the Alliance for Sustainable Energy, LLCTechnical ReportNREL/TP-6A20-76881July 2020This report is available at no cost from the National Renewable EnergyLaboratory (NREL) at www.nrel.gov/publications.National Renewable Energy Laboratory15013 Denver West ParkwayGolden, CO 80401303-275-3000 www.nrel.govContract No. DE-AC36-08GO28308
NOTICEThis work was authored in part by the National Renewable Energy Laboratory, operated by Alliance for SustainableEnergy, LLC, for the U.S. Department of Energy (DOE) under Contract No. DE-AC36-08GO28308. Fundingprovided by U.S. Department of Energy Office of Energy Efficiency and Renewable Energy Office of StrategicPrograms and Solar Energy Technologies Office. The views expressed herein do not necessarily represent theviews of the DOE or the U.S. Government.This report is available at no cost from the National RenewableEnergy Laboratory (NREL) at www.nrel.gov/publications.U.S. Department of Energy (DOE) reports produced after 1991and a growing number of pre-1991 documents are availablefree via www.OSTI.gov.Cover Photos by Dennis Schroeder: (clockwise, left to right) NREL 51934, NREL 45897, NREL 42160, NREL 45891, NREL 48097,NREL 46526.NREL prints on paper that contains recycled content.
AcknowledgmentsThis work was authored by the National Renewable Energy Laboratory, operated by Alliancefor Sustainable Energy, LLC, for the U.S. Department of Energy (DOE) under Contract No.DE-AC36-08GO28308. Funding provided by U.S. Department of Energy Office of EnergyEfficiency and Renewable Energy Office of Strategic Programs and Solar Energy TechnologiesOffice.The authors would like to thank the following individuals for their thoughtful reviews andcomments on this work: Paul Donohoo-Vallett (DOE), Rebecca Jones Albertus (DOE), DougArent (NREL), Jay Bartlett (Resources for the Future), Philipp Beiter (NREL), Dan Bilello(NREL), Elaine Hale (NREL), Parthiv Kurup (NREL), Robert Margolis (NREL), Mike Meshek(NREL), Gian Porro (NREL), Edward Settle (NREL), Rocio Uria Martinez (Oak Ridge NationalLaboratory), Laura Vimmerstedt (NREL), and Ryan Wiser (Lawrence Berkeley NationalLaboratory).iiiThis report is available at no cost from the National Renewable Energy Laboratory (NREL) at www.nrel.gov/publications.
List of SMUDSOFRWACCAnnual Technology BaselineBloombergNEFconcentrating solar powerU.S. Department of Energydebt service coverage ratioEdison Electric InstituteUS. Energy Information AdministrationFederal Reserve Economic Datagigawattinvestor-owned utilityindependent power producerinternal rate of returninvestment tax creditDepartment of Water and Powerlevelized cost of electricityLondon Inter-Bank Offered Ratemodified accelerated cost recovery systemNational Renewable Energy LaboratoryOmaha Public Power Districtpublicly owned utilitypower purchase agreementPublic Service Enterprise Groupproduction tax creditreturn on equityrate of returnSolar Rate Base AdjustmentSacramento Municipal Utility DistrictSecured Overnight Financing Rateweighted average cost of capitalivThis report is available at no cost from the National Renewable Energy Laboratory (NREL) at www.nrel.gov/publications.
Executive SummaryThis report documents a consistent set of technology-specific U.S. financing cost benchmarksfor renewable and conventional energy technologies. The benchmarks are intended for use inthe National Renewable Energy Laboratory’s Annual Technology Baseline (ATB), a crosstechnology modeling and analysis framework of current and projected future cost of electricgeneration and storage technologies. 1 Renewable energy technologies covered in the ATBinclude land-based wind, offshore wind, utility-scale solar photovoltaic (PV), distributed PV,concentrating solar power (CSP), geothermal, and hydropower; conventional technologiescovered include natural gas, coal, nuclear, and biopower. 2 Because ATB develops independentprojections of the change in renewable energy costs and characteristics of new generating assetsover time—while relying on other sources for conventional electric generation technologies—wefocus our analysis reported here primarily on these renewable energy technologies, estimatingboth current and future financing costs to 2030. We also benchmark financing costs for newnatural gas generation facilities, as they represent the vast majority of all recently installedconventional electricity generation. 3 In all cases, the goal is to portray consistent, representativefinancial transactions and financing terms.While there is a wide variety of financial ownership structures and individual projectcharacteristics for U.S. electric generation assets, we benchmark current finance costs for assetsowned by independent power producers (IPPs) because this ownership status represents mostnew electric generation assets in the United States, particularly for renewable energy plants. IPPsuse tax equity arrangements as the primary financial arrangement for most U.S. renewableenergy assets, without the need for external financial partnerships. We benchmark IPPs primarilyto simplify the complexity of formulating a common set of financial assumptions for a variety oftechnologies over time and to reflect that federal renewable tax credits are phasing down over thenext few years. 4 We also estimate future changes to finance costs from the planned expiration oftax credits and a likely increase in interest rates from current historical lows, as both are assessedto be fairly certain and easy to quantify. Lastly, we benchmark financial costs for renewableenergy assets assuming these projects sell their electricity through long-term power contracts, orThe financing cost benchmarks are used in ATB to calculate levelized cost of energy for each technology over timeand can be more generally used in other analyses that require current or future financing inputs for varioustechnologies.2While biopower can be considered a renewable energy technology, NREL does not perform research in that area;biopower is treated in the ATB similar to conventional electric generation technologies.3Feldman and Margolis (2020) report that from 2010 to 2019, 79% of conventional U.S. electric generationtechnology capacity additions (including biomass) were natural gas facilities.4Other reasons for not modeling tax equity transactions include that not all owners of electric generating assets enterinto tax equity arrangements, and that far fewer will do so in the future given the current phasedown of federal taxcredits. In addition, despite tax equity having a relatively low internal rate of return (IRR) of 6%–8% accordingto Norton Rose Fulbright (2020a) compared to the cost of equity estimated in this report ranging from 7.5% to 10%,the costs and complexity of tax equity transactions make them more inefficient and also mask the transparencyrequired for cross-technology comparisons over time, given different emphasis on different metrics. For example, atax equity provider may be more interested in its return on investment (ROI)—that is, the total amount of return itreceives in excess of its initial investment, regardless of time—than its rate of return (RoR) or internal rate of return(IRR; i.e., the annualized return of an investment over a period of time). For example, investors in a solar projectmay receive a considerable portion of their initial investment back in the first year in the form of tax credits anddepreciation expense benefits, and nearly all their return in the first five years of an investment, so that the IRRdoes not properly convey the amount of money made on a transaction to the same degree as ROI.1vThis report is available at no cost from the National Renewable Energy Laboratory (NREL) at www.nrel.gov/publications.
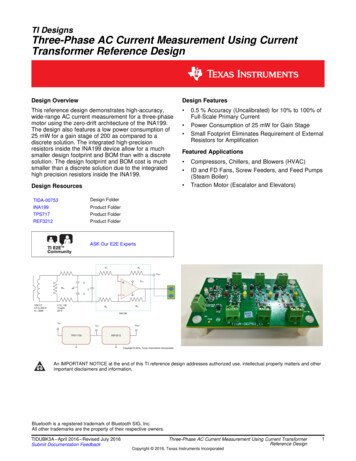
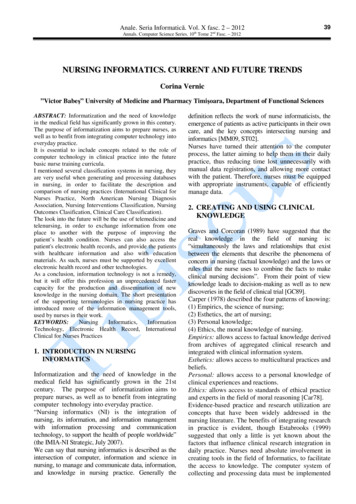
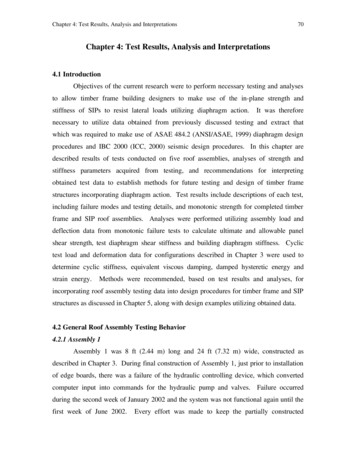
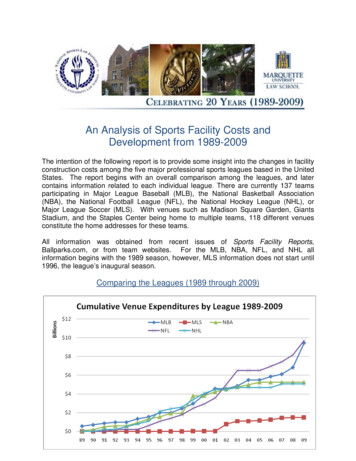
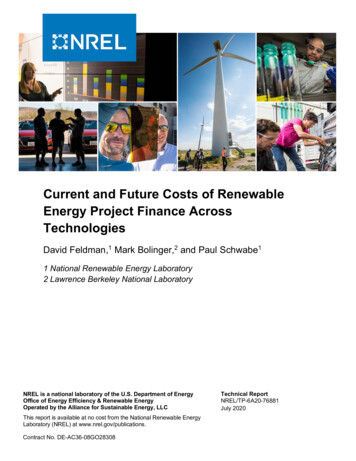
power purchase agreements (PPAs); IPP financing structures in the United States are currentlybased primarily on projects obtaining these contracts before receiving construction funding.Natural gas plants are typically not able to obtain contracts of such a long duration, and so webenchmark natural gas plants assuming quasi-merchant electricity sales. However, there aremany other factors that could affect financing costs that are less certain to occur and are moredifficult to quantify in terms of their impact; we discuss these additional factors in the report, butwe do not incorporate them into future estimates of financing costs.We collect data from a variety of sources that have exposure to different renewable andconventional energy technology financings, both in the United States and abroad. Sourcesinclude confidential industry interviews with renewable energy project developers, owners,financiers, consultant, and analysts; IPP public filings; public and privately reported project-levelfinancial data; and government-reported interest-rate data. The vast majority of all research wasperformed before the novel coronavirus pandemic and therefore the benchmarks do not captureany change, now or in the future, caused by it. Table ES-1 (next page) summarizes the identifiedfinancial assumptions by technology during a project’s operation for an IPP-owned electricgeneration asset, incorporating our current benchmarks with future changes in financing costsdiscussed above. The electricity sales are categorized as power purchase agreements (PPAs) orquasi-merchant.We combine these assumptions 5 with the 2020 ATB project cost, operation and maintenancecost, capacity factor, tax rate, and lifetime assumptions and calculate a projected weightedaverage cost of capital (WACC) for the different technologies, as summarized in Figure ES-1(page viii). 6Under these assumptions, the initial financing term WACC on technologies with tax creditsdecreases as these credits phase out. The after-tax benefit that tax credits provide will—all elsebeing equal—be replaced by a greater amount of cash revenue (e.g., via higher PPA prices),which in turn will allow greater leverage. And because debt is typically less costly than equity,this shift in capital structure toward more debt will lower overall financing costs (i.e., WACC),thereby partially mitigating the loss of tax benefits. WACC subsequently increases from 2025 to2030 as interest rates rise. We project an increase consistent with the Congressional BudgetOffice (CBO) estimate of the increase in 10-year Treasury bond yields from 2019 (2.1%) to 2030(3.1%, or a 100 basis point increase) in all-in construction and term debt interest rates by 2030(CBO 2020). WACC also varies by technology; we estimate that solar PV and wind electricitygeneration assets have lower cost of capital, owing to lower equity return expectations andhigher leverage. It is also important to keep in mind that while financing costs can vary bytechnology, they currently also vary greatly (1) by project ownership (independent powerproducer versus investor-owned utility versus publicly owned utility) and (2) based on theindividual characteristics of a project, its owner, and when and where it is built.5We choose 2025 as the starting point for the interest rate increase to simplify calculations and assumptions, giventhat 2025 is when all tax credits will have expired or reverted to their lower value. This is a reasonable assumptiongiven the recent announcement that the Federal Reserve plans to keep interest rates near zero through 2022(Timiraos 2020).6The 2020 ATB also has cases that reflect no consideration of tax credits and no change in interest rate. For thesecases, we ran separate leverage calculations, but input the same cost of equity and debt.viThis report is available at no cost from the National Renewable Energy Laboratory (NREL) at www.nrel.gov/publications.
Table ES-1. Summary of Current and Future Financial Assumptions by 018/2030Leverage(i.e. rm rewindPPAutility 4.0%/5.0%80%10.0%4.0%/5.0%65%/70%natural viiThis report is available at no cost from the National Renewable Energy Laboratory (NREL) at www.nrel.gov/publications.
Figure ES-1. WACC of different technologies, 2018–2030viiiThis report is available at no cost from the National Renewable Energy Laboratory (NREL) at www.nrel.gov/publications.
Table of Contents1234Introduction . 1IPP Ownership . 112.12.22.3Construction Financing . 11Term Financing . 122.2.1 Term Debt . 122.2.2 Debt Service Coverage Ratio . 152.2.3 Term Equity . 17Summary of Current IPP costs . 183.13.23.3IOU Financing . 20Publicly-Owned and Cooperative Utility Financing . 22Qualitative Comparison of IPPs, IOUs, POUs . 254.14.24.34.4Changes in Interest Rate . 27Changes in Tax Credits . 28Other Factors that May Influence Future Financing Costs. 30Summary of Financing Cost Changes Over Time . 32Utility Financing . 20Future Financing. 275 Conclusion . 36References . 37ixThis report is available at no cost from the National Renewable Energy Laboratory (NREL) at www.nrel.gov/publications.
List of FiguresFigure ES-1. WACC of different technologies, 2018–2030 . viiiFigure 1. Financial risk by technology. 2Figure 2. U.S. utilities by number of companies (left) and millions of customers (right), 2017 . 3Figure 3. Percentage of new U.S. electric generation capacity owned, by company type, beginning servicefrom 2010 to 2018 . 4Figure 4. Percentage of new U.S. hydropower capacity owned, by company type and system size,beginning service from 2010 to 2018. 5Figure 5. History of debt interest rates and components. 14Figure 6. Empirical all-in term debt interest rates for loans initiated over time, by technology. 15Figure 7. Empirical DSCR data at different probability of exceedance levels, by technology. 16Figure 8. Empirical data and medians of the after-tax levered cost of equity, by technology . 17Figure 9. IOU’s average ROE and investment grade corporate debt yield, 2010 to 2019 . 21Figure 10. Characteristics of municipal bonds. 23Figure 11. Comparison of 3% tax-exempt debt and equivalent taxable yields . 24Figure 12. Revenue bond yields, 2017–2019 . 25Figure 13. Tax credit assumptions for electric generating assets, by online date . 28Figure 14. Leverage assumed in LCOE modeling as tax credits phase down . 29Figure 15. Leverage of global renewable energy projects, by technology . 29Figure 16. WACC of different technologies, 2018–2030 . 35List of TablesTable ES-1. Summary of Current and Future Financial Assumptions by Technology. viiTable 1. Top Ten U.S. IPPs, by Technology Capacity (as of February 2020). 6Table 2. Summary of Current IPP Financial Assumptions . 18Table 3. Capital Structure, Return, and WACC Estimates for IOUs, 2010–2019 . 22Table 4. Comparison of 1%–5% Tax-Exempt Debt and Equivalent Taxable Yields . 24Table 5. Qualitative Comparison of Different Financing Approaches by IPPs, IOUs, and POUs . 26Equation 1. WACC Formula.
PSEG Public Service Enterprise Group . PTC production tax credit . ROE return on equity . . concentrating solar power (CSP), geothermal, and hydropower; conventional technologies covered 2include natural gas, coal