Transcription
An Analysis of Sports Facility Costs andDevelopment from 1989-2009The intention of the following report is to provide some insight into the changes in facilityconstruction costs among the five major professional sports leagues based in the UnitedStates. The report begins with an overall comparison among the leagues, and latercontains information related to each individual league. There are currently 137 teamsparticipating in Major League Baseball (MLB), the National Basketball Association(NBA), the National Football League (NFL), the National Hockey League (NHL), orMajor League Soccer (MLS). With venues such as Madison Square Garden, GiantsStadium, and the Staples Center being home to multiple teams, 118 different venuesconstitute the home addresses for these teams.All information was obtained from recent issues of Sports Facility Reports,Ballparks.com, or from team websites. For the MLB, NBA, NFL, and NHL allinformation begins with the 1989 season, however, MLS information does not start until1996, the league’s inaugural season.Comparing the Leagues (1989 through 2009)1
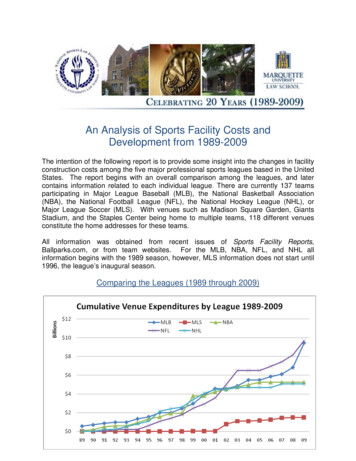
The graph above looks at the total cost of constructing a venue organized by league.Of the 118 venues currently in use by one of the 5 major sports leagues, 103, orapproximately 87%, have been built or have gone through a major renovation since1989. At least seven other venues are scheduled to be replaced in the next five years.It is clear that the NFL and MLB have spent a much larger amount of money on venueconstruction than the other three leagues. Baseball has experienced the most steadygrowth pattern. In most seasons, at least one MLB club has constructed a new venue.In the NBA and NHL, venue constructions seem to be on a similar pace. This wouldmake sense as the two leagues routinely share the same venue in a city. At firstglance, it may appear that MLS has spent significantly less capital on venueconstruction; however, the league has half the amount of teams of any other league andit is still in its infancy.The following chart shows the cumulative dollar figures spent by each league on venueconstruction from 1989-2009. If a venue hosts more than one team it was includedseparately for each individual team. For example, the Staples Center counted twicetowards the NBA total (Clippers and Lakers) and once for the NHL (Kings).2
The following chart shows a listing of the 103 new or renovated venues over the pasttwenty years. The chart lists each venue once, regardless of the amount of tenants thatcall the venue home. Along with the listing of the venue name is the opening year andthe costs to construct or renovate the facility.3
The approximate cumulative construction cost for these venues was 26.9 billion. Thiswould make the average cost of each venue 261 million. Breaking down these figuresin greater detail, of 118 venues in use, 15 were renovated (12.7%), while 88 are new(81.5%), and the other 15 venues were neither new nor renovated (12.7%). The totalcost of the fifteen renovations was 2.95 billion or an average of 196.7 million perrenovated venue. The cost of the eighty-eight new constructions was approximately 23.95 billion or an average of 271.6 million per venue.The following chart lists the fifteen current venues that are in use by one of the fivemajor sports leagues that were constructed or were last renovated before 1989. Withvery few exceptions, there are plans to replace or renovate each of these venues in thecoming years.4
The following graph shows the year-by-year spending on venue construction (eachvenue was included only once, regardless of how many tenants a facility has). As youcan see, the amount spent on venue construction costs varies greatly on a year-to-yearbasis. It would be difficult to make any larger observations about any up or down trendsin the economy and its effects on stadium financing, as financing occurs many yearsprior to a stadiums opening. However, there was a period between 1999-2003, thatsome refer to as the “golden age” in venue construction, when forty-seven new orupdated venues held their first events. In addition, in 2009, there was a significantlylarge increase in construction costs compared to any previous year. This is partially aresult of a unique financing situation for teams in New York, which opened two of themost expensive stadiums in American sports with the Yankees moving into the 1.5billion New Yankee Stadium and the Mets moving into the 860 million Citi Field. Whilesingle projects can easily influence a total year’s expense numbers, it is unlikely theover four billion spent in 2009 will be surpassed in the near future.Major League BaseballThe following three tables look at the construction costs for baseball stadiums duringthe 1989-2009 seasons. Estimated construction costs for each stadium construction orrenovation can be found in the tables.5
6
AVERAGE: The average cost of building a new venue is 388 million, comparedto the average of 181 million spent on renovating Oakland-Alameda CountyColiseum, Angel Stadium of Anaheim, LandShark Stadium, Fenway Park, andKauffman Stadium. The two New York stadiums opening in 2009 significantlyincreased the average construction costs. Prior to the inclusion of the Yankee’sNew Yankee Stadium and the Met’s Citi Field, the average new venue cost was 309 million. With the two stadiums inclusion, that figure jumps to 388 million,an increase of 25%. HIGH: The three most recent baseball venues have had the highest constructioncosts. The Washington Nationals built Nationals Park for 611 million in 2008,while New York saw the building of two new stadiums in 2009, with the Met’s CitiField costing 860 million and the Yankee’s New Yankee Stadium costing 1.5billion. LOW: In 1992, the Baltimore Orioles Oriole Park at Camden Yard cost 110million. The stadium has stood the test of time and is one of the benchmarkvenues that new constructions strive to emulate.The following graph plots the amount spent on facilities in MLB since 1989.More so than any sport, the cost of constructing a baseball venue varies greatly fromone venue to another. While inflation will cause the stadium’s average costs to continueto rise, the increase in construction expenses will likely grow at a higher rate because ofthe number of extra amenities that are now being included in venue constructions. Forexample, parking structures were over 20% of the total costs at the Yankee’s NewYankee Stadium, and for the Washington National’s Nationals Park its constructionexpenses include multiple restaurants located on the premises, as well as,environmentally friendly improvements to qualify for Leadership in Energy andEnvironmental Design (LEED) standing. LEED is a system to categorize the level of7
environmentally sustainable construction in sustainable buildings that many new venuesare incorporating into their construction plans.Major League SoccerSince the first season of Major League Soccer (MLS) in 1996, many of the league’sclubs have struggled to find a permanent venue to call home. In attempting to rectifythis situation, one of the major goals for MLS is the creation of soccer only facilities.The construction of Columbus Crew Stadium in 1999 was the first of seven soccer onlyfacilities (50% of the league facilities) that are in use by eight of the leagues fifteenteams. The table below shows the construction costs for those seven facilities.The total construction costs of these facilities were approximately 621 million, or anaverage of almost 89 million. These amounts will continue to rise with the building ofsoccer only facilities currently in the works for franchises in New York, Kansas City, andfor the Philadelphia expansion team over the next few years. It is estimated that theNew York Red Bull’s Red Bull Arena will become the most expensive MLS only venuewhen it is completed at a cost of 200 million.Three MLS teams play in stadiums that are the primary home to NFL teams. Theseteams include the New England Revolution (Gillette Stadium home of the New EnglandPatriots), the New York Red Bull (Giants Stadium home of the New York Giants andJets), and the Seattle Sounders (Qwest Field home of the Seattle Seahawks). Anoverview of these venues is included in the NFL section.Four other teams play in venues that were constructed with other sporting events inmind.8
The San Jose Earthquake has been attempting to build a soccer only facilitysince the team’s rebirth in 2008. In the meantime, the club is splitting its matchesbetween Buck Shaw Stadium and the Oakland-Alameda County Coliseum. Theclub spent about 4 million in upgrading Buck Shaw Stadium to MLS standardsin 2008. The Kansas City Wizards are playing in CommunityAmerica Ballpark, the homeof the Independent Northern League Baseball Kansas City T-Bones ballclub,while construction of its new soccer only facility continues. The Wizards agreedto pay for the addition of bleachers in left field as part of the agreement to use theballpark. The Houston Dynamo plays at Robertson Stadium, which is home to theUniversity of Houston. The stadium went through a 48 million renovation in1998 to get the facility up to Division-1 standards and the Dynamo havecontributed a few million dollars to upgrade the electrical equipment over the lastfew years. The Dynamo is another MLS club exploring its option to build asoccer only facility. D.C. United is like many of the other clubs that do not have a soccer only venue.D.C. United is looking to build its own facility so that the club can move from RFKStadium. RFK stadium underwent a 19 million renovation in 2005 to preparethe stadium for the Washington Nationals, but is still not up to MLS venuestandards.As MLS continues to grow, the teams listed above who do not currently play in a soccerspecific venue will look to construct new facilities. With the rising expectations fanshave for their stadium experience, a larger group of MLS investors, and expansion intomore cities, the cost of creating these facilities may truly rival the four establishedprofessional leagues.National Basketball AssociationThe following two tables look at the construction costs of NBA arenas from 1989-2009.Estimated construction costs for each stadium construction or renovation can be foundin the tables.9
AVERAGE: The average construction cost of the twenty-three new facilities is 205 million. The renovation costs of Oracle Arena and Madison Square Gardenaverage 171 million. Overall, the twenty-five arenas spent an average of 203million.10
HIGH: The 420 million construction cost for American Airlines Center in Dallashas clearly been the most expensive basketball arena built in the last twodecades. While the City of Dallas capped arena spending at 125 million, MarkCuban (Dallas Mavericks owner) and Tom Hicks (Dallas Stars owner) contributedthe rest of the funding. The venue had an unusually high budget to incorporatetechnology, art work, and other fan conveniences into the building, helping tomake it one of the premier venues in American sports. LOW: Ford Center in Oklahoma City was built for 89 million in 2002. The arenawas built with a smaller budget, as at the time, the city did not have an NBAfranchise. Over the course of the 2009-2011 seasons, the venue will undergoover 60 million in renovations to improve the fan experience and put the venueon a similar level of other professional basketball arenas.The following graph plots the amount spent on facilities in the NBA since 1989.Since 2005, there has been a lack of new construction in the NBA, as almost everyteam that wanted an updated arena got their wish at some point over the previoustwenty years. Many of the teams that did not receive new arenas, as well as those whodid so in the early years of this report, are currently exploring options to build newarenas or are already undergoing the process. These teams include the OrlandoMagic, Detroit Pistons, Milwaukee Bucks, Sacramento Kings, and the New Jersey Nets.At the highpoint, the 1999-2000 basketball season saw a total of seven arenasconstructed for eight different teams (the Los Angeles Lakers and Clippers share theStaples Center). Similar to baseball stadiums, NBA arenas now include many auxiliaryoptions for eating and shopping in an attempt to increase team revenues.11
National Football LeagueThe following three tables look at the construction costs for football stadiums during the1989-2009 seasons. Estimated construction costs for each stadium construction orrenovation can be found in the tables.12
AVERAGE: The construction average for the twenty new NFL stadiums is 378million. The average renovation cost for the eight stadiums is 266 million. Theoverall average for the twenty-eight renovated or newly constructed stadiums is 346 million. HIGH: The Dallas Cowboys Texas Stadium cost 1.15 billion to construct withsome sources quoting a higher number for the privately financed venue. TheColt’s Lucas Oil Stadium, the NFL’s second newest stadium, is the second mostexpensive facility at 750 million. The highest cost associated with renovating astadium is the 660 million spent on Soldier Field in Chicago. LOW: Jacksonville Municipal Stadium construction costs were 130 million.This amount is artificially low as the stadium used parts of the former Gator Bowlto help lower construction costs.The lowest completely new stadiumconstructed was Raymond James Stadium in Tampa Bay for a cost of 168million. In addition, both the Bills and Chargers significantly renovated the team’svenues for under 100 million.The following graph plots the amount spent on facilities in the NFL since 1989.Construction costs for NFL venues have risen significantly over the previous twentyyears. Between 1989 and 1995, the only NFL stadium construction was the AtlantaFalcon’s Georgia Dome. With a league expansion in 1995, football venue constructionstarted to take on a life of its own. Cities attempting to
New York Red Bull’s Red Bull Arena will become the most expensive MLS only venue when it is completed at a cost of 200 million. Three MLS teams play in stadiums that are the primary home to NFL teams. These teams include the New England Revolution (Gillette Stadium home of the New England