Transcription
01219711 FM.F7/19/027:24 AMPage iiiMastering the SAP Business InformationWarehouseKevin McDonaldAndreas WilmsmeierDavid C. DixonW.H. InmonWiley Publishing, Inc.
219711 Ch07.F7/19/027:25 AMPage 279CHAPTER7Information Access, Analysis,and PresentationThe old saying that you can lead a horse to water but you can’t make it drink is particularly apropos when discussing business intelligence tools. Information access andpresentation is a topic that is often the center of great debate and controversy. Even if atool delivers the right information to the right user at the right time, there is no guarantee that the user will use the tool. No single information access tool can satisfy anorganization’s or even an individual’s requirements. It is not uncommon for eachdepartment to insist on using a particular tool because of its unique requirements. SAPBW has and supports a broad range of presentation and access tools that turn data intoinformation and deliver it to the desired consumer.In Chapter 6 we described how to integrate and transform data so it may be storedin SAP BW storage constructs such as ODS objects, InfoCubes, and master data. Thischapter picks up where Chapter 6 left off. Here we’ll highlight the main services provided in SAP BW that retrieve data, turn it into meaningful business information, anddeliver that information to an information consumer. The chapter has been organizedinto two main sections: SAP BW information access and analysis services and SAP BWpresentation services.279
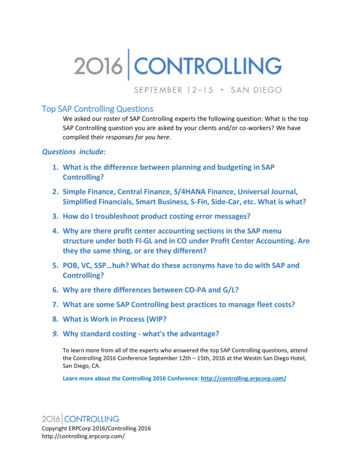
2807/19/027:25 AMPage 280Chapter 7ArchitectureSAP BW presentation services layer includes all the components required to presentinformation available on the SAP BW server in the traditional Microsoft Excel-basedBusiness Explorer Analyzer, in the Business Explorer Web Environment, or in thirdparty applications. Figure 7.1 illustrates the main architectural layers of SAP BW. Inthis chapter, we’ll build on the previous chapters and start with the presentation services layer then. Then we’ll move into the information access and analysis serviceslayer. We will also highlight the interfaces that are exposed to third-party reportingand presentation tools.Query Processing OverviewThe query process in SAP BW is a series of requests and responses, including requestsfor information, database selections, application caching, number crunching, information formatting, and ultimately responding to the requester by presenting results sets.From an end user’s perspective this process has been abstracted to the point that theend user’s only concern is making a request for information that will lead him or herto solve the particular business problem at hand. However, behind the scenes, SAP BWis busy at work creating the optimal database access plan, locating aggregates, converting currency, applying hierarchies, filtering, and so on.Let’s look at the query request response process in the context of a typical businessquestion. We will use the example of analyzing revenue and contribution marginsacross multiple geographies and customers to illustrate how the information requestresponse process works in SAP BW. Figure 7.2 depicts the analysis process in SAP BW.Presentation ServicesAnalysis & Access ServicesStorage ServicesETL ServicesFigure 7.1 Main architectural levels of SAP BW.Meta Data ServicesAdministration Services219711 Ch07.F
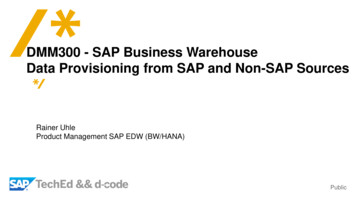
219711 Ch07.F7/19/027:25 AMPage 281Information Access, Analysis, and PresentationWorkbookApplication / File /Database TableQuery ViewInfoSpokeQuery(Query Cube)Query BuilderInfoProvidersInfoSetsVirtual CubesAggregatesODS ObjectMaster DataInfoCubeFigure 7.2 Analysis processing.In our scenario, we’ll assume that this is the first time the corporate controller hasrequested contribution margin and revenue to be analyzed by geography and customer. After launching her favorite Web browser and navigating to the SAP BW reporting homepage on the corporate intranet, the controller selects the Create New Queryoption. After selecting this option, she invokes the meta data services of SAP BW toreturn a list of potential information providers that may be queried. The controllerselects the appropriate InfoProvider, and again invokes the meta data services in SAPBW. The services return a list of dimensions that contain characteristic InfoObjects aswell as a list of key figures. The controller selects the Revenue and Contribution key figure, as well as the Geography and Customer characteristics, and assigns them to the rowsor columns of the query result sets based on her preference. She then executes thequery.At the center of the information access, analysis, and presentation services in SAPBW is the OLAP engine. An information consumer application requests informationfrom the OLAP engine in the form of a multidimensional expression or similar selection request. In our example the controller requests revenue and contribution marginfor the current period and fiscal year for all customers and all geographies. Leadingbusiness intelligence tools generate selection expressions so the end users do not needto know the specific syntax. The request is sent from the browser to the SAP BW server.Consumers may be a browser, mobile device, Excel spreadsheet, or as in our example,a third-party client application. The SAP BW server takes the request through one of a281
219711 Ch07.F2827/19/027:25 AMPage 282Chapter 7number of standard interface techniques and hands it to the OLAP engine for fulfillment. (We will describe the interfaces in detail later in this chapter.)The SAP BW server takes the request and determines if there is an aggregate cube inexistence that may satisfy the request. In our example an aggregate cube that summarizes customer or geographies may be a candidate for optimal retrieval. If no suchaggregate cubes exist for the query, the application server makes a request to the database server.N OT E SAP BW attempts to limit the number of round trips from presentationserver to database server by caching and reusing query results and navigationsteps on the application server in a cross-transactional buffer after it has beenselected from the database. This caching technique was introduced in version3.0b with the goal of sharing memory across user sessions.The database requests and selects records from an InfoProvider, or an aggregate,that is stored in a relational database or multidimensional database for aggregates as astar schema. The records that are selected from the database server may be returned tothe application server. Depending on the query’s read mode settings, records arecached for the OLAP engine to process and, ultimately, to calculate and return a querynavigation state to the presentation server. The caching of the selected data on theapplication server is sometimes referred to as a query cube depending on the read modethat is set for the query. The OLAP engine will use the query cube to calculate andreturn result sets to the client for subsequent information requests, assuming the querycube contains the necessary data to respond to the request. We will discuss the optionsfor setting a query’s read mode and the impact on performance in Chapter 10.The controller in our example would receive a listing of revenue and contributionmargins for all customers in all geographies. She notices that revenue, which is displayed in U.S. dollars (USD), is higher than she had planned and proceeds to investigate which geography is exceeding her expectations. Her request is sent from the clientto the application server, where it is once again handled by the OLAP engine. Once theappropriate storage service returns the records, the OLAP engine creates the querydata and proceeds as previously described. The controller learns that the United Kingdom is exceeding her sales expectations.Note that the OLAP engine will take care of any currency translations based on themeta data of the InfoObjects included in the query, as well as the meta data of the queryitself. In this case the geographies are countries, and most countries have their owncurrency. The controller also may wish to analyze the revenue in the group currency ofUSD. Upon doing so, she notices that Argentina has failed to meet her sales expectation. Not satisfied she has found the cause of the shortfall, she investigates further andrequests the currency be converted to local currency for all countries. A request is onceagain sent to the OLAP engine to be processed. The local currencies are either retrieved
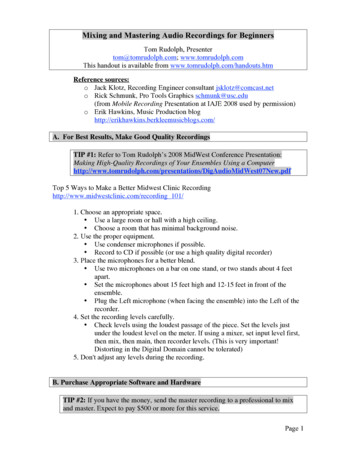
219711 Ch07.F7/19/027:25 AMPage 283Information Access, Analysis, and Presentationor calculated, depending on the modeling of the InfoMart, and the newly calculatedquery slice is returned to the client. Now the controller realizes that Argentina did infact meet sales expectation but experienced a significant foreign exchange impact as aresult of the rate dropping.The process of requesting and responding to queries is the central concept of thischapter. We will first investigate the presentation services and then move to the information access and analysis services. It is not our intent here to re-create SAP documentation, nor is it possible for us to cover every reporting and analysis feature of SAPBW. However, we will look behind the scenes at the central services SAP BW performsand lay out the possible options for putting them to use to solve business problems.Presentation ServicesSAP BW presentation services layer includes all components required to present information available on the SAP BW server, including the traditional Microsoft Excelbased Business Explorer Analyzer, the Business Explorer Web applications, andBusiness Explorer Formatted Reporting. Mobile device and Enterprise Portal supportare rendered from the same set of Business Explorer Web services as the BusinessExplorer Web applications. Figure 7.3 provides an overview of the components of thepresentation services layer.The line between the BEx Query Designer and BEx Analyzer is often blurred, as thetools are tightly integrated and users of the BEx Analyzer are often also query designers. There are numerous features that are often described as part of the BEx Analyzerwhen, in fact, they are part of the BEx Query Designer. Rather than split hairs, we haveseparated the Designer’s functions and Analyzer’s functions based on where the specific features are used in the process of creating and analyzing.Business Explorer ComponentsThe Business Explorer (BEx) is much more than an Excel add-in that allows access tothe SAP BW server. There are several areas that the Business Explorer in SAP BW nowcovers—for example, support for formatted reporting, mobile devices, and pureHTML-based Web applications. The Business Explorer’s integration with SAP Enterprise Portals enables a single point of entry for a wide spectrum of end-user roles andbusiness-related information packs. This enables collaboration and integration withnonstructured information such as documents that capture users’ comments on suchthings as the explanation of variances, justification for changes in forecast figures,graphics, syndicated information available via the Internet, and the ability to unify theanalytics served by SAP BW with transaction processing applications. This functionality allows end users to dynamically create personalized analytic applications.283
7:25 AMPage 284Chapter 7Front EndMS rd partyapplicationBEx Web AppDesignerBEx QueryDesignerBEx WebServicesInternetGraphicsServerMonitorMeta DataModelingBExAnalyzerBExFormattedReportingXML / AInterfaceIDBOInterfaceMeta Data ServicesReportingAgentPresentation ServicesScheduler2847/19/02Administration Services219711 Ch07.FAnalysis & Access ServicesStorage ServicesMetaDataManagerETL ServicesMeta DataRepositoryFigure 7.3 Presentation services.In Figure 7.3 you will notice that the Business Explorer consists of several components: BEx Query Designer, BEx Analyzer, BEx Web Application Designer, BEx Formatted Reporting, and BEx Mobile Device Support. The BEx is designed to meet a vastrange of business needs, from simple list reports (e.g., all the customers in a range ofzip codes) to the complex (e.g., elimination of intrabusiness volume), while takinginto account the local currencies and fiscal year variants of the business entities. TheBEx is designed to appeal to a wide range of business users, from hunters and farmerto miners and explorers. Various end users will interact with the BEx tools. Farmers,for example, may request information via a Web browser by entering a URL. Explorers,on the other hand, may use the BEx Analyzer to create and re-create complex queriesbased on their findings. (For an explanation of the different group types, see Chapter 5.)In this next section we describe BEx queries from design to execution, along withpowerful OLAP functions that may not be obvious to the casual or first-time user.Throughout this chapter we refer to each of the five Business Explorer components bytheir specific names.BEx Query DesignerAll multidimensional reporting and analysis performed in SAP BW is based on a querydefinition stored in the Meta Data Repository. Queries provide access to multidimensional information providers (InfoCubes), as well as flat information providers (ODS
219711 Ch07.F7/19/027:25 AMPage 285Information Access, Analysis, and Presentationobjects, master data). The Business Explorer Query Designer allows you to define queriesin an interactive standalone application by simply dragging and dropping the desiredmeta data objects into the query results area.A query is a specification of a certain dynamic view on an InfoProvider used for multidimensional navigation. Queries are the basis for all kinds of analysis and reportingfunctionality available in SAP BW.The BEx Query Designer is a standalone tool for defining queries. For some readers,query may conjure up the image of an SQL generator that creates a simple list ofrecords. The BEx Query Designer is a graphical tool for defining both tabular queriesand multidimensional queries that access powerful OLAP functions. The BEx QueryDesigner, while a standalone client program, interacts with the SAP BW server, morespecifically the Meta Data Repository. Meta data about a query’s InfoProvider ispassed to the Query Designer so the form and function of a query may be defined andready for ad hoc execution. Note that only one InfoProvider may be assigned to aquery. If more than one InfoProvider is needed, a MultiProvider has to be used. Wehave covered this topic in Chapter 5.All characteristics, navigational attributes, and key figures available through anInfoProvider are available for use in query definitions. Because queries are multidimensional objects, they effectively define subcubes called query cubes on top of theInfoProvider. Query cubes define the degree of freedom available for query navigationin the presentation layer.To define a query, the Designer is launched in one of five ways: As a client application From the Web Application Designer Via the HTML Query Designer Via the traditional BEx Analyzer in Excel Via the Crystal Reports DesignerThe first option the query designer has is selecting an existing query from a list offavorites or from a list of queries that have been assigned to the specific role thedesigner has in the organization. If the query does not exist, a new one may be created.Next, an InfoProvider for the new query is selected. The InfoProvider, as we will discuss further later in this chapter, is an abstraction layer that allows the query designerto define both tabular and multidimensional queries with the same tool without regardto how or where the physical data is stored. Upon selecting an InfoProvider, the querydesigner will see a list of meta data defining the following elements:Structures. Predefined selection and layout criteria for a row or column that maybe reused in all queries for a particular InfoProvider. Structures may contain acombination of key figures, characteristics, and formulas. A reusable structure is aparticular, commonly used collection of key figures or characteristics stored inthe Meta Data Repository for reuse in multiple queries (e.g., a plan/actual variance or a contribution margin schema).Key figures. A type of InfoObject that is used to record quantitative facts ormeasures. All of the key figures for a particular InfoProvider are available forqueries. A calculated key figure is a formula consisting of basic, restricted, or other285
219711 Ch07.F2867/19/027:25 AMPage 286Chapter 7calculated key figures available in the InfoProvider stored in the Meta DataRepository for reuse in multiple queries (e.g., an average discount rate).A restricted key figure is a key figure with an associated filter on certain characteristic values stored in the Meta Data Repository for reuse in multiplequeries (e.g., year-to-date sales of previous year). A query consists of metadata elements arranged in rows, columns, and free characteristics.Dimensions.The logical grouping of characteristic InfoObjects in InfoCubes.The query elements assigned to the rows and columns are displayed in the initialquery view. Free characteristics are not displayed in the initial query view. Free characteristics are available for navigation in the BEx Analyzer or in analytic Web applications. Each individual navigational step (drill down, drill across, add/remove filters,etc.) in the analysis process provides a different query view, and the steps are controlledby the BEx Analyzer, BEx Web applications, or third-party tools.Query definitions are created and maintained in the BEx Query Designer by simplydragging the available query elements into the rows, columns, free characteristics, orfilter areas and eventually defining additional properties. The Query Designer alsointegrates all functionality required to define the query elements. Query elementsinclude characteristics, key figures, calculated key figures (formulas), restricted keyfigures, and reusable structures. Queries may have filters on characteristic values or filters on key figure values (conditions) assigned to select a certain slice of informationfrom the InfoProvider, and they may be parameterized by query variables. Exceptionsassigned to a query help identify key figure values regarded exceptional from a business point of view.The simplest type of query is a tabular query. Tabular queries are often used to generate listings of master data, such as a listing of all customers in the state of Illinois. Forinstance, you could create such a query by locating the InfoObject for the characteristicState and dragging and dropping it to the column window. You could then right-clickon the state to restrict the query to just the state of Illinois. You complete this simpletabular query by dragging and dropping the characteristic Customer to the columnwindow.N OT E Defining selection values that are valid for all the columns and rowsof a query in the filter window will improve query performance.Multidimensional queries provide more options but still are easy to define and use.Figure 7.4 illustrates the options a query designer is presented when working withmultidimensional queries. Along with the rows definition window there is also a FreeCharacteristics window. In multidimensional mode, the query creator drags and dropskey figures and the characteristics desired in the query from a dimension to the desiredcolumn or row. As the InfoObjects are placed in a row or column a preview of the queryresults is displayed. The designer may also place characteristics in the Free Characteristic or Filter window. Free characteristics are selected as part of the query’s logic butare not displayed in the default view of the query. They may, however, be used fordrill-down and drill-across functions by the user of the BEx Analyzer or Web application. You use filters to limit the selection of data to a particular characteristi
In Figure 7.3 you will notice that the Business Explorer consists of several compo-nents: BEx Query Designer, BEx Analyzer, BEx Web Application Designer, BEx For-matted Reporting, and BEx Mobile Device Support. The BEx is designed to meet a vast range of business needs, from s