Transcription
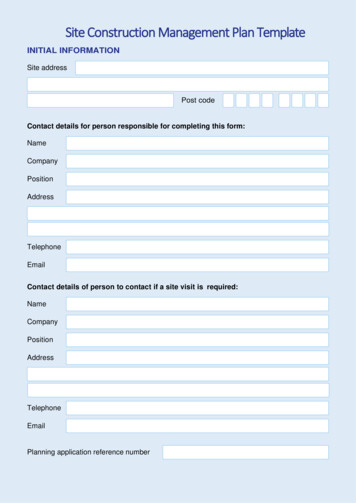
The Shaffer 4 C's of Data Visualization"Clean" ExamplesDefault in ExcelCategory JCategory ICategory HCategory GCategory FCategory ECategory DCategory CSeries1Category ASeries1302520151050Category B2520151050Default in ExcelRemove/Lighten Gridlines and lower # of Y-Axis Tick Marks302010030Category 10Series1Avoid Rotated Text3020100Category JCategory ICategory HCategory GCategory FCategory ECategory DCategory BRotate Chart Instead0102030Category Category CCategory BCategory ACategory A3020100Category C0Category ACategory CCategory BCategory A20Series1Series1Category BCategory CCategory DRemoved Series NameCategory ICategory GCategory ECategory CCategory A0102030
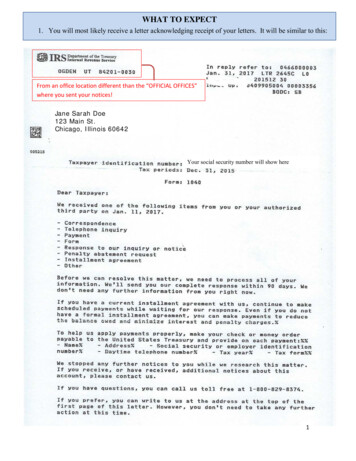
The Shaffer 4 C's of Data Visualization"Clean" ExamplesOrder BarsOrder Bars0Category BCategory DCategory A10202030Category GCategory BCategory JCategory CCategory ECategory DCategory HCategory ACategory ICategory FCategory C01030Removed tick marks on y-axisNote - Labels in units of 10 with gridlines. Added minorgridlines and minor ticks in units of 5.Ordering Data adds context unless a specific order is required.Ex. North, South, East, West (save alphabetical order for reference tables)Remove BorderRemove Border0Category BCategory DCategory A102020Category GCategory BCategory JCategory CCategory ECategory DCategory HCategory ACategory ICategory FCategory C01030If reasonable number of bars consider data labels instead of axis labelsCategory B23Category C17Category D23Category CCategory DCategory A171412Category C1714Category A12Category B23Category D14Category ACategory B12Category B23Category C17Category D14Category A1230
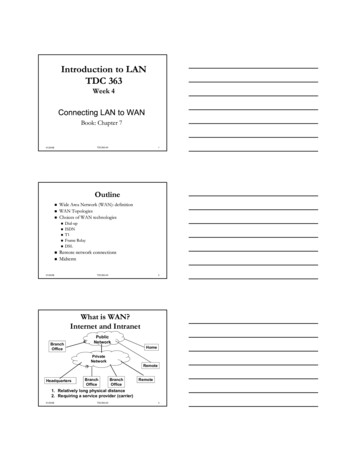
The Shaffer 4 C's of Data Visualization"Clean" ExamplesFine Tune Colors (ex. Dark Gray vs. Black)Category B23Category CCategory DCategory A171412Add Context - Ex. add Target Line, Expected Value or AverageCategory B23Category CCategory DCategory A17Tip - Add target lines and text at last step toavoid reformatting of chart. Using a dotted lineor different color will help contrast the target linevs. a gridline.1412Target 16%Avoid Stark Borders on BarsCategory B23Category CAvoid 3D BarsCategory BCategory C17Category DCategory DCategory A14Category A0 5 1015 20 253012Avoid Narrow BarsCategory B23Category CCategory DCategory A171412Avoid Connected Bars (unless distribution)Category B23Category CCategory DCategory A171412Note - distributions are typically graphed as vertical bars, connected and with a border.
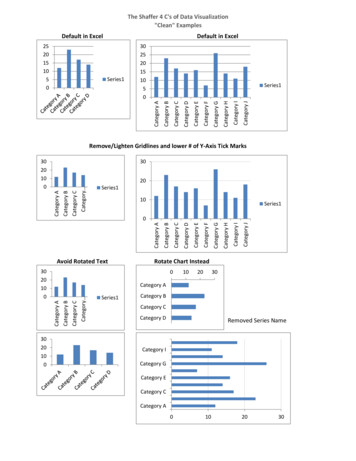
The Shaffer 4 C's of Data Visualization"Clean" ExamplesAvoid Repeated Text. Example, if "Category" were truly repeated vs. unique names.Example with y-axis and one highlighted data point. 3 labels vs. 10 Data points.2620100GBJCEDHAIFCategoryExample with 10 data points and no y-axis.2623181716141412117GBJCEDHACategoryAdd Title (tell the story)Include Labels ( , # or %), Data Source, Date, Author, etc.Bananas exceeded target by 7 units in 2011(# of units sold)Bananas23Apples17GrapesOranges1412Target 16 unitsSource - 2011 Actual Sales from BI ToolCreated by Jeffrey A. Shaffer2/17/2011IF
The Shaffer 4 C's of Data Visualization"Clean" ExamplesSometimes it's necessary to show a % of a total. Example, Bananas as a % of total fruit.Avoid Pie nanas35%Grapes21%21%Apples26%26%Use bar charts for easier comparison and 100% stacked-bar chart for part to wholeBananas exceeded target by 7 units in 2011(# of units sold)Bananas23Apples17Grapes14Oranges12Target 16 unitsBananas represent 35% of total unit salesBananas35%Source - 2011 Actual Sales from BI ToolCreated by Jeffrey A. Shaffer2/17/2011Apples26%Grapes21%Oranges18%
The Shaffer 4 C's of Data Visualization"Clean" ExamplesHere is an excellent example of these practices in use taken from:TDWI Best Practices Report entitled "Transforming Finance" by Wayne Eckerson
Feb 17, 2011 · The Shaffer 4 C's of Data Visualization "Clean" Examples Removed tick marks on y-axis Ordering Data adds context unless a specific order is required. If reasonable number of bars consider data labels instead of axis labels Note - Labels in units of 10 with gridli